Volume 58, 2019, Pages 247–256
Proceedings of 34th International Confer-ence on Computers and Their Applications
Enhanced Prediction Models for Predicting Spatial
Visualization (VZ) in Address Verification Task
Thitivatr PatanasakPinyo
1, Georgi Batinov
2, Kofi Whitney
2, Adel Sulaiman
2,
and Les Miller
21
Faculty of Information and Communication Technology, Mahidol University Salaya, Nakhon Pathom, 73170, Thailand
2 Department of Computer Science, Iowa State University
Ames, Iowa, 50011, USA
(batinov, kwhitney, aadel, lmiller)@iastate.edu
Abstract
In the field of Human Computer Interaction and Psychology, it is accepted that spatial visualization (VZ) is one ability that can indicate individual’s performance on computer applications. Since users with different levels of VZ seem to prefer different types of user interfaces (UI), knowing a user’s level of VZ provides a great opportunity for application developers to design software with higher satisfaction and usability. In this paper, we proposed three models to predict a participant’s level of VZ based on the participant’s actions (taps) on the tablet screen while doing an address verification task in the neighbor-hood using the tablet. After applying the proposed prediction models with data of thirty participants, they yielded an optimal accuracy of 93.33%.
1
Introduction
using a location-based software application on a tablet. The main contribution of this paper is the development of a new feature set for VZ prediction in address verification software. The new feature set allowed us to predict the VZ category of participants at a higher rate than was shown in Batinov [2]. To test the power of the new feature set, we compared it to two other feature sets derived from Batinov [2].
We organized this paper as follows: Section2examines related literature. Section3describes the methodology that we used to design and implement the models. Section 4 shows the improvement of accuracy when we executed the new models with some discussion. Finally, Section5summarizes the contribution described in this paper.
2
Related Work
VZ is one ability that belongs to the set of human spatial ability. Several scientists discovered that VZ provides an indicator of the performance of a user using computer software [4,7,12]. Other studies also show that VZ might be used to predict the level of success a user has while using software [10,11]. Furthermore, it was also known that users with a high VZ level tend to perform better than users with low VZ level when it comes to software usage performance [6]. Batinov et al. showed that the effect of VZ also holds in the task of address verification [1].
Batinov [2] proposed a prediction model that can predict an individual’s level of VZ (either high or low). We built on his work in our proposed work, which we describe in Section3.
3
Methodology
Batinov [2] created a prediction model that predicts an individual’s level of VZ using the actions that the user performed while using the application. We denote Batinov’s model byM0. In his study, he asked participants to verify addressing units whether or not they were located in the correct location. A participant was equipped with the location-based software application that contained a map of focused neighborhood, a list of addresses to be verified, and necessary map operations, e.g., pan & zoom. Every time a participant performed an action on application UI, the action was logged. He then extracted data from the log file to create instances forM0.
In M0, a set of features of each participant, denoted by F(M0), consists of twenty-two features and one class attribute. Particularly, for each participant,F(M0) contains six numbers he/she specifically changed a focus to addresses 1, 2, 3, 4, 5, or 6, respectively (Note that Batinov had six addresses in his study), a number he/she changed a focus to any address, a number he/she clicked zoom-in icon, a number he/she reset the map, a number he/she panned up, a number he/she clicked zoom-out icon, a number he/she attempted to pan beyond the map, a number he/she did 1-level zoom out by slider, a number he/she clicked center zoom, a number he/she panned right, a number he/she panned left, a number he/she panned down, a number he/she did 3-level zoom in by slider, a number he/she did 1-level zoom in by slider, a number he/she did 2-level zoom out by slider, a number he/she did 2-level zoom in by slider, a number he/she did 3-level zoom out by slider, and a class attribute. The class attribute specifies the actual level of VZ (high/low). The classifier that was implemented is Bagging [5]. The base classifier of Bagging is REPTree, which is a default base classifier for Bagging in Weka.
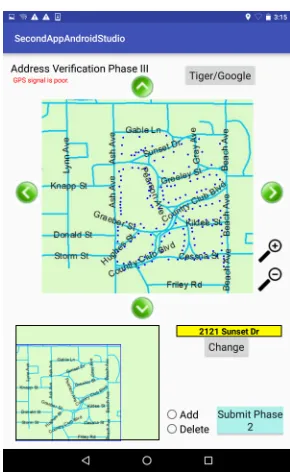
both phases was a type of UI of the software application. Every participant was randomly assigned either traditional UI or adaptive UI to be used for verification in the first phase. If the traditional UI was selected for the first phase, the adaptive UI then was assigned for the second phase and vice versa. The traditional UI was a UI that contained only necessary tools such as zoom buttons, pan buttons, real-time location (GPS), Object-Indexing [16], and etc. The adaptive UI was a UI that contained both necessary tools and additional UI features that were evidently useful for participants with different levels of VZ. An example of those UI features was a landmark on the map, which increased usage performance of participants whose VZ level was low [13,18,21]. Figure1shows the application UI in our study (traditional UI).
After applying M0 with data set gathered from our study, we retrieved the prediction accuracy of 83%. Although 83% is highly acceptable, we decided to improve the model further with the goal to maximize prediction accuracy as much as possible. We came up with three new prediction models: Prediction Models I, II, and III, which are denoted byM1, M2, and M3, respectively.
Figure 1: Application UI (Traditional).
3.1
Prediction Model I (
M
1)
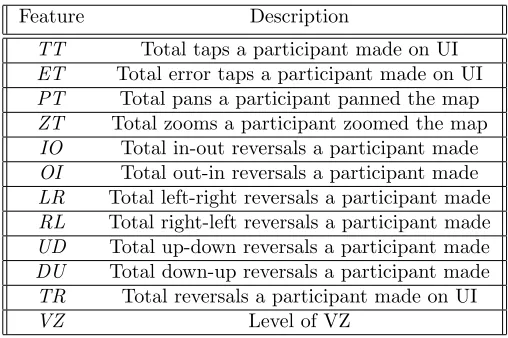
For the first model, M1, we replaced the base classifier of Bagging with J48 rather than REPTree. We defined a new set of features, denoted by F(M1), as F(M1) = {TT,ET,PT,ZT,IO,OI,LR,RL,UD,DU,TR,VZ}. Table1 describesF(M1).
Feature Description
TT Total taps a participant made on UI ET Total error taps a participant made on UI PT Total pans a participant panned the map ZT Total zooms a participant zoomed the map
IO Total in-out reversals a participant made OI Total out-in reversals a participant made LR Total left-right reversals a participant made RL Total right-left reversals a participant made UD Total up-down reversals a participant made DU Total down-up reversals a participant made TR Total reversals a participant made on UI
VZ Level of VZ
Table 1: A Set of Features of M1(F(M1)).
participant made. A reversal is a series of map operations that, finally, yields the same result as the original map before performing those operations [1]. For instance, a participant pans right and pans left the map, which results the same map area before panning. IO stores a number of in-out reversals, which is a reversal caused by zooming in the map followed by zooming out the map. Similarly forOI, it stores a number of out-in reversals. LR, RL,UD, andDU focus on reversals by panning. LR stores a number of left-right reversals, which caused by panning left followed by panning right. Similarly, RL, UD, and DU store numbers of right-left reversals, up-down reversals, and down-up reversals, respectively. The last one,VZ, is the class attribute specifying level of VZ (low/high).
3.2
Prediction Model II (
M
2)
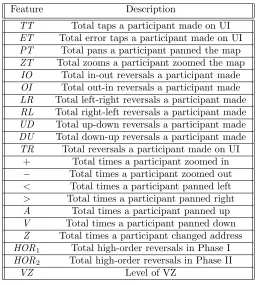
The second model,M2, inherited classifier and base classifier fromM1, which are Bagging with J48 as base classifier, respectively. We defined a set of features for M2 (F(M2)) asF(M2) = {TT,ET,PT,ZT,IO,OI,LR,RL,UD,DU,TR,+, −, <, >,A,V,Z,HOR1,HOR2,VZ}. Ta-ble2describesF(M2).
Feature Description
TT Total taps a participant made on UI ET Total error taps a participant made on UI PT Total pans a participant panned the map ZT Total zooms a participant zoomed the map
IO Total in-out reversals a participant made OI Total out-in reversals a participant made LR Total left-right reversals a participant made RL Total right-left reversals a participant made UD Total up-down reversals a participant made DU Total down-up reversals a participant made TR Total reversals a participant made on UI
+ Total times a participant zoomed in − Total times a participant zoomed out < Total times a participant panned left > Total times a participant panned right A Total times a participant panned up V Total times a participant panned down Z Total times a participant changed address HOR1 Total high-order reversals in Phase I HOR2 Total high-order reversals in Phase II
VZ Level of VZ
Table 2: A Set of Features of M2(F(M2)).
Previously inM1, we focused on a reversal that consisted of exactly two map operations, for example, pan up & pan down or zoom in & zoom out. However, after taking more closer look at log file of every participant, we found an interesting pattern. This pattern was a series of two pairs (four map operations) of reversal such that any single map operations in the series can be arranged in any permutation as long as the series preserved reversal property, i.e., a result after performing all those map operations in the series is the same as the original map before performing. We named this pattern ashigh-order reversal – degree 2since it contained two pairs of reversal. Examples of high-order reversal – degree 2 are{pan-up, pan-down, zoom-in, zoom-out}or (pan-left, pan-left, pan-right, pan-right). For the latter, two map operations from the same pair of reversal do not need to be contiguous to each other, e.g., pan-right does not need to follow pan-left. The last attribute,VZ, is the class attribute specifying level of VZ.
3.3
Prediction Model III (
M
3)
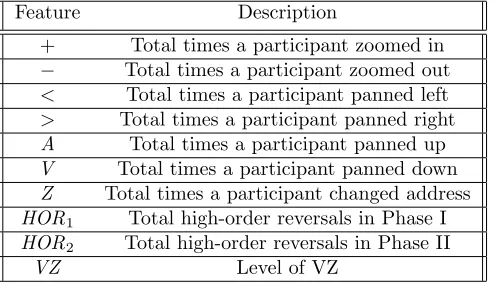
After we have got two prediction models,M1 andM2, we would like to see how the additional features that we added to F(M2) affected the prediction accuracy. Therefore, we created the last prediction model, denoted as M3, such that F(M3) = F(M2)\F(M1) = {+, −, <, > ,A,V,Z,HOR1,HOR2,VZ}Hence,F(M3)⊂F(M2). Table3 describesF(M3).
Feature Description
+ Total times a participant zoomed in − Total times a participant zoomed out < Total times a participant panned left > Total times a participant panned right A Total times a participant panned up V Total times a participant panned down
Z Total times a participant changed address HOR1 Total high-order reversals in Phase I HOR2 Total high-order reversals in Phase II
VZ Level of VZ
Table 3: A Set of Features of M3(F(M3)).
4
Results and Discussion
M0, M1, M2, and M3 were implemented and tested using data set from our study, which consisted of thirty instances. Each instance represents features of each participant. Every feature and class attribute are non-identifiable data with respect to the protocol of IRB [14]. For each model, the classifier was Bagging with 10 iterations and J48 as base classifier.
4.1
Classification Results of
M
0Batinov [2] ran multiple tests to test his M0. There were twenty-two tests. For each test, it had thirty-one instances representing thirty-one participants. The difference between each test was a recessed radius when he logged (but we will not go into detail about it in this paper). The average accuracy were around 82%.
Although M0 did not perfectly fit with our data due to the difference between UIs of Batinov’s software [2] and ours, e.g., some features such as a number of zoom-in by slider would be 0 because our UI has no slider, we still appliedM0with our data for observation. M0yielded an accuracy of 90% (27 correctly predicted participants). One participant who tested low VZ was classified as high VZ and two participants who tested high VZ were classified as low VZ.
4.2
Classification Results of
M
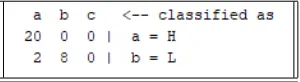
1There were twenty-eight correctly classified instances, which was around 93.33%. Two partic-ipants who tested low VZ were classified as high VZ. Tables 4 and 5 show the summary and confusion matrix, respectively.
Table 5: Confusion Matrix ofM1.
4.3
Classification Results of
M
2For evaluation on training data, there were twenty-eight correctly classified instances, which was 93.33%. Two participants who tested low VZ were classified as high VZ. Furthermore, those misclassified two were the same participants who were incorrectly classified in M1. Tables 6 and7show the summary and confusion matrix, respectively, for the 30 participants.
Table 6: Summary ofM2.
Table 7: Confusion Matrix ofM2.
4.4
Classification Results of
M
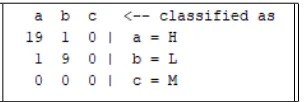
3There were twenty-eight correctly classified instances, which, again, was 93.33%. Tables8and 9 show the summary and confusion matrix, respectively. According to Table9, there was one participant who tested low VZ but classified as high VZ. This participant was the same one who was misclassified in bothM1andM2. There was another participant who tested high VZ but classified as low VZ.
Table 9: Confusion Matrix ofM3.
At first, we expected to see better prediction result fromM2becauseM2 was the extended version ofM1. However, the actual outcome was opposite. There are potentially two causations that we were curious. One causation is that the number of our instances was not big enough. From thirty participants, there were participants that tested high VZ but his/her actual behav-ior was more like low VZ (and another way around). For example, one participant might test high VZ but he/she created a reversal, which is a behavior of low VZ participant when getting lost [1], multiple times in the field. Perhaps his/her intention was just to explore the UI. This incident plausibly reduces the performance ofM2.
Another causation that is worth taking a look is the difference between M1 and M2. As mentioning earlier, we created a new model, M3, where F(M3) =F(M2)\ F(M1). An inter-esting result of M3 is that it incorrectly classified two instances. One misclassified instance was a participant who tested high VZ. Another one was a participant who tested low VZ. The result of classification of M3 was different compared to M1 and M2 in term of there existing a participant who tested high VZ but classified as low VZ, which never existed in previous two models. This misprediction was potentially caused by the same incident we have already mentioned: a participant that tested high VZ but his/her actual behavior was more like low VZ.
With this observation, a potential improvement that we would like to mark as a guideline for future work is to increase a number of instances and allow high-order reversal with degree higher than 2 to be included. Although it can affect a process of UI design such as total levels of zoom must be deeper to make a series of zoom tap relevant and significant, this guideline would help creating a new model of VZ prediction on location-based application with higher accuracy.
5
Conclusion and Future Work
We proposed three prediction models, M1, M2, and M3, that predicted level of VZ of par-ticipants when they used the location-based software application to verify addresses in the neighborhood. A difference between those three is a set of features. Features ofM1consists of metrics of map operations such as total taps or total zooms. It also contains numbers of rever-sal pair such as left-right reverrever-sal. M2 is the extended model ofM1. We added some features from Batinov’s model [2] intoF(M2) such as number of zoom-in. We also added numbers of high-order reversal intoF(M2).
After we applied bothM1 andM2on data that we gathered from thirty participants in the address verification task using location-based software application, they returned same accuracy rate, which is 93.33%. 93.33% was the first contribution of our proposed work since we are not aware of a prediction model that could predict VZ level of user from user’s set of map operations and yielded more than 90% accuracy rate.
also yielded the accuracy of 93.33% with dissimilar classification result.
The work described here will be incorporated into the address verification software used in [14]. The software will be used to test the impact on the workflow of the higher VZ prediction rates.
References
[1] Georgi Batinov, Michelle Rusch, Tianyu Meng, Kofi Whitney, Thitivatr Patanasakpinyo, Les
Miller, and Sarah Nusser. Understanding map operations in location-based surveys. In Eighth
International Conference on Advances in Computer-Human Interactions (ACHI 2015), pages 144– 149, Lisbon, Portugal, 2015.
[2] Georgi Iliev Batinov.Computer detection of spatial visualization in a location-based task. Graduate
Theses and Dissertations: http://lib.dr.iastate.edu/etd/15103, 2017.
[3] D Benyon, PR Innocent, and D Murray. System adaptivity and the modeling of stereotypes,
inter-act’87. InSecond IFIP Conference on Human-Computer Interaction, Stuttgart, Elsevier Science
Publishers, 1987.
[4] DR Benyon and DM Murray. Special issue on intelligent interface technology: editor’s introduction.
Interacting with Computers, 12(4):315–322, 2000.
[5] Leo Breiman. Bagging predictors. Mach. Learn., 24(2):123–140, August 1996.
[6] Thorsten B¨uring, Jens Gerken, and Harald Reiterer. Usability of overview-supported zooming on
small screens with regard to individual differences in spatial ability. InProceedings of the working
conference on Advanced visual interfaces, pages 233–240. ACM, 2006.
[7] Dennis E Egan. Individual differences in human-computer interaction. Handbook of
human-computer interaction, pages 543–568, 1988.
[8] Ruth B Ekstrom, John W French, Harry H Harman, and Diran Dermen. Manual for kit of
factor-referenced cognitive tests. Princeton, NJ: Educational testing service, 1976.
[9] Mark Hall, Eibe Frank, Geoffrey Holmes, Bernhard Pfahringer, Peter Reutemann, and Ian H
Witten. The weka data mining software: an update. ACM SIGKDD explorations newsletter,
11(1):10–18, 2009.
[10] David F Lohman, James W Pellegrino, David L Alderton, and JW Regian. Dimensions and
components of individual differences in spatial abilities.Intelligence and cognition: Contemporary
frames of reference, pages 253–312, 1987.
[11] Mark G McGee. Human spatial abilities: Psychometric studies and environmental, genetic,
hor-monal, and neurological influences. Psychological bulletin, 86(5):889, 1979.
[12] Kent L Norman. Spatial visualization—a gateway to computer-based technology. Journal of
Special Education Technology, 12(3):195–206, 1994.
[13] Elizabeth M O’Laughlin and Bradley S Brubaker. Use of landmarks in cognitive mapping: Gender
differences in self report versus performance. Personality and Individual Differences, 24(5):595–
601, 1998.
[14] Thitivatr PatanasakPinyo.Flattening methods for adaptive location-based software to user abilities.
Graduate Theses and Dissertations, Iowa State University, 2017.
[15] Thitivatr PatanasakPinyo, Georgi Batinov, Kofi Whitney, and Les Miller. Methods that flatten
the user space for individual differences in location-based surveys on portable devices. In 31st
International Conference on Computers and Their Applications (CATA 2016), pages 65–70, Las Vegas, Nevada, 2016. International Society for Computers and their Applications (ISCA). [16] Thitivatr PatanasakPinyo, Georgi Batinov, Kofi Whitney, Adel Sulaiman, and Les Miller.
Object-indexing: A solution to grant accessibility to a traditional raster map in location-based application
Electronics Engineering and Technology (ICEEET 2018), pages 126–131, Kyoto, Japan, 2018. International Centre of Excellence in Engineering and Technology (ICEEAT).
[17] Thitivatr PatanasakPinyo, Georgi Batinov, Kofi Whitney, Adel Sulaiman, Les Miller, and Stephen
Gilbert. Extracting useful features for users with different levels of spatial visualization. In33rd
International Conference on Computers and Their Applications (CATA 2018), pages 86–91, Las Vegas, Nevada, 2018. International Society for Computers and their Applications (ISCA). [18] Martin Raubal and Stephan Winter. Enriching wayfinding instructions with local landmarks. In
International Conference on Geographic Information Science, pages 243–259. Springer, 2002. [19] Timothy A Salthouse, Renee L Babcock, Debora RD Mitchell, Roni Palmon, and Eric Skovronek.
Sources of individual differences in spatial visualization ability. Intelligence, 14(2):187–230, 1990.
[20] Alfred Taylor Sr, Les Miller, Sree Nilakanta, Jeffry Sander, Saayan Mitra, Anurag Sharda, and Bachar Chama. Using an error detection strategy for improving web accessibility for older adults. InAdvances in Computer-Human Interactions, 2009. ACHI’09. Second International Conferences
on, pages 375–380. IEEE, 2009.
[21] Michael Tlauka and Paul N Wilson. The effect of landmarks on route-learning in a