Medical Journal of the Islamic Republic of Iran (MJIRI)
Med J Islam Repub Iran. 2019(30 Nov);33.128. https://doi.org/10.34171/mjiri.33.128
The effect of eight-week walking program on plasma levels
of amino acids in early/mid pubertal obese girls
Masoumeh Baghersalimi1, Rozita Fathi*1, Sohrab Kazemi2
Received: 6 Dec 2018 Published: 30 Nov 2019
Abstract
Background: Altered circulating amino acids levels have been observed in metabolic disorders, like obesity, type-2 diabetes, and other insulin-resistant states. This study aimed to investigate the effect of 8-week walking on plasma amino acids (PAAs) in obese girls. Methods: This clinical trial study (IRCT20180928041160N1) was conducted on 32 early/mid pubertal obese girls which they divided into interval-walking (IWG, n=12), continuous-walking (CWG, n=11) and control (CG, n=9) groups. The walking program (3-sessions/week for 8-weeks) consists of 30-min walking with 70-85%HRmax and 60-75%HRmax, respectively in the IWG (2-min walking and 1-min active rest) and CWG. The concentration of PAAs was measured at baseline and 72-hours after the last session in fasting state, using high-performance liquid chromatography. A repeated measures ANCOVA (group (3) * time (2)) with post hoc Bonferroni was used to analyze the data.
Results: More the PAAs were not affected by interval or continuous walking training. A significant increase in lysine (p=0.003, 95%CI 24.08, 108.97) was observed only in the CG, and there was a significant difference between the CG and CWG (p=0.032). Global arginine bioavailability (GABA) significantly decreased in the CG (P<0.001, 95%CI -0.65, -0.21) and the IWG (p=0.004, 95%CI -0.60, -0.21). A significant increase in weight (p=0.043, 95%CI 0.27, 1.46), insulin (p=0.046, 95%CI -0.91, 9.01), and HOMA-IR (p=0.007, 95%CI 0.26, 2.63) were found only in the CG, and both insulin and HOMA-IR tended to decline in the CWG.
Conclusion: Except for lysine and GABA, all groups roughly showed similar changes in more amino acids. Continuous-walking could improve the plasma level of lysine and GABA, which along with an improvement of fasting insulin levels and HOMA-IR.
Keywords: Obesity, Child, Puberty, Walking, Amino acids
Conflicts of Interest: None declared
Funding: University of Mazandaran
*This work has been published underCC BY-NC-SA 1.0 license.
Copyright© Iran University of Medical Sciences
Cite this article as:Baghersalimi M, Fathi R, Kazemi S. The effect of eight-week walking program on plasma levels of amino acids in early/mid pubertal obese girls. Med J Islam Repub Iran. 2019 (30 Nov);33:128. https://doi.org/10.34171/mjiri.33.128
Introduction
Today, childhood obesity has become a global public health crisis, and many developed and developing countries are struggling with this problem. Early-onset obesity in childhood is associated with an increased risk of obesity and increased obesity-related disorders such as insulin
resistance (IR) and type-2 diabetes (T2D) in adulthood (1). In normal-weight children, a transient decrease in insulin sensitivity happens during puberty because of high circu-lating levels of growth hormone (2). Nevertheless, obese children are more prone to insulin resistance than normal-______________________________
Corresponding author: Dr Rozita Fathi, [email protected]
1.Department of Exercise Physiology, Faculty of Sport Sciences, University of
Mazandaran, Babolsar, Iran
2.Cellular and Molecular Biology Research Center, Health Research Institute, Babol
University of Medical Sciences, Babol, Iran
↑What is “already known” in this topic:
The present study is the first study to investigate the effect of exercise-only on plasma amino acids profile in obese children, especially in early/mid pubertal obese girls.
→What this article adds:
More amino acids, especially the branched-chain and aromatic amino acids, were not affected by both continuous and interval walking and the improvement of insulin and HOMA-IR levels as a result of continuous walking occurred independently of changes in these amino acids. However, the levels of lysine were improved by continuous walking that correlated with glucose changes, and this would open up a future research field to examine the role of lysine in glucose homeostasis.
Effect of walking on plasma amino acids
weight children, and several studies demonstrated that in-sulin sensitivity (IS) does not recover in obese children at the end of puberty (2-4), which may have a negative effect on the function of beta cells (4).
Recently, metabolomics has provided insights into the mechanisms underlying the development of insulin re-sistance (5). Measurement of small-molecule metabolites, such as amino acids, leads to the identification of mecha-nisms and biomarkers of many diseases. Recently, the role of plasma free amino acids (PAAs) in insulin resistance pathophysiology has been considered. Several studies demonstrated that PAAs profiles change in unfavorable conditions such as visceral fat accumulation and insulin re-sistance (6-8). Wang and his colleagues showed that 12 years before the onset of diabetes, fasting plasma levels of three branched-chain amino acids (BCAAs; valine, leucine, and isoleucine) and two aromatic amino acids (AAAs; ty-rosine and phenylalanine) were elevated (9) .In fact, in-creasing levels of these amino acids occur before any changes in insulin action, suggesting these metabolites as biomarkers to predict the future development of diabetes, is superior to fasting levels of glucose and body mass index (BMI) (9). BCAAs and AAAs (tyrosine, tryptophan, and phenylalanine) levels are elevated in obese subjects and as-sociated with the risk of IR, and T2D (7, 10, 11). BCAAs dysmetabolism could lead to accumulation of toxic metab-olites that can result in mitochondrial dysfunction in pan-creatic islet beta cells, which are associated with IR and T2D (12). Increased BCAAs can activate the signaling pathway of mTORC1, S6 kinase, and phosphorylation of the subtype of insulin receptor-1, leading to IR and T2D (10). In addition to BCAAs and AAAs, other amino acids such as glutamate, serine, glycine, alanine, histidine, lysine, ornithine (7), methionine, proline, and glutamine (7, 13) also change in subjects with high visceral adiposity. The changes in the PAAs may be due to a combination of en-hanced protein degradation due to IR in the muscle and changes in the regulatory point of liver gluconeogenesis (14).
To prevent lifestyle-related diseases such as obesity, T2D, and other insulin-resistant modes, early diagnosis, and effective intervention is very important. Physical activ-ity and exercise are at the forefront of preventive and ther-apeutic strategy for obesity, which is a low-cost and non-pharmacologic intervention (15). Aerobic training (for 30-minutes or more, 3-times per week or more, for 8-weeks or more) improves IS and other glycemic control markers, and regular aerobic exercise can be useful for improving IR in overweight and obese children without weight loss or ca-loric restriction (16, 17). There is little known about the ef-fectiveness of exercise interventions without diet restriction on PAAs profile, especially in the early/mid-puberty. A number of studies have shown that weight loss due to sur-gery (18) or diet and exercise interventions (14, 19) can im-prove the PAAs. In overweight and insulin-resistant adults, six months of combined exercise (aerobic and resistance) resulted in effective elimination of acyl groups derived from AAAs and BCAAs through the formation of glycine conjugates in the liver without significantly changing in cir-culating levels of AAAs and BCAAs (20).
We assumed that an 8-week aerobic training period would improve the anthropometric and glycemic parame-ters, and these changes would be associated with the im-provement of PAAs. Forasmuch as T2D often appears in the mid-stages of puberty and affects girls more than boys (21) and walking, a type of aerobic exercises can help to improve abdominal obesity and IR markers in obese fe-males and be considered as an effective and safe lifestyle strategy (22). Therefore, we conducted this study to inves-tigate the effect of the eight-week interval and continuous-walking on in early/mid pubertal obese girls.
Methods
Subjects
Thirty-two obese girls aged 9-11 years-old took part in the present research. Based on the recommendations of the International Obesity Task Force (IOTF) obesity was de-fined in the participants. All the girls had not experienced menarche and were checked to be within Tanner's stages of 2-3. Breast budding and pubic hair growth in the girls were done using the visual inspection method of Marshall and Tanner (23). The health of these girls was checked by an experienced physician, and none of them had a history of cardiovascular disease, asthma, diabetes, etc., and they did not have any kind of injuries or physical problems. After a complete description of how the research was carried out, written consent was received from their parents. In this study, the inclusion criteria were as follows: age range be-tween 9-11 years old; BMI ≥22.81, BMI ≥24.11, BMI ≥25.42 for ages 9, 10 and 11 year old respectively; Tanner's stages of 2-3; absence of diabetes mellitus; no history of neuromuscular, orthopedic, cardiovascular and respiratory diseases; not under any anti-fat, weight loss, and cortico-steroid drugs; lack of regular physical activity during the previous 6 months. Exclusion criteria were participants’ unwillingness to continue the study; the incidence of dis-eases during the study and drug use; orthopedic problems that prevented participation in a walking program and ir-regular participation in training sessions, also, absence in exercises (consecutive or intermittent) for more than 3 sions in the training groups; participation in exercise ses-sions more than twice a week in the control group.
To calculate the sample size, data from previous studies in overweight/obese youth were used. According to these studies, maximal effect size resulting from lifestyle inter-ventions for the HOMA-IR was 2.4, and standard deviation range for the HOMA-IR was 1.8 to 2.5 (24, 25).
Thus, the sample size was calculated based on HOMA-IR by considering an alpha of 0.05, a power of 80%, a standard deviation of 1.8, and an effect size of 2.4 using the
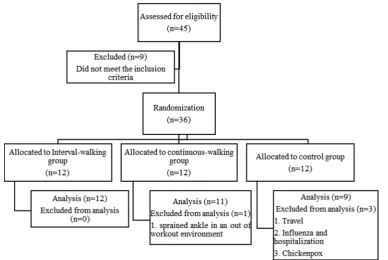
formula "n=2 (Zα + Z [1-β])2 × SD2/d2" (n≈9). We enrolled
12 subjects per the groups to compensate for potential dropouts. After giving random numbers to the subjects, they were randomly divided into three groups (interval-walking (IWG), continuous-(interval-walking (CWG) and control (CG) groups) using Random Allocation Software. At base-line, 12 subjects were divided into each group, but some of them were excluded from this study, and eventually 12, 11 and 9 subjects remained in the IWG, CWG and CG groups,
respectively (Fig. 1). This randomized clinical trial was ap-proved by the ethics committee of the University of Ma-zandaran (IR.UMZ.REC.1397.015) and was registered in
the Iranian Registry of Clinical Trials (IRCT
20180928041160N1).
The exercise protocol
Both continuous and interval-walking training was per-formed for eight weeks and three sessions per week. Each training session included 10-minutes of the warm-up (slow running and stretching), walking (15-25 minutes walking in sessions of 1-6 and 30 minutes walking in sessions of 7-24) and 5-minutes of cool-down (stretching). In the CWG, the subjects walked in the first four weeks with 60-75% maxi-mum heart rate (HRmax) and with 70-75% HRmax in the other four weeks. In the IWG, the subjects walked the for first four weeks with 75-80% HRmax and with 80-85% HRmax in the other four weeks. The interval-walking in-cluded a 2-minute walking (the first four weeks with 75-80% HRmax and with 80-85% HRmax in the other four weeks) and the 1-minute active rest (walking with 50-60% HRmax). To calculate the maximum heart rate of the sub-jects, the Tanaka et al. (26) formula "208 – (0.7×age)" was used. The heart rate was controlled by a polar (AXN500, Finland). The CG subjects were not included in any training program.
Outcome measurement
Glycemic parameters: Blood sampling was done at 8
o'clock in two phases, before exercise and 72 hours after the last exercise session on the night fasting state. The 5 cc of blood samples were taken from the brachial vein in the sitting position and then centrifuged at 3000 rpm for 10
minutes. Aliquots of plasma were stored at −80 °C until re-quired. Insulin levels were determined by an electrochemi-cal luminescence immunoassay (Cobas e 411, Hitachi, To-kyo, Japan). The quantitative estimation of fasting plasma glucose was done by the glucose oxidase method using en-zymatic kit GOD-POD, glucose oxidase-peroxidase (Bi-onik Company, Tehran, Iran). IR was evaluated using the homeostatic model assessment (HOMA). HOMA-IR was calculated according to the formula: fasting insulin (μUI/mL) × fasting glucose (mg/dL)/405 (27).
Plasma amino acids profile:The plasma concentrations
of amino acids were measured usinghigh-performance
liq-uid chromatography (HPLC) (28-30). Briefly, 25 μL of plasma was mixed for a few seconds with 250 μL of inter-nal standard (norvaline with the concentration of 50 μM/L). Then, 350 μL of methanol was added to it and vortexed for 30 seconds. The mixture centrifuged for 6 minutes at 10,000 rpm. 200 μl of the supernatant was added to 200 μl of the derivative solution (ortho-phthalaldehyde/2-mercap-toethanol) and vortexed for 30 seconds. The mixed solution was maintained for 30 minutes. Then, 10 μl of it was in-jected into the HPLC system. HPLC system (Agilent 1200 infinity) was equipped with a fluorescence detector (exci-tation wavelength of 340 nm with detection at 450 nm); col-umn, Inertsil (5 μm, 25 x 4.6 mm); column temperature, 37
◦C; run length, 45 min. Mobile phase A was 0.1 M Sodium
acetate, adjusted to pH 6.96 with glacial acetic acid, tetra-hydrofuran, and methanol (65/5/30 v/v/v) while mobile phase B was methanol.
Anthropometric parameters: Height and weight of the participants were measured with light clothing and without shoes using a stadiometer and a calibrated scale (recorded to the nearest 0.001 meters and 0.1 kilograms). BMI was calculated by divided weight (in kilogram) by height
Fig. 1.Flow chart
Effect of walking on plasma amino acids
squared (in meter). Waist circumference was measured in the narrowest waist region with a non-elastic measuring tape. To calculate the waist to height ratio (WtHR), waist circumference (in centimeter) was divided by height (in centimeter). Also, body fat percentage (BFP) was calcu-lated using the Jackson-Pollock 3-spot (suprailiac, triceps, and abdominal skinfold thickness) formula (31). The skin-fold thickness was measured twice using the Harpenden Caliper.
BFP= (0.41563 × ∑3-spot) – (0.00112 × (∑3-spot)2) +
(0.03661 × age) + 4.03653 (31)
Statistical analysis
The normality assumption was assessed using the Shapiro-Wilk test. Baseline differences were determined by one-way analysis of variance (ANOVA). To evaluate interaction and time effects, a repeated measures AN-COVA (group (3) * time (2)) with post hoc Bonferroni was used. Glucose level in baseline was used as a covariate in the ANCOVA, as this parameter was significantly different at baseline between the groups. If any group by time effect was detected a Test of Simple Effects was used. This test performed with SPSS general Linear model, using the esti-mated marginal means option via SPSS command syntax.
The effect size was interpreted as follows: small effect (η2:
0.01–0.058, Cohen’s d: 0.2-0.49), medium effect (η2:
0.059–0.137, Cohen’s d: 0.5-0.79), and large effect
(η2>0.138, Cohen’s d>0.8) (32). The correlation between
variables was evaluated using the Pearson correlation coef-ficient. Statistical analysis was performed with SPSS soft-ware (version 25). The level of statistical significance was set at p<0.05. All data are reported as the mean and standard deviation.
Results
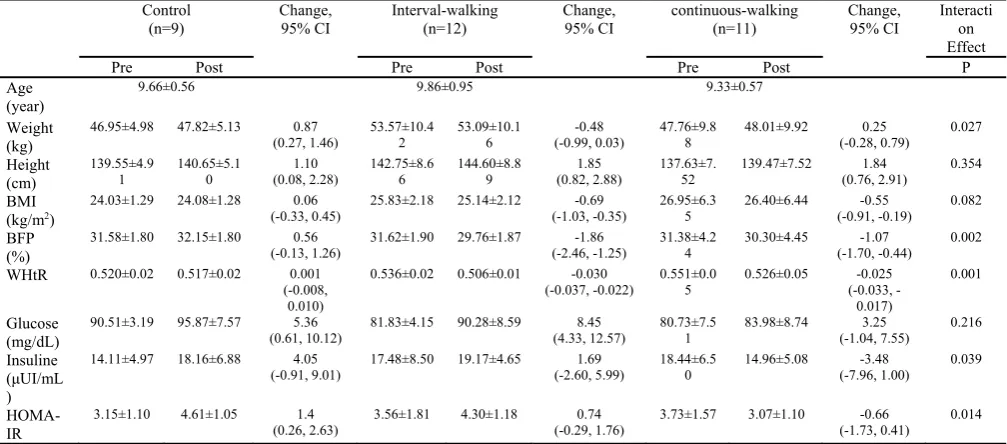
The changes in anthropometric and metabolic variables
after 2-month walking interventions are shown in Table 1.
Using a repeated measures ANCOVA (group (3) * time (2)) revealed significant group by time effect for weight
(F=4.126, p=0.027, η2= 0.228), BFP (F=8.199, p=0.002,
η2=0.369), WHtR (F=8.310, p=0.001, η2=0.372), insulin
(F=3.654, P=0.039, η2=0.207), and HOMA-IR (F=5.028,
p=0.014, η2=0.264). The simple effects test revealed a
sig-nificant increase of weight (p=0.043, Cohen’s d=-0.17), in-sulin (p=0.046, Cohen’s d=-0.67), and HOMA-IR (p=0.007, Cohen’s d=-1.36) only in the CG and observed a significant decrease of BFP (p<0.001, Cohen’s d=0.99; p=0.006, Cohen’s d=0.25), WHtR (p<0.001, Cohen’s d=1.89; p<0.001, Cohen’s d=0.50) in IWG and CWG re-spectively, without significant differences between the
groups in the pre- and post-test (Fig. 2). The interaction
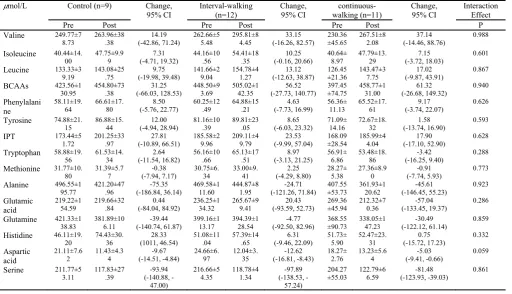
ef-fects of height and BMI were not significant (p>0.05). The changes of PAAs after 2-month walking
interven-tions are shown in Table 2. The pattern of changes in more
PAAs was roughly similar in the three groups. No signifi-cant group by time effect was observed for more PAAs
ex-cept lysine (F=3.588, p=0.041, η2=0.204) and the global
ar-ginine bioavailability (GABA) (arar-ginine/citrulline +
orni-thine) (F=3.323, p=0.050, η2=0.186). The simple effects
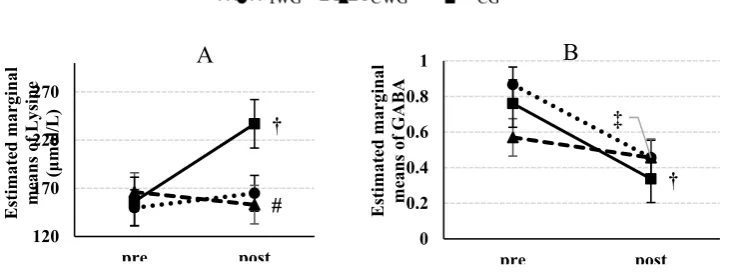
test revealed a significant increase of lysine (p=0.003, Co-hen’s d=-1.12) only in the CG and a significant decrease of GABA in the CG (p<0.001, Cohen’s d=3.89) and the IWG
(P=0.004, Cohen’s d=2.48) (Fig. 3). Pairwise comparisons
by Bonferroni for lysine at pre- and post-test revealed a sig-nificant difference between the CG and CWG (p=0.032) at post-test. Time and group main effects were not observed for any of the PAAs (p>0.05).
After adjusting for the change in WHtR and BFP, the time and group main effects on lysine concentration lost statistical significance (p=0.114, p=0.107 receptively), but it remained statistically significant after adjusting for the change in body weight, Insulin, and HOMA-IR (p=0.041, p=0.027, p=0.011 receptively). Also, after adjusting for the change in body weight, WHtR, BFP, Insulin, and
HOMA-Table 1. Anthropometric and metabolic variables at baseline and post walking interventions in early/mid pubertal obese girls Control
(n=9)
Change, 95% CI
Interval-walking (n=12)
Change, 95% CI
continuous-walking (n=11)
Change, 95% CI
Interacti on Effect
Pre Post Pre Post Pre Post P
Age (year)
9.66±0.56 9.86±0.95 9.33±0.57
Weight (kg)
46.95±4.98 47.82±5.13 0.87
(0.27, 1.46)
53.57±10.4 2
53.09±10.1 6
-0.48 (-0.99, 0.03)
47.76±9.8 8
48.01±9.92 0.25
(-0.28, 0.79)
0.027
Height (cm)
139.55±4.9
1 140.65±5.10 (0.08, 2.28) 1.10 142.75±8.66 144.60±8.89 (0.82, 2.88) 1.85 137.63±7.52 139.47±7.52 (0.76, 2.91) 1.84 0.354
BMI (kg/m2)
24.03±1.29 24.08±1.28 0.06
(-0.33, 0.45) 25.83±2.18 25.14±2.12 (-1.03, -0.35) -0.69 26.95±6.35 26.40±6.44 (-0.91, -0.19) -0.55 0.082
BFP (%)
31.58±1.80 32.15±1.80 0.56
(-0.13, 1.26) 31.62±1.90 29.76±1.87 (-2.46, -1.25) -1.86 31.38±4.24 30.30±4.45 (-1.70, -0.44) -1.07 0.002
WHtR 0.520±0.02 0.517±0.02 0.001 (-0.008,
0.010)
0.536±0.02 0.506±0.01 -0.030
(-0.037, -0.022) 0.551±0.05 0.526±0.05 (-0.033, --0.025 0.017)
0.001
Glucose (mg/dL)
90.51±3.19 95.87±7.57 5.36
(0.61, 10.12) 81.83±4.15 90.28±8.59 (4.33, 12.57) 8.45 80.73±7.51 83.98±8.74 (-1.04, 7.55) 3.25 0.216
Insuline (μUI/mL )
14.11±4.97 18.16±6.88 4.05
(-0.91, 9.01) 17.48±8.50 19.17±4.65 (-2.60, 5.99) 1.69 18.44±6.50 14.96±5.08 (-7.96, 1.00) -3.48 0.039
HOMA-IR
3.15±1.10 4.61±1.05 1.4
(0.26, 2.63) 3.56±1.81 4.30±1.18 (-0.29, 1.76) 0.74 3.73±1.57 3.07±1.10 (-1.73, 0.41) -0.66 0.014
Abbreviations: BMI, body mass index; BFP, body fat percentage; WHtR, waist to height ratio; HOMA-IR, homeostatic model assessment for insulin-resistance. Data were statistically evaluated by repeated measures ANCOVA (covariate baseline level of glucose) post hoc Bonferroni
IR, the time and group main effects on GABA attenuated or remained statistically significant (p=0.053, p=0.092, p=0.044, p=0.047, p=0.033 receptively).
The results of Pearson’s correlation coefficients showed that, at baseline, none of the PAAs were significantly cor-related with weight and BMI (p>0.05). The levels of tryp-tophan, methionine, and GABA were negatively correlated with BFP (r=-0.352, p=0.048; r=-0.359, p=0.044; r=-0.355,
p=0.046; respectively). In addition, the levels of isoleucine, leucine, valine, sum of BCAAs, methionine, tryptophan, and sum of isoleucine, phenylalanine, and tyrosine signifi-cantly correlated with WHtR (r=-0.417, p=0.018; r=-0.447, p=0.010; r=-0.450, p=0.010; r=-0.476, p=0.006; r=-0.486, p=0.005; r=-0.450, p=0.010; r=-0.350, p=0.049; respec-tively). The levels of asparagine, serine, glutamine, glycine,
Fig. 2.Estimated marginal means (± standard error) of weight (A), BFP (B), WHtR (C), Insulin (D), and HOMA-IR (E) at pre- and post-test. * = P<0.05: versus pre-test; † = P<0.01: versus pre-test, ‡ = P<0.001: versus pre-test. Abbreviations: BFP, body fat percentage; WHtR, waist to height ratio; HOMA-IR, homeostatic model assessment for insulin-resistance.
Table 2.Plasma free amino acid profiles at baseline and post walking interventions in early/mid pubertal obese girls
μmol/L Control (n=9) Change, 95% CI
Interval-walking (n=12)
Change, 95% CI
continuous-walking (n=11)
Change, 95% CI
Interaction Effect
Pre Post Pre Post Pre Post P
Valine 249.77±7
8.73 263.96±38.38 (-42.86, 71.24) 14.19 262.66±55.48 295.81±84.45 (-16.26, 82.57) 33.15 230.36±45.65 267.51±82.08 (-14.46, 88.76) 37.14 0.988
Isoleucine 40.44±14.
00 47.75±9.99 (-4.71, 19.32) 7.31 44.16±10.56 54.41±18.35 (-0.16, 20.66) 10.25 40.64±8.97 47.79±13.29 (-3.72, 18.03) 7.15 0.601
Leucine 133.33±3
9.19 143.08±25.75 (-19.98, 39.48) 9.75 141.66±29.04 154.78±41.27 (-12.63, 38.87) 13.12 126.45±21.36 143.47±37.75 (-9.87, 43.91) 17.02 0.867
BCAAs 423.56±1
30.95 454.80±73.38 (-66.03, 128.53) 31.25 448.50±93.69 505.02±142.35 (-27.73, 140.77) 56.52 397.45±74.75 458.77±131.00 (-26.68, 149.32) 61.32 0.940
Phenylalani ne
58.11±19.
64 66.61±17.80 (-5.76, 22.77) 8.50 60.25±12.49 64.88±15.21 (-7.73, 16.99) 4.63 56.36±11.13 65.52±17.61 (-3.74, 22.07) 9.17 0.626
Tyrosine 74.88±21.
15 86.88±15.44 (-4.94, 28.94) 12.00 81.16±10.39 89.81±23.05 (-6.03, 23.32) 8.65 71.09±14.16 72.67±18.32 (-13.74, 16.90) 1.58 0.593
IPT 173.44±5
1.72 201.25±33.97 (-10.89, 66.51) 27.81 185.58±29.96 209.11±49.79 (-9.99, 57.04) 23.53 168.09±28.54 185.99±44.04 (-17.10, 52.90) 17.90 0.628
Tryptophan 58.88±19.
56 61.53±14.34 (-11.54, 16.82)2.64 56.16±10.66 65.13±17.51 (-3.13, 21.25) 8.97 56.91±6.86 53.48±18.86 (-16.25, 9.40) -3.42 0.288
Methionine 31.77±10.
80 31.39±5.77 (-7.94, 7.17) -0.38 30.75±6.34 33.00±9.41 (-4.29, 8.80) 2.25 28.27±5.38 27.36±8.90 (-7.74, 5.93) -0.91 0.773
Alanine 496.55±1
95.77 421.20±47.96 (-186.84, 36.14) -75.35 469.58±111.60 444.87±81.95 (-121.26, 71.84) -24.71 ±53.73 407.55 361.93±120.62 (-146.45, 55.23) -45.61 0.923
Glutamic acid
219.22±1 54.59
219.66±32 .84
0.44 (-84.04, 84.92)
236.25±1 34.32
265.67±9 9.41
20.43 (-93.59, 52.73)
269.36 ±45.94
212.32±7 0.36
-57.04 (-133.45, 19.37)
0.286
Glutamine 421.33±1
38.83 381.89±106.11 (-140.74, 61.87) -39.44 399.16±113.17 394.39±128.54 (-92.50, 82.96) -4.77 ±90.73 368.55 338.05±147.23 (-122.12, 61.14) -30.49 0.859
Histidine 46.11±19.
20 74.43±30.36 (1011, 46.54) 28.33 51.08±11.04 57.39±14.65 (-9.46, 22.09) 6.31 51.73±5.90 52.47±23.31 (-15.72, 17.23) 0.75 0.332
Aspartic acid
21.11±7.6
2 11.43±4.34 (-14.51, -4.84) -9.67 24.66±6.97 12.04±3.35 (-16.81, -8.43) -12.62 18.27±2.76 13.23±5.64 (-9.41, -0.66) -5.03 0.059
Serine 211.77±5
3.11 117.83±27.39 (-140.88, --93.94 47.00)
216.66±5
4.35 118.78±41.34 (-138.53, --97.89 57.24)
204.27
±55.03 122.79±66.59 (-123.93, -39.03) -81.48 0.861
Effect of walking on plasma amino acids
citrulline, alanine, methionine, leucine, and isoleucine sig-nificantly correlated with insulin and HOMA-IR (For insu-lin, respectively, 0.436, p=0.013; 0.521, p=0.002; 0.431, p=0.014; 0.404, p=0.022; 0.495, p=0.004; 0.461, p=0.008; 0.494, p=0.004; 0.395, p=0.025; r=-0.379, p=0.033; for HOMA-IR, respectively, r=-0.412, p=0.019; r=-0.506, p=0.003; r=-0.341, p=0.027; r=-0.352, p=0.048; r=-0.449, p=0.010; r=-0.443, p=0.011; r=-0.474, p=0.006; r=-0.386, p=0.029; r=-0.372, p=0.036). Also, the sum of BCAAs was negatively correlated with HOMA-IR (r=-0.351, p=0.049). Only the plasma levels of lysine showed a significant correlation with glucose (r=0.510, P=0.003). The changes in serum levels of serine, aspara-gine, and arginine were associated with the changes in in-sulin levels (0.388, p=0.028; 0.373, p=0.035; r=-0.415, p=0.018; respectively) and HOMA-IR (r=-0.387, P=0.028; r=-0.380, p=0.032; r=-0.390, p=0.021; respec-tively). Also, the changes of lysine and histidine levels were associated with the changes in glucose levels (r=0.657, p=0.020; r=0.536, p=0.002 respectively). Only the changes in levels of lysine significantly correlated with WHtR changes (r=0.356, p=0.046). The changes of other amino acids did not have any significant correlation with the changes in other variables (p>0.05).
Discussion
The purpose of this study was to evaluate the changes in the PAAs after two-month of walking interventions in early/mid pubertal obese girls. More the PAAs were not af-fected by interval or continuous walking training. We ob-served that lysine levels significantly increased in the CG and continuous-walking could prevent the increase of it. Also, GABA significantly decreased in the CG and IWG, however no significant changes were observed in the CWG.
The pattern of changes in more PAAs in the three groups was somewhat similar, indicating that the walking interven-tions did not alter the mean of more PAAs. In our study, there was no significant decrease in subjects' weight after eight weeks of walking interventions. However, those stud-ies that reported significant changes in PAAs have been sig-nificant weight loss (14, 18-20). In line, Reinehr et al. (19) demonstrated that BMI-standard deviation score reduction > 0.5 in children can cause significant changes in levels of PAAs due to dietary and exercise habits. In addition, Tochikubo et al. showed that weight loss more than 3% in-duced by a 3-month diet and exercise intervention normal-ized PAAs and high weight loss was associated with im-proved levels of triglycerides and hemoglobin A1c (14). In a study done by Glyn et al. (20) on insulin-resistant people, 6 months of combined exercise (aerobic and resistance) re-sulted in a significant weight loss of ~1% and a significant
Table 2.Ctd
μmol/L Control (n=9) Change, 95% CI
Interval-walking (n=12)
Change, 95% CI
continuous-walking (n=11)
Change, 95% CI
Interaction Effect
Pre Post Pre Post Pre Post P
Glycine 310.44±1
05.75 215.61±67.46 (-161.46, --94.83 28.19)
293.83±9
5.59 230.39±58.22 (-121.15, -5.74) -63.44 ±79.13 261.82 180.77±59.49 (-141.31, -20.77) -81.04 0.853
Asparagine 40.44±11.
89 42.85±14.52 (-7.80, 12.62) 2.41 40.41±10.42 40.99±12.58 (-8.26, 9.43) 0.58 33.91±10.18 37.32±14.51 (-5.82, 12.65) 3.42 0.873
Lysine 163.11±4
2.84 229.63±72.22 (24.08, 108.97) 66.53 147.75±17.74 167.09±53.61 (-17.41, 56.11) 19.35 ±39.73 162.91 156.48±32.97 (-44.82, 31.97) -6.43 0.041
Threonine 137.88±3
4.90 131.01±20.33 (-46.59, 32.85) -6.87 177.58±37.87 158.96±48.18 (-53.01, 15.78) -18.62 ±45.65 159.45 123.94±45.28 (-71.44, 0.42) -35.51 0.396
Arginine 81.77±38.
60 40.68±14.78 (-62.87, -19.31) -41.09 79.41±21.66 55.59±22.70 (-42.69, -4.96) -23.82 66.09±28.14 48.46±17.31 (-37.33, 2.08) -17.63 0.641
Citrulline 41.00±16.
17 34.48±6.54 (-8.35, 21.37) -6.51 40.66±13.30 47.52±24.02 (-6.01, 19.72) 6.86 38.64±11.54 42.34±20.69 (-9.73, 17.15) 3.71 0.850
Ornithine 66.33±28.
73 86.65±15.27 (-5.54, 46.19)20.32 61.67±25.96 78.37±17.55 (-5.70, 39.11) 16.70 52.09±36.15 75.71±28.69 (-29.77, 17.02)-6.37 0.169
GABA 0.77±0.12 0.34±0.10 -0.43
(-0.65, -0.21) 0.86±0.12 0.45±0.20 (-0.60, -0.21)-0.41 0.56±0.17 0.45±0.19 (-0.31, 0.09)-0.11 0.050
Abbreviations: BCAAs, sum of branched-chain amino acids; GABA, global arginine bioavailability; IPT, sum of isoleucine, phenylalanine, and tyrosine Data were statistically evaluated by repeated measures ANCOVA (covariate baseline level of glucose) post hoc Bonferroni.
Fig. 3.Estimated marginal means (± standard error) of Lysine (A), GABA (B) at pre- and post-test. # = P<0.05: versus control group in post-test; † = P<0.01: versus pre-test, ‡ = P<0.001: versus pre-test. Abbreviations: GABA, global arginine bioavailability.
# †
120 170 220 270
pre post
Estimated marginal means of Ly
sine
(μ
mol/L)
A
‡
†
0 0.2 0.4 0.6 0.8 1
pre post
Estimated marginal means of GABA
B
reduction in IR by ~27%. These researchers did not find any significant change in most of amino acids except for glycine and citrulline. Although the PAAs, especially the BCAAs, did not alter with walking interventions, we found that insulin and HOMA-IR levels increased significantly in the CG, while the walking groups did not show significant changes, especially in the CWG which tended to decline in both insulin and HOMA-IR. Lee et al. (33) demonstrated that the exercise intervention increased IS by 29%, lowered liver fat by 25% and increased BCAA catabolism in liver, skeletal muscle, and adipose tissue, whereas no significant change was observed in plasma level of BCAAs and changes did not correlate to changes in IS. They suggested that elevated plasma level of BCAAs may not play a direct role causing IR (33).
We observed that lysine levels in the CG were signifi-cantly increased, while the levels in the CWG tended to de-crease. Lysine is an essential amino acid, but a significant contribution of microbial-derived lysine to the free plasma lysine and the body protein pools were observed in humans (34). In addition, gut microbiota composition of obese hu-mans is significantly different from normal-weight individ-uals (35). In a study of children, it was shown that changes in the gut microbiota composition preceded weight changes (36). Interesting, exercise can induce modifications in the gut microbiota composition (37). One of the limitations of this study is the lack of control of the subjects' diet and the evaluation of gut microbiota, and there is the ambiguity that the walking protocols in this study have affected the gut microbiota composition. Furthermore, neutrophils are also one of the secretive sources of arginine, ornithine, lysine, hydroxylysine, histidine (38). Galkina et al. (38) found that insulin significantly stimulated the amount of secreted hy-droxylysine, a metabolite of lysine, in neutrophils. In addi-tion, it has been reported that plasma concentrations of ly-sine positively associated with gestational diabetes mellitus through modifying IR and secretion (39). We also observed that increase of lysine in the CG and the reduction of lysine in the CWG was along with an increase and tended to de-crease in insulin and HOMA-IR, respectively. However ly-sine changes only had a significant correlation with glucose and WHtR changes.
Moreover, we found that GABA (arginine/citrulline + or-nithine) significantly increased in the CG, and the continu-ous-walking could somewhat prevent the further reduction of GABA. In patients with diabetes or cardiovascular dis-ease, the reduction of GABA commonly observed (40, 41). Galkina et al. (38) demonstrated that neutrophils secrete more ornithine than arginine, and this can contribute to the alteration of the PAAs content in patients with metabolic disorders. It is clear that there is a connection between obe-sity and neutrophils. Blood levels of neutrophils increased in obese adults (42) and youth (43), which is related to waist circumference, WHtR, and BMI in obese youth (44). In ad-dition, it has been shown that obesity inhibits plasma argi-nine concentration and GABA (45). Another limitation of this study was the lack of evaluation of neutrophils and ar-ginase. Serum levels of arginase, a key enzyme in the urea cycle, were evaluated in various diseases such as T2D (46) that involved in indirect regulation of nitric oxide by the
consumption of arginine, which is a common substrate for nitric oxide synthase. Consumption of arginine by arginase may lead to the reduction of nitric oxide, resulting in vas-cular damage (47). It has been demonstrated that arginase inhibition prevents the development of hypertension and improves IS in obese rats (48). In the present study, GABA reduction was along with increased levels of insulin and HOMA-IR, but no significant correlation was found be-tween GABA and insulin or HOMA-IR changes. However the changes in arginine had a significant correlation with changes in both insulin and HOMA-IR.
For future studies, it is recommended that subjects' diet monitored. In addition, the role of gut microbiota composi-tion and neutrophil circulacomposi-tion levels in altering the plasma profile of amino acids should be considered and evaluated. These may help to understand the mechanisms involved in improving exercise-induced glucose homeostasis.
Conclusion
In summary, except for lysine and GABA, all three groups showed a roughly similar pattern in more amino ac-ids in early/mid pubertal obese girls. Only the continuous-walking could improve the plasma level of lysine and GABA, which along with improvement of fasting insulin levels and HOMA-IR. There was a correlation between changes in serum lysine levels with changes in glucose and changes in arginine level with the changes in levels of in-sulin and HOMA-IR. Future studies should be done to un-derstand the mechanisms related to exercise involved in the regulation of lysine levels and GABA.
Acknowledgments
This study is part of the Ph.D. thesis on exercise bio-chemistry and metabolism, which was approved by the de-partment of exercise physiology at Mazandaran University. The authors would like to thank all the participants and their parents.
Conflict of Interests
The authors declare that they have no competing interests.
References
1.Faienza MF, Wang DQ, Frühbeck G, Garruti G, Portincasa P. The dan-gerous link between childhood and adulthood predictors of obesity and metabolic syndrome. Intern Emerg Med. 2016;11(2):175-82. 2.Kelsey MM, Zeitler PS. Insulin resistance of puberty. Curr Diab Rep.
2016;16(7):64.
3.Pilia S, Casini MR, Foschini ML, Minerba L, Musiu MC, Marras V, et al. The effect of puberty on insulin resistance in obese children. J En-docrinol Invest. 2009;32(5):401-5.
4.Kelly LA, Lane CJ, Weigensberg MJ, Toledo-Corral CM, Goran MI. Pubertal changes of insulin sensitivity, acute insulin response, and β-cell function in overweight Latino youth. J Pediatr. 2011;158(3):442-6. 5.Newgard CB. Metabolomics and Metabolic Diseases: Where Do We
Stand? Cell Metab. 2017;25(1):43-56.
6.Würtz P, Mäkinen VP, Soininen P, Kangas AJ, Tukiainen T, Kettunen J, et al. Metabolic signatures of insulin resistance in 7,098 young adults. Diabetes. 2012;61(6):1372-80.
7.Yamakado M, Tanaka T, Nagao K, Ishizaka Y, Mitushima T, Tani M, et al. Plasma amino acid profile is associated with visceral fat accumu-lation in obese Japanese subjects. Clin Obes. 2012;2(1‐2):29-40. 8.Yamakado M, Nagao K, Imaizumi A, Tani M, Toda A, Tanaka T, et
Effect of walking on plasma amino acids
al. Plasma free amino acid profiles predict four-year risk of developing diabetes, metabolic syndrome, dyslipidemia, and hypertension in Japanese population. Sci Rep. 2015;5:11918.
9.Wang TJ, Larson MG, Vasan RS, Cheng S, Rhee EP, McCabe E, et al. Metabolite profiles and the risk of developing diabetes. Nat Med. 2011;17(4):448-53.
10.Newgard CB, An J, Bain JR, Muehlbauer MJ, Stevens RD, Lien LF, et al. A branched-chain amino acid-related metabolic signature that dif-ferentiates obese and lean humans and contributes to insulin resistance. Cell Metab. 2009;9(4):311-26.
11.Gaggini M, Carli F, Rosso C, Buzzigoli E, Marietti M, Della Latta V, et al. Altered amino acid concentrations in NAFLD: Impact of obesity and insulin resistance. Hepatology. 2018;67(1):145-58.
12.Olson KC, Chen G, Xu Y, Hajnal A, Lynch CJ. Alloisoleucine differ-entiates the branched‐chain aminoacidemia of Zucker and dietary obese rats. Obesity. 2014;22(5):1212-5.
13.Wahl S, Yu Z, Kleber M, Singmann P, Holzapfel C, He Y, et al. Childhood obesity is associated with changes in the serum metabolite profile. Obes Facts. 2012;5(5):660-70.
14.Tochikubo O, Nakamura H, Jinzu H, Nagao K, Yoshida H, Kageyama N, et al. Weight loss is associated with plasma free amino acid altera-tions in subjects with metabolic syndrome. Nutr Diabetes. 2016;6(2):e197.
15.Shen Y, Xu X, Yue K, Xu G. Effect of different exercise protocols on metabolic profiles and fatty acid metabolism in skeletal muscle in high‐
fat diet‐fed rats. Obesity. 2015;23(5):1000-6.
16.Bird SR, Hawley JA. Update on the effects of physical activity on insulin sensitivity in humans. BMJ Open Sport Exerc Med. 2017;2(1):e000143.
17.Kim Y, Park H. Does Regular Exercise without Weight Loss Reduce Insulin Resistance in Children and Adolescents? Int J Endocrinol. 2013;2013:402592.
18.Magkos F, Bradley D, Schweitzer GG, Finck BN, Eagon JC, Ilkayeva O, et al. Effect of Roux-en-Y gastric bypass and laparoscopic adjusta-ble gastric banding on branched-chain amino acid metabolism. Diabe-tes. 2013:DB_130185.
19.Reinehr T, Wolters B, Knop C, Lass N, Hellmuth C, Harder U, et al. Changes in the serum metabolite profile in obese children with weight loss. Eur J Nutr. 2015;54(2):173-81.
20.Glynn EL, Piner LW, Huffman KM, Slentz CA, Elliot-Penry L, AbouAssi H, et al. Impact of combined resistance and aerobic exercise training on branched-chain amino acid turnover, glycine metabolism and insulin sensitivity in overweight humans. Diabetologia. 2015;58(10):2324-35.
21.Jeffery SC, Hosking J, Jeffery AN, Murphy MJ, Voss LD, Wilkin TJ, et al. Insulin resistance is higher in prepubertal girls but switches to become higher in boys at age 16: A Cohort Study (EarlyBird 57). Pe-diatr Diabetes. 2018;19(2):223-30.
22.Hong HR, Jeong JO, Kong JY, Lee SH, Yang SH, Ha CD, et al. Effect of walking exercise on abdominal fat, insulin resistance and serum cy-tokines in obese women. J Exerc Nutrition Biochem. 2014;18(3):277. 23.Marshall WA, Tanner JM. Variations in pattern of pubertal changes
in girls. Arch Dis Child. 1969;44(235):291.
24.McCormack SE, McCarthy MA, Harrington SG, Farilla L, Hrovat MI, Systrom DM, et al. Effects of exercise and lifestyle modification on fitness, insulin resistance, skeletal muscle oxidative phosphorylation and intramyocellular lipid content in obese children and adolescents. Pediatr Obes. 2014;9(4):281-91.
25.Shaibi GQ, Davis JN, Weigensberg MJ, Goran MI. Improving insulin resistance in obese youth: choose your measures wisely. Int J Pediatr Obes. 2011;6(sup3):e290-6.
26.Tanaka H, Monahan KD, Seals DR. Age-predicted maximal heart rate revisited. J Am Coll Cardiol. 2001;37(1):153-6.
27.Matthews D, Hosker J, Rudenski A, Naylor B, Treacher D, Turner R. Homeostasis model assessment: insulin resistance and β-cell function from fasting plasma glucose and insulin concentrations in man. Dia-betologia. 1985;28(7):412-9.
28.Babu SVS, Shareef MM, Shetty APK, Shetty KT. HPLC method for amino acids profile in biological fluids and inborn metabolic disorders of aminoacidopathies. Indian J Clin Biochem. 2002;17(2):7-26. 29.Schwarz EL, Roberts WL, Pasquali M. Analysis of plasma amino
ac-ids by HPLC with photodiode array and fluorescence detection. Clin Chim Acta. 2005;354(1-2):83-90.
30.Terrlink T, Van Leeuwen P, Houdijk A. Plasma amino acids deter-mined by liquid chromatography within 17 minutes. Clin Chem.
1994;40(2):245-9.
31.Jackson AS, Pollock ML, Ward A. Generalized equations for predict-ing body density of women. Med Sci Sports Exerc. 1980;12(3):175-81. 32.Lakens D. Calculating and reporting effect sizes to facilitate
cumula-tive science: a practical primer for t-tests and ANOVAs. Front Psychol. 2013;4:863.
33.Lee S, Gulseth HL, Refsum H, Langleite TM, Holen T, Jensen J, et al. Branched-Chain Amino Acid (BCAA) Metabolism, Insulin Sensi-tivity (IS), and Liver Fat Response to Exercise Training in Sedentary Prediabetic and Normoglycemic Men. Am Diabetes Assoc. 2018;67:752-P.
34.Neis E, Dejong C, Rensen S. The role of microbial amino acid me-tabolism in host meme-tabolism. Nutrients. 2015;7(4):2930-46.
35.Gérard P. Gut microbiota and obesity. Cell Mol Life Sci. 2016;73(1):147-62.
36.Stanislawski MA, Dabelea D, Wagner BD, Iszatt N, Dahl C, Sontag MK, et al. Gut microbiota in the first 2 years of life and the association with body mass index at age 12 in a Norwegian birth cohort. MBio. 2018;9(5):e01751-18.
37.Clarke SF, Murphy EF, O'sullivan O, Lucey AJ, Humphreys M, Ho-gan A, et al. Exercise and associated dietary extremes impact on gut microbial diversity. Gut. 2014;63(12):1913-20.
38.Galkina SI, Fedorova NV, Ksenofontov AL, Stadnichuk VI, Baratova LA, Sud’ina GF. Neutrophils as a source of branched-chain, aromatic and positively charged free amino acids. Cell Adh Migr. 2018;1-8. 39.Park S, Park JY, Lee JH, Kim SH. Plasma levels of lysine, tyrosine,
and valine during pregnancy are independent risk factors of insulin re-sistance and gestational diabetes. Metab Syndr Relat Disord. 2015;13(2):64-70.
40.Tripolt N, Meinitzer A, Eder M, Wascher T, Pieber T, Sourij H. Mul-tifactorial risk factor intervention in patients with Type 2 diabetes im-proves arginine bioavailability ratios. Diabet Med. 2012;29(10):e365-e8.
41.Tang WW, Wang Z, Cho L, Brennan DM, Hazen SL. Diminished global arginine bioavailability and increased arginine catabolism as metabolic profile of increased cardiovascular risk. J Am Coll Cardiol. 2009;53(22):2061-7.
42.Brotfain E, Hadad N, Shapira Y, Avinoah E, Zlotnik A, Raichel L, et al. Neutrophil functions in morbidly obese subjects. Clin Exp Immunol. 2015;181(1):156-63.
43.Singer K, Lumeng CN. The initiation of metabolic inflammation in childhood obesity. J Clin Invest. 2017;127(1):65-73.
44.Nascimento H, Rocha S, Rego C, Mansilha HF, Quintanilha A, San-tos-Silva A, et al. Leukocyte Count versus C-Reactive Protein Levels in Obese Portuguese Patients Aged 6-12 Years Old. Open Biochem J. 2010;4:72-6.
45.Johnson FK, Peyton KJ, Liu Xm, Azam MA, Shebib AR, Johnson RA, et al. Arginase promotes endothelial dysfunction and hypertension in obese rats. Obesity. 2015;23(2):383-90.
46.Kövamees O, Shemyakin A, Checa A, Wheelock CE, Lundberg JO, Östenson C-G, et al. Arginase inhibition improves microvascular endo-thelial function in patients with type 2 diabetes mellitus. J Clin Endo-crinol Metab. 2016;101(11):3952-8.
47.Yang Z, Ming XF. Arginase: the emerging therapeutic target for vas-cular oxidative stress and inflammation. Front Immunol. 2013;4:149. 48.Peyton KJ, Liu XM, Shebib AR, Johnson FK, Johnson RA, Durante
W. Arginase inhibition prevents the development of hypertension and improves insulin resistance in obese rats. Amino Acids. 2018:1-8.