A R T I C L E I N F O A B S T R A C T
Article history:
Received: April 22, 2016 Accepted: June 15, 2016 Available online: September 29, 2016
Twenty-four entries okra (Abelmoschus esculentus (L.) Moench), were evaluated in randomized block design with three replications at the Experimental Farm, Vegetable Research Station, Rajendranagar, Hyderabad, Andhra Pradesh, India during summer 2013. Correlation and path coefficient analyses revealed that total number of fruits per plant and total yield per plant not only had positively significant association with marketable pod yield per plant, but also had positively high direct effect on marketable pod yield per plant and are regarded as the main determinants of marketable pod yield per plant and direct selection through these traits will be effective. The genotypic correlation coefficient of plant height, number of branches per plant, intermodal length, fruit length, fruit weight and number of marketable fruits per plant with marketable yield per plant was significantly positive, but their direct effect on marketable yield per plant was negative or negligible suggesting that the indirect casual factors are to be considered simultaneously for selection. Total number of fruits per plant and total yield per plant had strong influence on marketable pod yield per plant and are the main determiners of marketable pod yield per plant.
© 2016 Kumar and Reddy. All rights reserved. Keywords:
Character Association Character Contribution Germplasm Lines Pod Yield
Yield Components
*Corresponding Author;
E. Mail: [email protected], [email protected]
Introduction
kra (Abelmoschus esculentus (L.)
Moench) is popularly known as lady’s finger or okra belongs to the class dicotyledonae, order Malvales, family Malvaceae and genus Abelmoschus (syn.
Hibiscus) (Schippers, 2000). It is native to West Africa (Murdock, 1959). It is grown extensively in tropical, subtropical and Mediterranean climatic zones of the world (Hammon and Van Sloten, 1989). It is a multipurpose crop valued for its tender and delicious pods (Chinatu and Okocha, 2006). It is grown extensively in
tropical, subtropical and Mediterranean climatic zones of the world (Hammon and Van Sloten, 1989). It is a multipurpose crop valued for its tender and delicious pods (Chinatu and Okocha, 2006). It is a powerhouse of valuable nutrients, low in calories, fat-free and provides a valuable supplementary nutrition in human diet in developing countries where there is often a great alimentary imbalance (Kumar and Sreeparvathy, 2010). It has good medicinal value with its antispasmodic, demulcent, diaphoretic, diuretic, emollient, stimulant and vulnery properties
O
Volume 4 (2016), Issue 04, 72-83
Journal homepage: www.aaasjournal.org
ISSN: 2588-3801
Correlation and path coefficient analysis for yield and its components in okra
(
Abelmoschus esculentus
(L.) Moench)
Shashi Kumar 1* and Medagam Thirupathi Reddy 2
1College of Horticulture, APHU, Rajendranagar, Hyderabad-500030, Andhra Pradesh, India. 2 Vegetable Research Station, ARI, Rajendranagar, Hyderabad-500030, Andhra Pradesh, India.
(Mehta, 1959; Nadkarni, 1972). Its potential as an industrial crop also has been tested in the developed world (Camciuc et al., 1998). Okra has got potential to boost food, nutritional and health security, foster rural development and support sustainable land utilization (Reddy, 2010).
Okra is an important vegetable crop in India, West Africa, South-East, Asia, USA, Brazil, Australia and Turkey. It is the most important fruit vegetable crop in India. As it is a tropical, hot weather, low land crop and susceptible to low night temperatures, it is extensively cultivated in
kharif and summer seasons in India. Being an upright, quick growing and medium duration annual herb, it fits well into multiple cropping systems either as a sole crop or intercrop (Reddy, 2010). Optimizing pod yield is one of the most important goals for most okra growers and, consequently, most okra breeding programmes. For improving this crop through conventional breeding and selection, adequate knowledge of association that exists between yield and yield related characters is essential for the identification of selection procedure.
In okra, all growth, earliness and yield associated traits are quantitative in nature. Such characters are controlled by polygenes and are much influenced by environmental fluctuations. Pod yield of okra is a complex quantitative trait, which is conditioned by the interaction of various growth and physiological processes throughout the life cycle (Adeniji and Peter, 2005). Improvement of complex characters such as pod yield may be accomplished through the component approach of breeding. The development of plant breeding strategy hinges mainly on the support provided by genetic information on inheritance and behavior of major quantitative characters associated with yield and yield components (Arunachalam, 1976). A better understanding of the contribution of each trait in building up the genetic makeup of the crop may
be obtained through yield component analysis. Determination of the yield components through correlation and path coefficient analyses will improve the efficiency of a breeding programme. Plant height, number of branches per plant, internodal length, fruit length, fruit weight and number of fruits per plant were identified as the yield components in okra (Bendale et al., 2003b; Jaiprakashnarayan and Mulge, 2004; Bello et al., 2006; Mehta et al., 2006; Patro and Sankar, 2006; Singh et al., 2006; Mohapatra et al., 2007; Pal et al., 2008; Rashwan, 2011; Somashekhar et al., 2011).
per plant (Mehta et al., 2006; Patro and Sankar, 2006; Singh et al., 2006; Rashwan 2011; Somashekhar et al., 2011), internodal length (Mohapatra et al., 2007; Somashekhar et al., 2011), days to 50% flowering (Bello et al., 2006; Mehta et al., 2006; Singh et al., 2006; Rashwan 2011; Somashekhar et al., 2011), first flowering node (Jaiprakashnarayan and Mulge, 2004; Singh et al., 2006), first fruiting node (Jaiprakashnarayan and Mulge, 2004), fruit length (Bendale et al., 2003; Jaiprakashnarayan and Mulge, 2004; Mehta et al., 2006; Patro and Sankar, 2006; Singh et al., 2006; Pal et al., 2008; Somashekhar et al., 2011), fruit width (Mohapatra et al., 2007; Pal et al., 2008; Rashwan 2011; Somashekhar et al., 2011), fruit weight (Bendale et al., 2003; Jaiprakashnarayan and Mulge, 2004; Mehta et al., 2006; Patro and Sankar, 2006; Singh et al., 2006; Mohapatra et al., 2007; Pal et al., 2008; Rashwan 2011; Somashekhar et al., 2011), total number of fruits per plant (Bendale et al., 2003; Jaiprakashnarayan and Mulge, 2004; Bello et al., 2006; Singh et al., 2006; Mohapatra et al., 2007;
Pal et al., 2008; Rashwan 2011; Somashekhar et
al., 2011). Pod yield has been reported to be influenced by high direct effects of plant height (Mehta et al., 2006), number of branches per plant (Mehta et al., 2006), internodal length (Mohapatra et al., 2007), fruit length (Mehta et al., 2006; Patro and Sankar, 2006), fruit weight (Jaiprakashnarayan and Mulge, 2004; Mehta et al., 2006; Patro and Sankar, 2006), total number of fruits per plant (Jaiprakashnarayan and Mulge, 2004; Patro and Sankar, 2006; Mohapatra
et al., 2007). Plant height, number of branches per plant, internodal length, fruit length, fruit weight and number of fruits per plant were identified as potential selection criteria in breeding programmes aiming at higher yield. In this study, an attempt was made to study the interrelationship among characters and the direct and indirect effects of some important yield components on pod yield in 24 entries by
adopting correlation and path co-efficient analysis.
Materials and Methods
Experimental material comprised of 24 entries of okra including 15 F1 hybrids, six parental lines
by Singh and Chaudhary (1985) and Steel and Torrie (1980). The correlation coefficient analysis was performed according to the method suggested by Weber and Moorthy (1952). Path coefficient analysis was carried out following the methods of Singh and Chaudhary (1985) and Steel and Torrie (1980).
Result and Discussion:
Complex characteristics such as yield must be related to many individually distinguishable characteristics. It is obvious that fruit yield is a complex character that depends up on many independent yield contributing characters, which are regarded as yield components. All changes in the components need not however, be expressed by changes in yield. This is due to varying degree of positive and negative associations between yield and its components and among components themselves. Therefore, selection should be based on these component characters after assessing their association with fruit yield per plant.
Correlation Coefficient Analysis
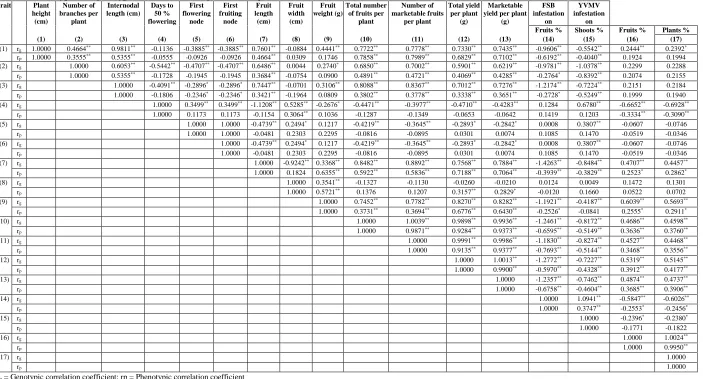
From the perusal of the estimates of phenotypic and genotypic coefficients of variation, in general, it was observed that the estimates of genotypic correlation coefficients were in most cases higher than their corresponding phenotypic correlation coefficients. Further, the genotypic correlation coefficient between different characters pairs was similar in sign and nature to the corresponding phenotypic correlation coefficient. The present findings are in consonance with the earlier findings of Akinyele and Osekita (2006), Bello et al. (2006), Mehta et al. (2006), Rashwan (2011) and Somashekhar et al. (2011). More significant genotypic association between the different pairs of characters than the phenotypic correlation means that there is strong association between those
characters genetically, but the phenotypic value is lessened by the significant interaction of environment (Table 1).
Phenotypic correlation
and marketable yield per plant. Fruit weight had significantly positive correlation with fruit length, fruit width, total number of fruits per plant, number of marketable fruits per plant, total yield per plant and marketable yield per plant, while it had significantly negative correlation with FSB infestation on fruits and shoots. Total number of fruits per plant was positively correlated with plant height, number of branches per plant, internodal length, fruit length, fruit weight, number of marketable fruits per plant, total yield per plant and marketable yield per plant and it was negatively correlated with FSB infestation on fruits and shoots. Number of marketable fruits per plant had significantly positive correlation with plant height, number of branches per plant, internodal length, fruit length, fruit weight, total number of fruits per plant, total yield per plant and marketable yield per plant and it had significantly negative correlation with FSB infestation on fruits and shoots. Total yield per plant was positively correlated with plant height, number of branches per plant, internodal length, fruit length, fruit weight, total number of fruits per plant, number of marketable fruits per plant and marketable yield per plant, while it had significantly negative correlation with FSB infestation on fruits and shoots. Marketable yield per plant was positively correlated with plant height, number of branches per plant, internodal length, fruit length, fruit weight, total number of fruits per plant, number of marketable fruits per plant and total yield per plant and negatively correlated with FSB infestation on fruits and shoots. FSB infestation on fruits had significantly positive correlation with FSB infestation on shoots, while it had significantly negative correlation with plant height, number of branches per plant, internodal length, fruit length, fruit weight, total number of fruits per plant, number of marketable fruits per plant, total yield per plant and marketable yield per plant. FSB infestation on shoots was positively correlated with days to 50% flowering, first flowering node, first fruiting
node, FSB infestation on fruits, while it was negatively correlated with plant height, number of branches per plant, internodal length, fruit length, fruit weight, total number of fruits per plant, number of marketable fruits per plant, total yield per plant and marketable yield per plant. On the whole, marketable yield per plant had significantly positive phenotypic correlation with plant height, number of branches per plant, internodal length, fruit length, fruit weight, total number of fruits per plant, number of marketable fruits per plant and total yield per plant and it had significantly negative correlation with FSB infestation on fruits.
Genotypic correlation
marketable fruit per plant, total yield per plant and marketable yield per plant and it had significantly negative correlation with first flowering node, first fruiting node and FSB infestation on fruits and shoots. Mehta et al. (2006) reported negative association of number of branches per plant with total yield per plant in okra. Internodal length had significantly positive correlation with plant height, number of branches per plant, fruit length, fruit weight, total number of fruits per plant, number of marketable fruits per plant, total yield per plant and marketable yield per plant, while it had significantly negative correlation with days to 50% flowering, first flowering node, first fruiting node and FSB infestation on shoots. These findings are in agreement with the earlier findings of Somashekhar et al. (2011) who also observed positive association between plant height and internodal length. In the present study, days to 50% flowering had significantly positive correlation with first flowering node, first fruiting node, fruit width and FSB infestation on shoots, while it had significantly negative correlation with number of branches per plant, intermodal length, fruit length, fruit weight, total number of fruits per plant, number of marketable fruits per plant, total yield per plant and marketable yield per plant. Positive association of days to 50% flowering with first flowering node and first fruiting node was also reported by Jaiprakashnarayan and Mulge (2004). Somashekhar et al. (2011) also observed negative association between days to 50% flowering and fruit yield. First flowering node had significantly positive correlation with days to 50% flowering, first fruiting node, fruit width and FSB infestation on shoots, while it had significantly negative correlation with plant height, number of branches per plant, internodal length, fruit length, total number of fruits per plant, number of marketable fruits per plant, total yield per plant and marketable yield per plant. First fruiting node had significantly positive
with days to 50% flowering, first flowering node, first fruiting node, FSB infestation on fruits and shoots.
Number of marketable fruits per plant had significantly positive correlation with plant height, number of branches per plant, internodal length, fruit length, fruit weight, total number of fruits per plant, total yield per plant and marketable yield per plant and it had significantly negative correlation with days to 50% flowering, first flowering node, first fruiting node and FSB infestation on fruits and shoots. All the fruit traits like fruit length, fruit width, fruit weight, total number of fruits per plant and number of marketable fruits per plant showed significantly positive association with fruit yield per plant and also among themselves except fruit width. The present findings are in consonance with the earlier findings of Bello et al. (2006) and Mehta
et al. (2006) who also reported positive
association of fruit length, fruit weight and total number of fruits per plant with total yield per plant in okra. Positive association of fruit length with fruit weight and total yield per plant was reported by Dakahe et al. (2007) and Jaiprakashnarayan and Mulge (2004), respectively.
Total yield per plant had significantly positive correlation with plant height, number of branches per plant, internodal length, fruit length, fruit weight, total number of fruits per plant, number of marketable fruits per plant and marketable yield per plant and it had significantly negative correlation with internodal length, days to 50% flowering, first flowering node, first fruiting node and FSB infestation on fruits and shoots. Similar association of total yield per plant was also observed by Somashekhar et al. (2011) for plant height, internodal length, fruit length, fruit width, fruit weight and total number of fruits per plant, Mehta et al. (2006) for number of branches per plant, days to 50% flowering,
Jaiprakashnarayan and Mulge (2004) for first flowering node and first fruiting node in okra. Marketable yield per plant had significantly positive correlation with plant height, number of branches per plant, internodal length, fruit length, fruit weight, total number of fruits per plant, number of marketable fruits per plant and total yield per plant and it had significantly negative correlation with days to 50% flowering, first flowering node, first fruiting node and FSB infestation on fruits and shoots. Similar association of marketable yield per plant was also observed by Pal et al. (2008) for fruit length, fruit width, fruit weight, total number of fruits per plant and total yield per plant in okra.
FSB infestation on fruits had significantly positive correlation with FSB infestation on shoots, while it had significantly negative correlation with plant height, number of branches per plant, fruit length, fruit weight, total number of fruits per plant, number of marketable fruits per plant, total yield per plant and marketable yield per plant. FSB infestation on shoots had significantly positive correlation with FSB infestation on fruits, while it had significantly negative correlation with plant height, number of branches per plant, internodal length, fruit length, total number of fruits per plant, number of marketable fruits per plant, total yield per plant and marketable yield per plant.
On the whole, marketable yield per plant had significantly positive genotypic correlation with plant height, number of branches per plant, internodal length, fruit width, fruit weight, total number of fruits per plant, number of marketable fruits per plant and total yield per plant and it had significantly negative correlation with FSB infestation on fruits.
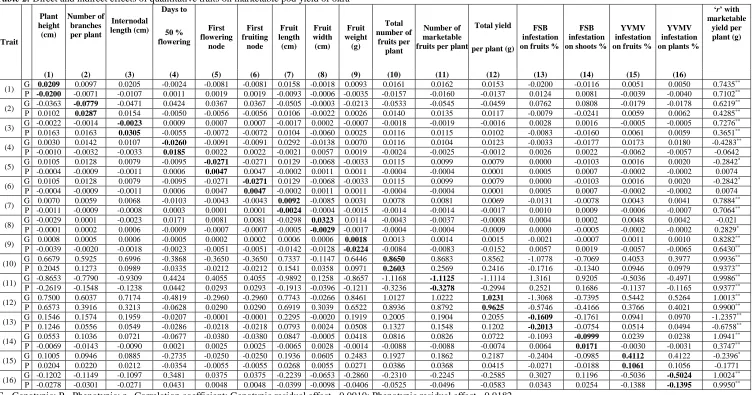
Partioning of the genotypic correlation coefficient of different components with grain yield into direct and indirect effect was done and results are presented in Table 2. At genotypic level, plant height, fruit length, fruit width and fruit weight had positively negligible direct effect on marketable yield per plant, while number of branches per plant, internodal length, days to 50% flowering, first flowering node and first fruiting node, FSB infestation on shoots had negatively negligible direct effect on marketable yield per plant. FSB infestation on fruits had negatively low direct effect on marketable yield per plant. Total number of fruit per plant had positively high direct effect on marketable yield per plant. Number of marketable fruits per plant and total yield per plant had very high negatively and positively direct effects, respectively on marketable yield per plant.
At phenotypic level, plant height, fruit length, fruit width and fruit weight had positively negligible direct effect on marketable yield per plant, while number of branches per plant, internodal length, days to 50% flowering, first flowering node, first fruiting node, FSB infestation on shoots had negatively negligible direct effect on marketable yield per plant. FSB infestation on fruits had negatively low direct effect on marketable yield per plant.
Total number of fruits per plant had positively high direct effect on marketable yield per plant. Number of marketable fruits per plant and total yield per plant had very high negatively and positively direct effects, respectively on marketable yield per plant.
Number of branches per plant, internodal length, days to 50% flowering, first flowering node, first fruiting node, FSB infestation on shoots had positively negligible direct effect, while plant height, fruit length, fruit width and fruit weight had negatively negligible direct effect on marketable yield per plant.
Table 1.Phenotypic and genotypic correlation among seventeen quantitative traits of okra
Trait Plant height (cm)
Number of branches per
plant
Internodal length (cm)
Days to 50 % flowering
First flowering
node
First fruiting
node
Fruit length (cm)
Fruit width (cm)
Fruit weight (g)
Total number of fruits per
plant
Number of marketable fruits
per plant
Total yield per plant
(g)
Marketable yield per plant
(g)
FSB infestation
on
YVMV infestation
on
Fruits % Shoots % Fruits % Plants %
(1) (2) (3) (4) (5) (6) (7) (8) (9) (10) (11) (12) (13) (14) (15) (16) (17)
(1) rg 1.0000 0.4664** 0.9811** -0.1136 -0.3885** -0.3885** 0.7601** -0.0884 0.4441** 0.7722** 0.7778** 0.7330** 0.7435** -0.9606** -0.5542** 0.2444** 0.2392*
p
r 1.0000 0.3555** 0.5355** -0.0555 -0.0926 -0.0926 0.4664** 0.0309 0.1746 0.7858** 0.7989** 0.6829** 0.7102** -0.6192** -0.4040** 0.1924 0.1994 (2) rg 1.0000 0.6053** -0.5442** -0.4707** -0.4707** 0.6486** 0.0044 0.2740* 0.6850** 0.7002** 0.5901** 0.6219** -0.9781** -1.0378** 0.2299 0.2288
p
r 1.0000 0.5355** -0.1728 -0.1945 -0.1945 0.3684** -0.0754 0.0900 0.4891** 0.4721** 0.4069** 0.4285** -0.2764* -0.8392** 0.2074 0.2155 (3) rg 1.0000 -0.4091** -0.2896* -0.2896* 0.7447** -0.0701 0.3106** 0.8088** 0.8367** 0.7012** 0.7276** -1.2174** -0.7224** 0.2151 0.2184
p
r 1.0000 -0.1806 -0.2346* -0.2346* 0.3421** -0.1964 0.0809 0.3802** 0.3778** 0.3338** 0.3651** -0.2728* -0.5249** 0.1999 0.1940 (4) rg 1.0000 0.3499** 0.3499** -1.1208** 0.5285** -0.2676* -0.4471** -0.3977** -0.4710** -0.4283** 0.1284 0.6780** -0.6652** -0.6928**
p
r 1.0000 0.1173 0.1173 -0.1154 0.3064** 0.1036 -0.1287 -0.1349 -0.0653 -0.0642 0.1419 0.1203 -0.3334** -0.3090**
(5) rg 1.0000 1.0000 -0.4739** 0.2494* 0.1217 -0.4219** -0.3645** -0.2893* -0.2842* 0.0008 0.3807** -0.0607 -0.0746
p
r 1.0000 1.0000 -0.0481 0.2303 0.2295 -0.0816 -0.0895 0.0301 0.0074 0.1085 0.1470 -0.0519 -0.0346
(6) rg 1.0000 -0.4739** 0.2494* 0.1217 -0.4219** -0.3645** -0.2893* -0.2842* 0.0008 0.3807** -0.0607 -0.0746
p
r 1.0000 -0.0481 0.2303 0.2295 -0.0816 -0.0895 0.0301 0.0074 0.1085 0.1470 -0.0519 -0.0346
(7) rg 1.0000 -0.9242** 0.3368** 0.8482** 0.8892** 0.7568** 0.7884** -1.4263** -0.8484** 0.4707** 0.4457**
p
r 1.0000 0.1824 0.6355** 0.5922** 0.5836** 0.7188** 0.7064** -0.3939** -0.3829** 0.2523* 0.2862*
(8) rg 1.0000 0.3541** -0.1327 -0.1130 -0.0260 -0.0210 0.0124 0.0049 0.1472 0.1301
p
r 1.0000 0.5721** 0.1376 0.1207 0.3157** 0.2829* -0.0120 0.1660 0.0522 0.0702
(9) rg 1.0000 0.7452** 0.7782** 0.8270** 0.8282** -1.1921** -0.4187** 0.6039** 0.5693**
p
r 1.0000 0.3731** 0.3694** 0.6776** 0.6430** -0.2526* -0.0841 0.2555* 0.2911*
(10) rg 1.0000 1.0039** 0.9898** 0.9936** -1.2461** -0.8172** 0.4686** 0.4598**
p
r 1.0000 0.9871** 0.9284** 0.9373** -0.6595** -0.5149** 0.3636** 0.3760**
(11) rg 1.0000 0.9991** 0.9986** -1.1830** -0.8274** 0.4527** 0.4468**
p
r 1.0000 0.9135** 0.9377** -0.7693** -0.5144** 0.3468** 0.3556**
(12) rg 1.0000 1.0013** -1.2772** -0.7227** 0.5319** 0.5145**
p
r 1.0000 0.9900** -0.5970** -0.4328** 0.3912** 0.4177**
(13) rg 1.0000 -1.2357** -0.7462** 0.4874** 0.4737**
p
r 1.0000 -0.6758** -0.4604** 0.3685** 0.3906**
(14) rg 1.0000 1.0941** -0.5847** -0.6026**
p
r 1.0000 0.3747** -0.2553* -0.2456*
(15) rg 1.0000 -0.2396* -0.2380*
p
r 1.0000 -0.1771 -0.1822
(16) rg 1.0000 1.0024**
p
r 1.0000 0.9950**
(17) rg 1.0000
p
r 1.0000
= Genotypic correlation coefficient; rp = Phenotypic correlation coefficient
g
Table 2.Direct and indirect effects of quantitative traits on marketable pod yield of okra
Trait
Plant height (cm)
Number of branches per plant
Internodal length (cm)
Days to
50 % flowering
First flowering
node
First fruiting
node
Fruit length
(cm)
Fruit width (cm)
Fruit weight
(g)
Total number of
fruits per plant
Number of marketable fruits per plant
Total yield
per plant (g)
FSB infestation on fruits %
FSB infestation on shoots %
YVMV infestation on fruits %
YVMV infestation on plants %
‘r’ with
marketable yield per plant (g)
(1) (2) (3) (4) (5) (6) (7) (8) (9) (10) (11) (12) (13) (14) (15) (16)
(1) G 0.0209 0.0097 0.0205 -0.0024 -0.0081 -0.0081 0.0158 -0.0018 0.0093 0.0161 0.0162 0.0153 -0.0200 -0.0116 0.0051 0.0050
**
0.7435
P -0.0200 -0.0071 -0.0107 0.0011 0.0019 0.0019 -0.0093 -0.0006 -0.0035 -0.0157 -0.0160 -0.0137 0.0124 0.0081 -0.0039 -0.0040 0.7102**
(2) G -0.0363 -0.0779 -0.0471 0.0424 0.0367 0.0367 -0.0505 -0.0003 -0.0213 -0.0533 -0.0545 -0.0459 0.0762 0.0808 -0.0179 -0.0178
**
0.6219 P 0.0102 0.0287 0.0154 -0.0050 -0.0056 -0.0056 0.0106 -0.0022 0.0026 0.0140 0.0135 0.0117 -0.0079 -0.0241 0.0059 0.0062 0.4285**
(3) G -0.0022 -0.0014 -0.0023 0.0009 0.0007 0.0007 -0.0017 0.0002 -0.0007 -0.0018 -0.0019 -0.0016 0.0028 0.0016 -0.0005 -0.0005
**
76 0.72 P 0.0163 0.0163 0.0305 -0.0055 -0.0072 -0.0072 0.0104 -0.0060 0.0025 0.0116 0.0115 0.0102 -0.0083 -0.0160 0.0061 0.0059 0.3651**
(4) G 0.0030 0.0142 0.0107 -0.0260 -0.0091 -0.0091 0.0292 -0.0138 0.0070 0.0116 0.0104 0.0123 -0.0033 -0.0177 0.0173 0.0180
**
0.4283 -P -0.0010 -0.0032 -0.0033 0.0185 0.0022 0.0022 -0.0021 0.0057 0.0019 -0.0024 -0.0025 -0.0012 0.0026 0.0022 -0.0062 -0.0057 -0.0642
(5) G 0.0105 0.0128 0.0079 -0.0095 -0.0271 -0.0271 0.0129 -0.0068 -0.0033 0.0115 0.0099 0.0079 0.0000 -0.0103 0.0016 0.0020
*
0.2842 -P -0.0004 -0.0009 -0.0011 0.0006 0.0047 0.0047 -0.0002 0.0011 0.0011 -0.0004 -0.0004 0.0001 0.0005 0.0007 -0.0002 -0.0002 0.0074
(6) G 0.0105 0.0128 0.0079 -0.0095 -0.0271 -0.0271 0.0129 -0.0068 -0.0033 0.0115 0.0099 0.0079 0.0000 -0.0103 0.0016 0.0020
*
0.2842 -P -0.0004 -0.0009 -0.0011 0.0006 0.0047 0.0047 -0.0002 0.0011 0.0011 -0.0004 -0.0004 0.0001 0.0005 0.0007 -0.0002 -0.0002 0.0074
(7) G 0.0070 0.0059 0.0068 -0.0103 -0.0043 -0.0043 0.0092 -0.0085 0.0031 0.0078 0.0081 0.0069 -0.0131 -0.0078 0.0043 0.0041
**
0.7884 P -0.0011 -0.0009 -0.0008 0.0003 0.0001 0.0001 -0.0024 -0.0004 -0.0015 -0.0014 -0.0014 -0.0017 0.0010 0.0009 -0.0006 -0.0007 0.7064**
(8) G -0.0029 0.0001 -0.0023 0.0171 0.0081 0.0081 -0.0298 0.0323 0.0114 -0.0043 -0.0037 -0.0008 0.0004 0.0002 0.0048 0.0042 -0.021 P -0.0001 0.0002 0.0006 -0.0009 -0.0007 -0.0007 -0.0005 -0.0029 -0.0017 -0.0004 -0.0004 -0.0009 0.0000 -0.0005 -0.0002 -0.0002 0.2829*
(9) G 0.0008 0.0005 0.0006 -0.0005 0.0002 0.0002 0.0006 0.0006 0.0018 0.0013 0.0014 0.0015 -0.0021 -0.0007 0.0011 0.0010
**
0.8282 P -0.0039 -0.0020 -0.0018 -0.0023 -0.0051 -0.0051 -0.0142 -0.0128 -0.0224 -0.0084 -0.0083 -0.0152 0.0057 0.0019 -0.0057 -0.0065 0.6430**
(10) G 0.6679 0.5925 0.6996 -0.3868 -0.3650 -0.3650 0.7337 -0.1147 0.6446 0.8650 0.8683 0.8562 -1.0778 -0.7069 0.4053 0.3977
**
0.9936 P 0.2045 0.1273 0.0989 -0.0335 -0.0212 -0.0212 0.1541 0.0358 0.0971 0.2603 0.2569 0.2416 -0.1716 -0.1340 0.0946 0.0979 0.9373**
(11) G -0.8653 -0.7790 -0.9309 0.4424 0.4055 0.4055 -0.9892 0.1258 -0.8657 -1.1168 -1.1125 -1.1114 1.3161 0.9205 -0.5036 -0.4971
**
0.9986 P -0.2619 -0.1548 -0.1238 0.0442 0.0293 0.0293 -0.1913 -0.0396 -0.1211 -0.3236 -0.3278 -0.2994 0.2521 0.1686 -0.1137 -0.1165 0.9377**
(12) G 0.7500 0.6037 0.7174 -0.4819 -0.2960 -0.2960 0.7743 -0.0266 0.8461 1.0127 1.0222 1.0231 -1.3068 -0.7395 0.5442 0.5264
**
1.0013 P 0.6573 0.3916 0.3213 -0.0628 0.0290 0.0290 0.6919 0.3039 0.6522 0.8936 0.8792 0.9625 -0.5746 -0.4166 0.3766 0.4021 0.9900**
(13) G 0.1546 0.1574 0.1959 -0.0207 -0.0001 -0.0001 0.2295 -0.0020 0.1919 0.2005 0.1904 0.2055 -0.1609 -0.1761 0.0941 0.0970
**
1.2357 -P 0.1246 0.0556 0.0549 -0.0286 -0.0218 -0.0218 0.0793 0.0024 0.0508 0.1327 0.1548 0.1202 -0.2013 -0.0754 0.0514 0.0494 -0.6758**
(14) G 0.0553 0.1036 0.0721 -0.0677 -0.0380 -0.0380 0.0847 -0.0005 0.0418 0.0816 0.0826 0.0722 -0.1093 -0.0999 0.0239 0.0238
**
1.0941 P -0.0069 -0.0143 -0.0090 0.0021 0.0025 0.0025 -0.0065 0.0028 -0.0014 -0.0088 -0.0088 -0.0074 0.0064 0.0171 -0.0030 -0.0031 0.3747**
(15) G 0.1005 0.0946 0.0885 -0.2735 -0.0250 -0.0250 0.1936 0.0605 0.2483 0.1927 0.1862 0.2187 -0.2404 -0.0985 0.4112 0.4122
*
0.2396 -P 0.0204 0.0220 0.0212 -0.0354 -0.0055 -0.0055 0.0268 0.0055 0.0271 0.0386 0.0368 0.0415 -0.0271 -0.0188 0.1061 0.1056 -0.1771
(16) G -0.1202 -0.1149 -0.1097 0.3481 0.0375 0.0375 -0.2239 -0.0653 -0.2860 -0.2310 -0.2245 -0.2585 0.3027 0.1196 -0.5036 -0.5024
**
Under this condition, the indirect effects seem to be cause of correlation. In such situations, the indirect casual factors are to be considered simultaneously for selection.
The residual factor determines how best the casual factors account for the variability of the dependent factor, the marketable pod yield per plant in this case. The residual effects were 0.0818 and 0.001, which were of negligible magnitude at genotypic and phenotypic levels. The variables studied explain about 91.82% and 99.90% of the variability at genotypic and phenotypic levels, respectively in the marketable pod yield per plant.
Conclusion
In conclusion, the correlation coefficient analysis of seventeen quantitative traits revealed strong association among growth, earliness and yield parameters of okra under study. Total number of fruits per plant and total yield per plant had positively high and very high direct effects, respectively on marketable yield per plant. Further, these traits also had significantly positive correlation with marketable pod yield and positive inter-correlation also among themselves. Hence, total number of fruits per plant and total yield per plant were the important yield contributing characters, which need to be considered while framing selection criteria in okra breeding programmes. It can, therefore, be concluded that the traits viz., total number of fruits per plant and total yield per plant are the important yield contributing traits and due critical emphasis needs be given to these traits while selecting for marketable pod yield improvement in okra. The improvement in marketable pod yield per plant will be efficient, if the selection is based on total number of fruits per plant and total yield per plant.
References
Adeniji, O.T. and Peter, J.M. 2005. Stepwise regression analysis of pod and seed yield characters in segregating F2 population of West African okra (Abelmoschus caillei).
Proceedings of 30th Conference, Genetics Society of
Nigeria, pp. 250- 258.
Akinyele, B.O. and Osekita, O.S. 2006. Correlation and path coefficient analyses of seed yield attributes in okra
(Abelmoschus esculentus (L.) Moench). African Journal
of Biotechnology. 5(14), 1330-1336.
Arunachalam, V. 1976. Evaluation of diallel
crossesgraphical and combining ability method. Indian
Journal of Genetics. 36: 358-366.
Bello, D., Sajo, A.A., Chubado, D. and Jellason, J.J. 2006. Variability and correlation studies in okra. (Abelmoschus
esculentus (L.) Moench). Journal of Sustainable
Development in agriculture and Environment. 2(1):
120-126.
Bendale, V.W., Kadam, S.R., Bhave, S.G., Mehta, J.L. and Pethe, U.B. 2003. Genetic variability and correlation studies in okra. The Orissa Journal of Horticulture. 31(2): 1-4.
Bendale, V.W., Kadam, S.R., Bhave, S.G. and Mehta, J.L. 2003. Character association and path coefficient analysis in okra. Journal of Soils and Crops. 13(2): 386-388.
Camciuc, M., Deplagne, M., Vilarem, G. and Gaset, A. 1998. Okra – Abelmoschus esculentus (L.) Moench), a crop with economic potential for set aside acreage in France. Industrial Crops Products. 7: 257-264.
Chinatu, L.N. and Okocha, P.I. 2006. The prospect of increased production of okra (Abelmoschus esculentus
(L.) Moench through heterosis. Journal of Sustainable
Tropical Agricultural Research. 17: 66-71.
Dakahe, K., Patil, H.E. and Patil, S.D. 2007. Genetic
variability and correlation studies in okra.
(Abelmoschus esculentus (L.) Moench). The Asian
Journal of Horticulture. 2(1): 201-203.
Hammon, S. and Van Sloten, D.H. 1989.
Characterization and evaluation of okra. In The use of plant genetic resources. p 173-174.
(L.) Moench]. Indian Journal of Horticulture. 61(3): 232-235.
Kang, M.S., Miller, J.D. and Tai, P.P. 1983. Genetic and phenotypic path analyses and heritability in sugarcane. Crop Science. 23, 643-647.
Kumar, P.S. and Sreeparvathy, S. 2010. Studies on heterosis in okra (Abelmoschus esculentus (L.) Moench).
ElectronicJournal of Plant Breeding. 1(6): 1431-1433.
Mehta, Y.R. 1959. Vegetable growing in Uttar Pradesh, Bureau of Agricultural Information, U.P., Lucknow.
Metha, D.R, Dhaduk, K.L. and Patel, K.D. 2006. Genetic variability, correlation and path analysis studies in okra.
Agriculture Science Digest. 26(1): 15-18.
Mohapatra, M.R., Acharyya, P. and Sengupta, S. 2007. Variability and association analysis in okra. Indian
Agriculturist. 51(1&2): 17-26.
Murdock, G.P. 1959. Africa, its people and their culture history. 456 p. McGraw-Hill, New York, USA.
Nadkarni, K.M. 1972. Indian Meteria and Medica. Nadkarni and Co., Bombay, India.
NHB. 2012. Indian Horticulture Database 2011. National Horticulture Board (NHB), Gurgaon, India, p. 157
Pal, A.K., Das, N.D. and De, D.K. 2008. Studies on association of important yield components in okra. Indian
Journal of Horticulture. 65(3): 356-361.
Patro, T.S.K.K.K. and Sankar, C.R. 2006. Character association and path coefficient analysis in okra
(Abelmoschus esculentus (L.) Moench). Journal of
Research ANGRAU. 34(1): 8-14.
Rashwan, A.M.A. 2011. Study of genotypic and phenotypic correlation for some agro-economic traits in okra [Abelmoschus esculentus (L.) Moench]. Asian
Journal of Crop Science. 3(2): 85-91.
Reddy, M.T., 2010. Genetic diversity, heterosis, combining ability and stability in okra (Abelmoschus
esculentus (L.) Moench). Ph. D. Thesis, Acharya N. G.
Ranga Agricultural University, Rajendranagar,
Hyderabad. 313.
Schippers, R.R. 2000. African indigenous vegetables- An overview of the cultivated species. pp. 103-118.
Singh, R.K. and Chaudhary, B.D. 1985. Biometrical methods in quantitative genetic analysis. Kalyani Publishers, Ludhiana, New Dehli, India, pp. 303.
Singh, B., Pal, A.K. and Singh, S. 2006. Genetic variability and correlation analysis in okra (Abelmoschus
esculentus (L.) Moench). Indian Journal of Horticulture.
63(3): 63-66.
Singh, B., Pal, A.K. and Singh, S. 2006. Genetic variability and correlation analysis in okra. (Abelmoschus
esculentus (L.) Moench). IndianJournal of Horticulture.
63(3): 281-285.
Somashekhar, G., Mohankumar, H.D. and Salimath, P.M. 2011. Genetic analysis of association studies in segregating population of okra. Karnataka Journal of
Agricultural Science. 24(4): 432-435.
Steel, R.G.D. and Torrie, J.H.1980. Principles and procedures of statistics. Mc Graw Hill Book Co., New York.
Weber, C.R. and Moorthy, B.R. 1952, Heritable and non-heritable relationship and variability of oil content and agronomic characters in the F2 generation of soybean