STOCHASTIC COST EFFICIENCY EVALUATION OF A SUPPLY CHAIN
M. MIRBOLOUKI1,§
Abstract. The main goal of the paper is a consideration of cost efficiency evaluation models related to some supply chain when dealing with imprecise data. Data envelopment analysis (DEA) method is a non-parametric mathematical programming approach to assess the performance. This method is proposed for deterministic data and it can be generalized to inaccurate data, while considering real world applications. Here we consider data as random variables and after reviewing and introducing new models to evaluate cost efficiencies related to the special circumstances of the supply chain using DEA, these models are developed to probabilistic form. Also, deterministic and linear equivalents are proposed using the symmetric error structure of normal distributions. At final, by a numerical example, the proposed models are examined to show relationships of results.
Keywords: Data envelopment analysis, Supply chain management, Performance mea-sures, Symmetric error structure, Cost efficiency.
AMS Subject Classification: 90BXX, 90B15, 90CXX, 90C15.
1. Introduction
Farrell (1957) laid the foundation to measure efficiency and productivity studies at the micro level. His contribution highlighted new insights on two issues: how to define efficiency and productivity, and how to calculate the benchmark technology and efficiency measures. Using Farrell idea, Charnes et al. (1978) by introducing the CCR model, suggested a mathematical technique for evaluating the relative technical efficiency of a set of Decision Making Units (DMUs) with the common set of inputs and outputs. This technique is well known to Data Envelopment Analysis (DEA). Besides technical efficiency, cost efficiency is the other measure of DEA that evaluates the ability of a DMU to produce the current outputs at minimal cost when the prices of inputs are at hand. Cost efficiency was first introduced by Farrell (1957), and then developed by Fre et al. (1985). Tone (2002) pointed out the shortcomings of the cost efficiency measures in the presence of price differences between the DMUs. To overcome this limitation, he relaxed the fixed price assumption and proposed the assessment of the DMUs in the cost space. The assumption of DEA was based on the exact data, but in the real word, because of some conditions such as the financial crisis and social conditions, usually data are imprecise and performance evaluation by usual methods in the presence of inaccurate data may
1
Young Researchers and Elite Club, Yadegar-e-Imam Khomeini (RAH)Shahre Rey Branch, Islamic Azad University, Tehran, Iran.
e-mail: [email protected];
§ Manuscript received: May 24,2015, Accepted: February 02, 2016.
TWMS Journal of Applied and Engineering Mathematics, Vol.6, No.1; cI¸sık University, Department of Mathematics, 2016; all rights reserved.
lead to errors in decision making process and conventional DEA cannot easily measure the performance. Considering the necessity to use random data in practical applications, several researchers have extended ordinal DEA models to stochastic concepts. Thore (1987) initiated a series of efforts directed to chance-constrained programming with DEA as a method for dealing with random data in DEA. Cooper et al. (1996) extended DEA models with inputs and outputs as normal random variables. Also, they defined stochastic efficient DMU. Li (1998) and Huang and Li (2001) defined the efficiency dominance of a DMU via probabilistic comparisons of inputs and outputs with other DMUs which are assessed by solving a chance constrained programming problem. After that Olesen (2002), Cooper et al. (2004), Khodabakhshi and Asgarian (2008) and Hosseinzadeh Lotfi et al. (2012) have provided some DEA models with random data. In conventional Data Envelopment Analysis, DMUs are generally treated as a black-box in the sense that internal structures are ignored, and the performance of a DMU is assumed to be a function of a set of chosen inputs and outputs. A significant body of work has been directed at problem settings where the DMU is characterized by a multistage process; supply chains and many manufacturing processes take this form. Recent DEA literature on serial processes has tended to concentrate on closed systems, that is, where the outputs from one stage become the inputs to the next stage, and where no other inputs enter the process at any intermediate stage. To estimate the efficiency of such systems, several authors proposed network DEA models Fre and Grosskopf (2000) proposed a Network DEA model for measuring efficiency for DMUs with multiple production stage. Seiford and Zhu (1999) and Chen and Zhu (2004), provide two approaches in modeling efficiency as a two-stage process. Liang et al. (2006) identified the efficiency of supply chain and its members through one DEA model. Chen and Yan (2011) proposed the Network DEA models for measuring efficiency of supply chain, which is based on a radial network DEA model under three mechanisms: centralized, decentralized and mixed.
The main goal of this paper is a consideration of cost efficiency evaluation models related to centralized and decentralized supply chain models when dealing with imprecise data. Here we consider data as random variables and after reviewing and introducing new models to evaluate cost efficiency related to the special circumstances of the supply chain using DEA, these models are developed to probabilistic form. Also, deterministic and linear equivalents are proposed using the symmetric error structure of normal distributions. At final, by a numerical example, the proposed models are examined to show relationships of results.
The remainder of the paper is organized as follows. The next section briefly introduces the method of DEA and efficiency evaluation of supply chain. Then proposed models in stochastic area are presented in section3. The model is then illustrated by an example in this section. Also, Conclusions are provided in the last section.
2. Preliminaries
In this section, first, CCR model in evaluating the technical efficiency and the cost efficiency model is introduced. After that, the centralized and decentralized models of Chen and Yan (2011) in technical supply chain efficiency evaluation are presented.
scale (VRS) and output orientation (Banker et al., 1984). The originally suggested input oriented CCR is formulated as:
min θ s.t. Pn
j=1λjxij ≤θ xio, i= 1, ..., m, Pn
j=1λjyrj ≥yro, r = 1, ..., s,
λj ≥0, j= 1, ..., n.
(1)
whereθis a scalar,λ= (λ1, λ2, ..., λn)is an×1 vector of constants,yrjis therth output for
aDM Uj,r = 1, ..., s,j= 1, ..., n. Also,xijis theith input for theDM Uj,i= 1, ..., m. The
value ofθobtained will be the technical efficiency score for theoth DMU where 0≤θ≤1. A DMU is called efficient if the related optimalθequals 1.
Besides technical efficiency, cost efficiency is the other measure of DEA that evaluates the ability of a DMU to produce the current outputs at minimal cost when the prices of inputs are at hand. Farrell first introduced the concept of cost efficiency underlying a DEA assessment (1957). Fare et al. (1985) operationalized cost efficiency measures based on the Farrell concept in the DEA literature. Their model is the following linear problem:
min Pm
i=1cixi s.t. Pn
j=1λjxij ≤xi, i= 1, ..., m,
Pn
j=1λjyrj ≥yro r= 1, ..., s,
λj ≥0, j= 1, . . . , n.
(2)
where ci is the unit cost of the input iwhich is the benchmark projection that can be
different from one DMU to another. The minimization problem is calculated for each DMU of the sample, thus identifying for each a benchmark combination of inputs and cost.
Based on an optimal solution (x∗, λ∗) of model (2), the cost efficiency ofDM Uo is defined
as
CEo=
cx∗ cxo
(3)
whereCEo is the ratio of minimum cost to observed cost to the oth firm.
2.2. Supply chain efficiency evaluation. A supply chain is in the form of a network with multiple divisions and relationships. The supply chain performance measurement that only considers the initial inputs and the final outputs is generally inadequate since it ignores the interactions among the divisions. To measure the supply chain performance properly, it is necessary to explore the complex internal structure and emphasize the interrelated nature in a supply chain. Here the centralized and decentralized models of Chen and Yan (2011) are introduced. They incorporated the interactions in supply chain and developed different DEA models under the concept of centralized, decentralized and mixed organization mechanism respectively for supply chain performance evaluation. Supply chain efficiency is referring to technical efficiency.
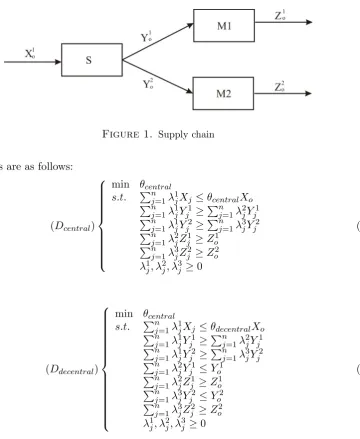
Now consider a set of two stage supply chain with one supplier and two manufacturers, as DMUs. The structure ofDM Uo is portrayed in Fig. 1.
Figure 1. Supply chain
mechanisms are as follows:
(Dcentral)
min θcentral
s.t. Pn
j=1λ1jXj ≤θcentralXo
Pn
j=1λ1jYj1 ≥
Pn
j=1λ2jYj1
Pn
j=1λ1jYj2 ≥
Pn
j=1λ3jYj2
Pn
j=1λ2jZj1 ≥Zo1
Pn
j=1λ3jZj2 ≥Zo2
λ1j, λ2j, λ3j ≥0
(4)
and
(Ddecentral)
min θcentral
s.t. Pn
j=1λ1jXj ≤θdecentralXo
Pn
j=1λ1jYj1 ≥
Pn
j=1λ2jYj1
Pn
j=1λ1jYj2 ≥
Pn
j=1λ3jYj2
Pn
j=1λ2jYj1 ≤Yo1
Pn
j=1λ2jZj1 ≥Zo1
Pn
j=1λ3jYj2 ≤Yo2
Pn
j=1λ3jZj2 ≥Zo2
λ1j, λ2j, λ3j ≥0
(5)
3. Stochastic cost efficiency of the supply chain
In this section we first review the chance constrained stochastic CCR model and its deterministic and linear programming equivalent. Next, the stochastic cost efficiency of the multiple stage supply chain in centralized and decentralized mechanisms is presented.
3.1. Stochastic CCR model. Let us assume that ˜xj = (˜x1j, ...,x˜mj) and ˜yj = (˜y1j, ...,y˜sj)
are the stochastic input and output vectors forDM Uj, in a way that each element of these
vectors is a random variable with normal distribution and the following specified or esti-mated parameters:
˜
xij =xij +aijε˜ij, i= 1, ..., m,
˜
yrj =yrj +brjξ˜rj, r= 1, ..., s.
(6)
whereaijand brjare nonnegative real values. Also, ˜εij and ˜ξrj are the error terms which
Assume that theith input of every DMUs is interrelated. Similarly, assume rth output of every DMUs is interrelated, too. i.e. for everyj6=k,
Cov(˜xij,x˜ik) = 0, i= 1, ..., m,
Cov(˜yrj,y˜rk) = 0, r = 1, ..., s.
(7)
Now consider the chance constraint CCR model as:
min θ s.t. P
Pn
j=1λjx˜ij ≤θ˜xio
≥1−α, i= 1, ..., m, PPn
j=1λjy˜rj ≥y˜ro
≥1−α, r= 1, ..., s,
λj ≥0, j= 1, ..., n.
(8)
where in the above model, P means “probability” and α is a level of error between 0 and 1. Model (8) can be converted to a deterministic and linear programming applying symmetric error structure and independent properties (6) and (7) as the following model (refer to Behzadi and Mirbolouki, 2012):
min θ s.t. Pn
j=1λjxij−Φ−1(α)¯σ(p+i +p−i )≤θxio i= 1, ..., m,
Pn
j=1λjyrj+ Φ−1(α)¯σ(qr++q−r)≥yro, r= 1, ..., s,
Pn
j=1λjaij −θaio =p +
i −p
−
i , i= 1, ..., m,
Pn
j=1λjbrj−bro =qr+−q−r, r= 1, ..., s,
λj, p+i , p−i , q+r, qr−≥0, ∀j,∀i,∀r
(9)
In the above model, Φ is the cumulative distribution function of the standard normal distribution.
3.2. Stochastic cost efficiency of supply chain. First, using symmetric error struc-ture, the stochastic cost efficiency model related to the stochastic version of the model (2) is presented to compare with the efficiency of the supply chain. This model is:
min Pm i=1cixi
s.t. Pn
j=1λjxij−Φ
−1(α)(p+
i +p
−
i )≤xi, i= 1, ..., m,
Pn
j=1λjyrj + Φ−1(α)(q+i +q
−
i )≥yro, r = 1, ..., s,
p+i −p−i =Pn
j=1λjaij, i= 1, ..., m,
q+i −qi−=Pn
j=1λjbrj −bro, r = 1, ..., s,
λj ≥0, j= 1, . . . , n.
(10)
Here, the stochastic cost efficiency is defined by the below formulation:
˜ Eco =
Pm
i=1cix ∗
i
Pm
i=1ci(xio+ 3aio)
(11)
where (xio+3aio) is the upper bound of 6σinterval and it is used to increase the probability
of ˜Eco ≤ 1. It must be noted that by this definition, almost always ˜Eco < 1. Therefore, there is not any number to show a stochastic efficient DMU, similar in deterministic form. Now consider a multiple stage supply chain, including one supplier and k manufacturer with the following stochastic symmetric structure data:
˜
xij =xij +aijε˜ij, i= 1, ..., m,
˜
yljt =yljt +bljtξ˜tlj, l= 1, ..., Lk, t= 1, ..., k,
˜
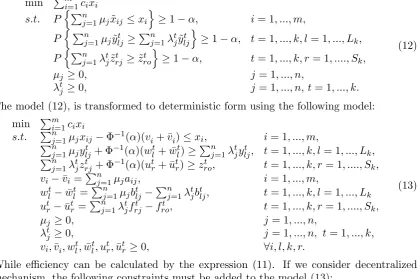
Thus, the chance constrained model related to cost efficiency of supply chain within the centralized mechanism can be obtained by the following model:
min Pm
i=1cixi
s.t. P n
Pn
j=1µjx˜ij ≤xi o
≥1−α, i= 1, ..., m, PnPn
j=1µjy˜ljt ≥
Pn
j=1λtjy˜tlj
o
≥1−α, t= 1, ..., k, l= 1, ..., Lk,
P n
Pn
j=1λtjz˜rjt ≥z˜rot
o
≥1−α, t= 1, ..., k, r= 1, ...., Sk,
µj ≥0, j= 1, ..., n,
λtj ≥0, j= 1, ..., n, t= 1, ..., k.
(12)
The model (12), is transformed to deterministic form using the following model:
min Pm
i=1cixi s.t. Pn
j=1µjxij−Φ−1(α)(vi+ ¯vi)≤xi, i= 1, ..., m,
Pn
j=1µjytlj+ Φ−1(α)(wlt+ ¯wtl)≥
Pn
j=1λtjytlj, t= 1, ..., k, l = 1, ..., Lk,
Pn
j=1λtjzrjt + Φ−1(α)(utr+ ¯utr)≥zrot , t= 1, ..., k, r= 1, ...., Sk,
vi−v¯i =Pjn=1µjaij, i= 1, ..., m,
wtl−w¯lt=Pn
j=1µjbtlj−
Pn
j=1λtjbtlj, t= 1, ..., k, l = 1, ..., Lk
utr−u¯tr=Pn
j=1λtjfrjt −frot , t= 1, ..., k, r= 1, ...., Sk,
µj ≥0, j= 1, ..., n,
λtj ≥0, j= 1, ..., n, t= 1, ..., k, vi,¯vi, wtl,w¯lt, utr,u¯tr ≥0, ∀i, l, k, r.
(13)
While efficiency can be calculated by the expression (11). If we consider decentralized mechanism, the following constraints must be added to the model (13):
Pn
j=1µjyljt −Φ−1(α)(gtl+ ¯gtl)≤ytlo, t= 1, ..., k, l= 1, ..., Lk,
gtl−¯glt=Pn
j=1µjbtlj−btlo, t= 1, ..., k, l= 1, ..., Lk,
gtl ≥0, g¯lt≥0, t= 1, ..., k, l= 1, ..., Lk.
(14)
The stochastic cost efficiency is a function of the level of errorα. Theorem 3.1 shows that this function is a non-decreasing function.
Theorem 3.1. The optimal objective function of model (3-8) will be decreased by increasingα. Proof. Let α0 < α. Since Φ−1(α) is an increasing function, the optimal solution of model (13) inα0 level of error is a feasible solution forαlevel. Therefore the minimizing objective
function proves the theorem.
ConsiderECocenteraland ECodecenteral as the stochastic cost efficiency related to centralized and decentralize mechanisms respectively. Also, ECoCCR is the stochastic cost efficiency of considering each DMU as a black-box. Theorem 3.2 shows the relations between these values.
Theorem 3.2. in every level of error, ECodecenteral≤ECocenteral ≤ECoBlack−Box.
Proof. it is obvious by the constraints of the related models.
respectively. Data in Table 1 relates to 10 DMUs with supply chain structures, which their suppliers have two inputs (x1 and x2) and two outputs(y1 and y2). Every output of supplier is as input of a manufacturer. The outputs of each DMU are as outputs of manufacturers (z1 and z2).
Table 1. Stochastic inputs and outputs.
x1 x2 y1 y2 z1 z2 µ σ µ σ µ σ µ σ µ σ µ σ
DMU1 120 18 40 6 70 21 51 3 18 5 41 9
DMU2 170 16 60 7 54 9 48 8 28 6 56 2
DMU3 90 14 30 3 60 8 39 7 19 3 30 5
DMU4 85 11 50 8 27 2 18 2 14 1 27 7
DMU5 40 6 20 2 24 3 21 4 12 2 12 2
DMU6 270 31 80 10 91 11 57 5 38 1 96 17
DMU7 35 8 25 4 17 1 21 3 8 1 9 3
DMU8 118 19 70 13 62 5 31 2 21 2 68 14
DMU9 65 5 40 9 37 4 18 1 17 3 32 7
DMU10 50 7 27 1 29 3 11 1 10 2 21 4
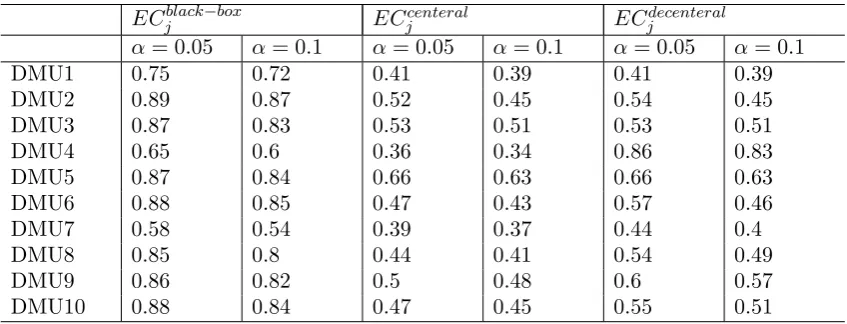
Table 2. Computationally results of stochastic centralized, decentralized and black-box cost efficiencies.
ECjblack−box ECjcenteral ECjdecenteral
α= 0.05 α= 0.1 α= 0.05 α= 0.1 α= 0.05 α= 0.1
DMU1 0.75 0.72 0.41 0.39 0.41 0.39
DMU2 0.89 0.87 0.52 0.45 0.54 0.45
DMU3 0.87 0.83 0.53 0.51 0.53 0.51
DMU4 0.65 0.6 0.36 0.34 0.86 0.83
DMU5 0.87 0.84 0.66 0.63 0.66 0.63
DMU6 0.88 0.85 0.47 0.43 0.57 0.46
DMU7 0.58 0.54 0.39 0.37 0.44 0.4
DMU8 0.85 0.8 0.44 0.41 0.54 0.49
DMU9 0.86 0.82 0.5 0.48 0.6 0.57
DMU10 0.88 0.84 0.47 0.45 0.55 0.51
Data in Table 1 are substituted in models (10), (13) and (13) with (14) extended con-straints. Results that are gathered in Table 2 for two different levels of confidence, 90% and 95%, confirm Theorems 3.1 and 3.2.
4. Concluding results
DEA, these models are developed to probabilistic form. Also, deterministic and linear equivalents are proposed using the symmetric error structure of normal distributions. At final, by a numerical example, the results of models are examined.
Acknowledgement The authors would like to extend their gratitude to Young Re-searchers and Elite Club because of their support.
References
[1] Charnes,A., Cooper,W.W. and Rhodes,E., (1978), Measuring the efficiency of decision making units, European Journal of Operational Research, 2, pp. 429-444.
[2] Banker,R.D., Charnes,A. and Cooper,W.W. (1984), Some models for estimating technical and scale inefficiencies in data envelopment analysis, Management Science, 30, pp. 1078-1092.
[3] Chen,C. and Yan,H., (2011), Network DEA model for supply chain performance evaluation, European Journal Operation Research, 213, pp. 147-155.
[4] Chen,Y. and Zhu,J., (2004), Measuring information technology’s indirect impact on firm performance, Information Technology and Management Journal, 5, pp. 9-22.
[5] Cooper,W.W., Deng,H., Huang,Z. and Li,S.X., (2004), Chance constrained programming approaches to congestion in stochastic data envelopment analysis, European Journal of Operational Research, 155, pp. 487-501.
[6] Cooper,W.W., Huang,Z. and Li, S., (1996), Satisficing DEA models under chance constraints, The Annals of Operations Research, 66, pp. 259-279.
[7] Cooper,W.W., Thompson,R.G. and Thrall,R.M., (1996), Introduction: Extensions and new develop-ments in DEA Annals of Operations Research, 66, pp. 3-46.
[8] Fare,R. and Grosskopf,S., (2000), Network DEA, Socio-Economic Planning Sciences, 34, pp. 35-49. [9] Fare,R., Grosskopf,S. and Lovell,C.A.K., (1985), The measurement of efficiency of production, Kluwer
Dordrecht MA.
[10] Farrell,M.J., (1957), The Measurement of Productive Efficiency, Journal of the Royal Statistical So-ciety. Series A (General), 120, pp. 253-290.
[11] Hosseinzadeh,L.,F., Nematollahi,N., Behzadi,M.H., Mirbolouki,M. and Moghaddas,Z., (2012), Cen-tralized resource allocation with stochastic data, Journal of Computations and Applied Mathematics, 236, pp. 1783-1788.
[12] Huang,Z. and Li,S.X., (2001), Stochastic DEA models with different types of input–output distur-bances, Journal of Productivity Analysis, 15, pp. 95-113.
[13] Khodabakhshi,M. and Asgharian,M., (2008), An input relaxation measure of efficiency in stochastic data envelopment analysis, Applied Mathematical Modelling, 33, pp. 2010-2023.
[14] Li,S.X., (1998), Stochastic models and variable returns to scales in data envelopment analysis, Euro-pean Journal of Operational Research, 104, pp. 532-548.
[15] Liang,L., Yang, F., Cook,W.D. and Zhu,J., (2006), DEA models for supply chain efficiency evaluation, Annals of Operation Research, 145(1), pp. 35-49.
[16] Olesen,O.B., (2002) Comparing and Combining Two Approaches for Chance Constrained DEA, Dis-cussion Paper, The University of Southern Denmark.
[17] Seiford,L.M. and Zhu,J., (1999), Profitability and Marketability of the top 55 US commercial banks, Management Science, 45(9), pp. 270-1288.