Issues
ISSN: 2146-4138
available at http: www.econjournals.com
International Journal of Economics and Financial Issues, 2016, 6(S8) 60-64.
Special Issue for “Fundamental and Applied Research in Economics and Management: New Perspectives”
Interregional Inequality: A Case Study in Russia
Veronika Yu Maslikhina*
Volga State University of Technology, Yoshkar-Ola, Russian Federation. *Email: [email protected]
ABSTRACT
A dynamics analysis of interregional inequality in Russia during the period of 1994-2014 was conducted. The first Theil index, computed using the main productivity indicator of regional economy - The gross regional product per capita, was used to estimate inequality. Spatial inequality level, tendencies and structural features in Russia as a whole and in several Russian macro-regions (federal districts) were identified. The link between interregional inequality in Russia and economic growth was identified. Sharp polarization reasons of the Russian regional space were defined. State regional policy measures to mitigate interregional inequality were analyzed.
Keywords: Interregional Inequality, Region, Russia
JEL Classifications: D63, O52, R1, R58
1. INTRODUCTION
The development of spatial social and economic systems cannot be uniform, for this reason, there is an interregional inequality. There are many factors that influence the creation of spatial inequality: Geographical, natural, economic, socio-cultural, institutional and others. Interregional inequality in Russia is particularly high. Extremely high level of spatial inequality can have a negative impact on regional economic development, provoke social and national conflicts. The authorities should implement a well-considered state regional policy to mitigate interregional differentiation based on empirical studies of spatial inequality in Russia and evaluation of inequality consequences for the development of certain regions.
In recent years the problem of interregional inequality was discussed by many Russian scientists (Baranov and Skuf’ina, 2005; Goosev, 2010; Zubarevich and Safronov, 2011; Gluschenko, 2011; Nikolaev and Tochilkina, 2011; Moroshkina, 2014; Zubarevich, 2015; Kolomak, 2013; 2015).
The purpose of the study is to analyze the scale and structure of interregional inequality in Russia during the period of 1994-2014. Objectives: (1) Dynamics analysis of interregional inequality in Russia; (2) identification of specific features and structure of interregional inequality; (3) link assessment between interregional
differentiation and economic growth; (4) analysis of the state regional policy measures.
2. DATA AND RESEARCH METHODS
Gross regional product (GRP) per capita was used as summarized characteristic of the regional social and economic development.
Inequality metrics should have five properties:
1. Scale independence. The inequality measure will remain invariable at uniform proportional changes of all values of
the studied trait
2. Population independence. In case of an even change of the population size, inequality metric remains unchanged 3. Symmetry. If two regions exchange their income, inequality
metric remains invariant
4. Pigou-Dalton transfer principle. In case of income redistribution from rich regions to the poor, the inequality
decreases
5. Decomposability. Overall inequality is composed of inequality within individual groups of regions and inter-group inequality.
The first Theil index (Theil, 1967) as a measure of interregional inequality is the most suitable for research purposes. The first Theil index has five inequality axioms: Scale and population independence, symmetry, Pigou-Dalton transfer principle, decomposability. In addition, the first Theil index has a decomposability property (Bourguignon, 1979; Shorrocks, 1980), while the majority of other measuring tools of inequality do not have it. Decomposability of inequality allows us to analyze not only its scale, but also perform a structural analysis of inequality. To ensure the comparability the first Theil index is taken by the GRP and weighted by the share of the region’s population in the total population of Russia (Equation 1).
I y y y p y p
T i i
N i i
= =
∑
1 ln(1)
Where, IT is the first Theil index;
N is number of the regions;
yi is GRP of the ith region;
y is gross domestic product (GDP) of the country;
pi is population of the ith region; p is population of the country.
The first Theil index values are nonnegative; a Theil index of 0 indicates perfect equality. Decomposability of overall inequality into inequality between federal districts and inequality within federal districts allows us to research spatial structure of interregional inequality (Equations 2 and 3)
I T T y
y ln y p y p y y T
T B W i i
N i i i
i i = + = + =
∑
1∑
== 1 N (2) T y y y p y p i ij i j M ij ij i i = =
∑
ln 1 (3)Where, IT is the first Theil index;
TB is the inter-group inequality index;
TW is weighted average of intra-group inequality indices;
N is the number of federal districts;
Ti is intra-group Theil index for ith federal district; M is the number of the regions in the ith federal district; yij is GRP of the jth region of the ith federal district;
Yi yij
j M
= =
∑
1 is total gross product of the ith federal district;y is GDP of the country;
pij is the population of the jth region of the ith federal district; pi is the population of the ith federal district;
p is the population of the country.
The information basis of the research constituted the statistical data of the Federal State Statistics Service of the Russian Federation (RF) (Rosstat) for the period of 1994-2014 (Regions of Russia. Social and Economic Indicators, 2002; 2005; 2010; 2015). Until 2005, the inequality metrics were calculated without the Chechen Republic as the statistics on this subject of the RF were kept only since 2005. Since 2011, 3 Autonomous Areas of the Tyumen Region (Khanty-Mansi Autonomous Area-Yugra, Yamal-Nenets Autonomous Area) and the Arkhangelsk Region (Nenets Autonomous Area) were separately included in the calculations. The analysis includes 83 Russian subjects of the eight federal districts. Since the statistics on the Republic of Crimea and the city of Sevastopol were only available for the last year of the researched period, these regions were omitted from the analysis.
Correlation analysis was used to assess link between interregional inequality and economic growth.
3. RESEARCH RESULTS INTERPRETATION
AND ITS ANALYSIS
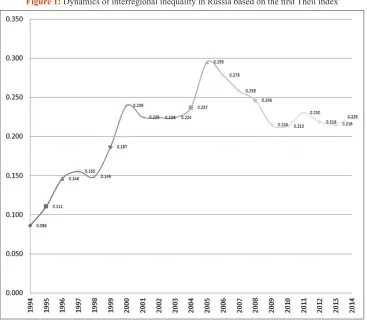
Divergence of regions with its insignificant decrease after 2005 can be observed in Russia throughout the researched period (Figure 1). Diagram of interregional inequality in Russia is similar to a Williamson’s inverted U-shaped curve of interregional inequality. According to Williamson’s findings, at the beginning of the development the regional disparity increases in process of economic growth, then, when national income reaches a certain level, disparity starts to decline (Williamson, 1965). In the case of Russia divergence particularly increased during the period of rapid economic growth in the mid-2000s and a favorable situation of world prices for
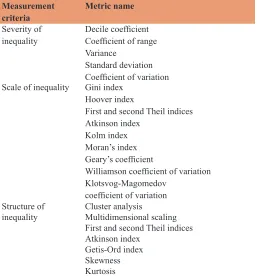
Table 1: Metrics and measurement methods of interregional inequality
Measurement
criteria Metric name Severity of
inequality Decile coefficientCoefficient of range
Variance
Standard deviation Coefficient of variation Scale of inequality Gini index
Hoover index
First and second Theil indices Atkinson index
Kolm index Moran’s index Geary’s coefficient
Williamson coefficient of variation Klotsvog-Magomedov
coefficient of variation Structure of
inequality Cluster analysisMultidimensional scaling First and second Theil indices Atkinson index
energy sources. During the 2000s rich oil and gas production regions increased the gap in the development levels of regional economies, while other regions developed more slowly and showed only moderate growth. South Russian national republics during this period had extremely low indices of the regional development and remained stagnant, especially the Republic of Ingushetia and the Chechen Republic. Official statistics on the Chechen Republic has appeared after 2005. There are three poles of an inequality in Russia: The richest regions (Moscow City, Khanty-Mansi Autonomous Area-Yugra, Yamal-Nenets Autonomous Area, Nenets Autonomous Area, Sakhalin Region, Chukotka Autonomous Area), the poorest South Russian national republics and the most numerous group of the remaining average regions. The contribution of the rich regions group in overall inequality in different years of the researched period constituted from 55% to 75% (Maslikhina, 2015). Interregional inequality in the third group of regions is low and is at the level of Western European countries. This indicates that the majority of the country regions develop more evenly.
The crisis of 2008 was marked by the fall of the main regional indicators, slowing of economic growth and weakening of interregional inequality. Dependence between the first Theil index, that characterizes interregional inequality, and the physical volume index of Russian GDP, that characterizes economic growth, is high; the correlation coefficient between these two indicators is 0.79. All this suggests that the main factor that increases inequality is rapid economic growth. Accordingly, a small convergence of regions observed after 2005 is caused by the slowing of economic growth and crisis.
Analysis of the spatial structure of interregional inequality has revealed three clusters of federal districts with similar level and dynamics of inequality (Figure 2). The first cluster includes Ural Federal District (6 RF subjects) and Central Federal District (18 RF subjects) with the highest level of inequality. Curve shape of inequality resembles the curve shape of overall interregional inequality in Russia: It increases before 2005 and decreases slightly after. In the Central Federal District interregional inequality is formed due to the city of Moscow. Due to the city’s status of the capital and the agglomeration effect, Moscow has incomparably high GRP per capita in comparison with the other regions of the district. Interregional gap in the Ural Federal District is due to the high indicators level of the 2 oil-and-gas producing autonomous areas: Khanty-Mansi Autonomous Area-Yugra, Yamal-Nenets Autonomous Area. The second cluster includes Far Eastern Federal District (6 RF subjects) - the only macroregion that shows growing divergence of regions throughout the researched period and the average inequality level. In this district the gap is created by the oil-and-gas producing Sakhalin Region and Chukotka Autonomous Area: In recent years they have the highest GRP in the district. The third cluster includes other five federal districts with 50 RF subjects (Northwestern, Volga, Southern, North Caucasian, Siberian Federal Districts): They have a relatively stable low level of spatial inequality and inequality declining trend. The lowest level of interregional inequality in the third cluster is recorded in the agricultural low developed Southern Federal District (6 RF subjects without the city of Sevastopol and the Republic of Crimea) and the North Caucasian Federal District (7 RF subjects): During the whole researched period in the Southern Federal District and after the crisis of 2008 in the North Caucasian Federal District.
Volga Federal District has the highest level of interregional inequality in the third cluster.
Specific weight of inequality between federal districts in overall inequality has declined during the whole researched period from 44% to 31% (Figure 3). Inequality between federal districts is growing more slowly than a weighted average inequality within federal districts. Since 2005, the overall structure of inequality has been stabilizing: About 30% of the spatial inequality accounts for the inequality between federal districts.
Unfortunately, the mitigation of interregional inequality in Russia, observed in recent years, is more due to the crisis phenomena in economy than the effective state regional policy. At the same time, the world has accumulated experience in the successful solution of the uneven regional development problem, for example in the European Union (EU) countries. More than 30% of the EU budget is allocated to reduce the spatial, economic and social inequality (Eurostat Regional Yearbook, 2014).
In the EU, in relation to the regions that are part of NUTS 2, a unified regional policy with a certain level of financial support of the regions is developed. By 2020, in order to equalize the regional development and accelerate growth of weak regions, the total EU investments amount should reach 351 billion euros. The investments amount is determined by three levels gradation of the regional development:
• For the poorly developed regions (gross product per capita is <75% of the EU average);
• For the transition regions (gross product per capita is in the range of 75-90% of the EU average);
• For the more developed regions (gross product per capita >90% of the EU average).
Several EU regional policy elements can be used in the practice of the regional administration in Russia.
The main objectives of the state regional policy of Russia are defined in the concept of long-term socio-economic development of Russia until 2020. “State regional policy is aimed towards ensuring balanced socio-economic development of the RF subjects, the reduction in interregional differentiation in socio-economic status of the regions and the quality of life.”
Thus, there are several mechanisms for implementing state regional policy aimed at decreasing interregional differentiation in Russia. Budget leveling and “polarized” development play the most important roles. Unfortunately, leveling budgeting for the regions has not led to the expected leveling of the social and economic development of the RF subjects. Leading regions lose the development motivation; depressed regions are not stimulated to expand the revenue base. “Polarized” development implies the concentration of resources in the “development centers” and the distribution of investment and innovative activity on the nearby territories. Territorial extension of Russia and weak infrastructure are obstacles for the involvement of depressed regions in the influence area of “growth poles.”
Central Federal District Northwestern Federal District Southern Federal District North Caucasian Federal District Volga Federal District Ural Federal District Siberian Federal District Far Eastern Federal District
Figure 2: Interregional inequality in the Federal Districts
According to another document “The main activities of the RF Government for the period until 2018,” it is clear that an approach based on the support of regional growth poles prevails in the state regional policy. This could include key directions of regional policy such as accelerated development of agglomerations, development of special economic zones and priority development area, accelerated development of the Far East, the South of Russia, the Kaliningrad Oblast, the Republic of Crimea, the city of Sevastopol, and the Arctic region.
4. CONCLUSION
Divergence of regions with its insignificant decrease after 2005 can be observed in Russia. The level of spatial inequalities in Russia is high. Economic growth determines the level of interregional inequality: Inequality increases during the periods of rapid economic growth and decreases during stagnation. Several richest regions (Moscow City, Khanty-Mansi Autonomous Area-Yugra, Yamal-Nenets Autonomous Area, Nenets Autonomous Area, Sakhalin Region, Chukotka Autonomous Area) and several poorest regions (the Chechen Republic and the Republic of Ingushetia) create the polarization of the RF regions. The majority of the Russian regional space has the level of interregional inequality comparable to the developed countries.
Central and Ural Federal Districts have high level of inequality, generally repeating the all-Russian tendency. Far Eastern Federal District has the average level of inequality with strongly expressed divergence. Northwestern, Volga, Southern, North Caucasian, Siberian Federal Districts have a relatively low and stable level of interregional inequality. Inequality between federal districts grew more slowly than inequality within federal districts.
Regional policy of the RF to mitigate interregional differentiation cannot be called successful. In recent years, the principle of polarized development is used to mitigate interregional disparity.
5. ACKNOWLEDGMENTS
The research is conducted with the financial support from the Russian Foundation for Humanities in the frames of the scientific and research project No. 16-02-50130 “Spatial inter-regional socio-economic inequality in Russia.”
REFERENCES
Baranov, S., Skuf'ina, T. (2005), Analysis of inter-regional differentiation and the construction of rankings of the Russian Federation subjects. Voprosy Ekonomiki, 8, 54-75.
Bourguignon, F. (1979), Decomposable income inequality measures. Econometrica, 47(4), 901-920.
Eurostat. (2014), Eurostat Regional Yearbook. Luxembourg: Publications Office of the European Union.
Gluschenko, K. (2011), Studies on income inequality among Russian regions. Regional Research of Russia, 1(4), 319-330.
Goosev, A. (2010), Optimal levels of economic inequalities in federal districts. Society and Economy, 12, 52-84.
Kolomak, E. (2013), Uneven spatial development in Russia: Explanations of new economic geography. Voprosy Ekonomiki, 2, 132-150.
Kolomak, E. (2015), Evolution of spatial distribution of economic activity in Russia. Regional Research of Russia, 5(3), 236-242.
Maslikhina, V. (2015), Interregional inequality in Russia: Empirical analysis. Actual Problems of Economics, 3(165), 260-265. Moroshkina, M. (2014), Trans-regional differentiation of subjects of
the Russian Federation. Economic Analysis: Theory and Practice, 45(396), 20-28.
Nikolaev, I., Tochilkina, O. (2011), Economic differentiation of regions: Estimations, dynamics, comparisons (Russia and other countries). Society and Economy, 10, 23-49.
RosStat. (2002), Regions of Russia: Social and Economic Indicators. Moscow: RosStat.
RosStat. (2005), Regions of Russia: Social and Economic Indicators. Moscow: RosStat.
RosStat. (2010), Regions of Russia: Social and Economic Indicators. Moscow: RosStat.
RosStat. (2015), Regions of Russia: Social and Economic Indicators. Moscow: RosStat.
Shorrocks, A. (1980), The class of additively decomposable inequality measures. Econometrics, 48(3), 613-625.
Theil, H. (1967), Economics and Information Theory. Amsterdam: North-Holland.
Williamson, J. (1965), Regional inequality and the process of national development: A description of patterns. Economic Development and Cultural Change, 13, 3-45.
Zubarevich, N. (2015), Regional inequality and potential for modernization. The Challenges for Russia’s Politicized Economic System. Oxford: Routledge. p182-201.