© 2015 Girish S. Sonar and Swati Rawat. This is an open access article distributed under the terms of the Creative Commons Attribution License -NonCommercial-ShareAlikeUnported License (http://creativecommons.org/licenses/by-nc-sa/3.0/).
Journal of Applied Pharmaceutical Science Vol. 5 (10), pp. 091-100, October, 2015 Available online at http://www.japsonline.com
DOI: 10.7324/JAPS.2015.501016 ISSN 2231-3354
Formulation and Design of Multiunit Particulate System (MUPS)
Tablet of Pantoprazole by QbD: Effect of Compression Variables on
the Finished Product
Girish S. Sonar
1*, Swati Rawat
21
Department of Pharmacy, JJT University, Jhunjhunu, Rajasthan, India.
2 Department of Pharmaceutics, SND College of Pharmacy, Nasik, Maharashtra State, India.
ARTICLE INFO ABSTRACT
Article history:
Received on: 19/07/2015 Revised on: 17/08/2015 Accepted on: 22/09/2015 Available online: 28/10/2015
The aim of the study was to optimize compression process variables of Pantoprazole oro-dispersible (Multiunit particulate system) MUPS tablet. Enteric coated Pantoprazole pellets were compressed to oro-dispersible tablet for geriatric and pediatric patients for easy administration. The risk related to compression process variables was identify, assessed and mitigated using Failure Mode and Effect Analysis (FMEA). A full factorial design was applied to develop design space and determine control strategy for compression process, which were developed, have promising chemical and physical results. The compression process variables studied were pre -compression force (X1), main compression force (X2) and turret speed (X3), versus affecting hardness (Y1), disintegration time (Y2), friability (Y3), weight variation (Y4), content uniformity (Y5), drug release in 0.1N HCl (Y6) and assay (Y7) as responses/Critical quality attributes (CQAs). Response surface graphs depicted that X2 had more impact on CQAs than X1. Design space plot revealed that tablet CQAs were within limit when X3 maximum 44 rpm and X2 in the range of 10 to 12.5 kN. Scale up performed on commercial scale compression machine of same make that of lab scale showed reproducible physical and chemical parameters. It could be concluded that a quality Pantoprazole oro-dispersible MUPS tablet was successfully designed using QbD approach to compression process variables.
Key words:
MUPS, Compression process, Compression force, Design space, FMEA, Control Strategy
INTRODUCTION
Nowadays, there has been an increasing interest in the development of multiparticulate dosage form in the form of tablets rather than hard gelatin capsules. There are some advantages of multiunit particulate system (MUPS) tablets over
capsule form like tamper-proof dosage form, better
microbiological and physicochemical stability, prepared at low cost & more output (Celik, 1994; Sirisha et al., 2012), reduction of irritation of the gastric mucosa due to drug degradation of simple units (Abdul et al., 2010; Bhad et al., 2010) and divided in to desired dose strengths without formulation changes (Deb et al., 2013). The compression of MUPS tablet is a challenging
.
* Corresponding Author
Girish S Sonar, JJT University, Department of Pharmaceutics, Jhunjhunu - 333 001, Rajasthan, India.
Email: [email protected]
Pantoprazole is highly prescribed proton pump inhibitor administer before intake of food (Peura et al., 2011; Hatlebakk et al., 2000). Here attempt was to develop oro-dispersible tablet acceptable for geriatric and pediatric patients. However maintain the oro-dispersible properties of tablets like disintegration time less than 30 sec, gritty free mouth feel and pleasant taste were the challenges.
The systematic study of compression process parameter were performed based on Quality by Design (QbD) for ideal oro-dispersible MUPS tablet. From last few years, QbD concept introduced by regulatory authorities for systematic presentation of research. The elements of QbD are quality target product profile (QTPP), critical quality attributes (CQAs), identification of critical material attributes (CMAs), and critical process parameters (CPP), risk assessment, risk mitigation, design space (DS) and control strategy (CS) (ICH Q8, 2009; ICH Q9, 2005; ICHQ10, 2008). In this study, risk management performed using Failure Mode and Effect Analysis (FMEA) tool for compression process.
The aim of this study was 1) to identify critical compression process variables, 2) optimization of compression process variables, 3) developed the design space and determination of control strategy and 4) scale up of compression process of Pantoprazole MUPS tablets.
MATERIALS
Pantoprazole sodium sesquihydrate was gifted from Hetero drugs, India. Microcrystalline cellulose (Ceolus® KG 1000, Asahi Kasei, Japan), Microcrystalline cellulose (Avicel® PH 200, FMC Biopolymer, Germany), Mannitol (Pearlitol® DC 400, Pearlitol® Flash, Roquette, France), Crospovidone (Kollidon CL-SF, BASF, Germany), Strawberry flavour (International Flavours and Fragrances, USA), Neotame (The Nutrasweet Company, Augusta), Colloidal Silicon Dioxide (Aerosil® 200 Pharma, Evonik, Germany), Magnesium stearate (Nitika, India) were used in trials.
METHODS
Preparation of lubricated blend
Sift all extragranular excipients through 40 mesh sieve (Table 1). Co-sift Pantoprazole enteric-cushion coated pellets with Ceolus through 30 mesh sieves, labeled as co-sift I. Co-sift crospovidone, flavour and neotame through 40 mesh sieves, labeled as co-sift II. Co-sift Aerosil with 1/4th quantity of Pearlitol DC 400 through 40 mesh sieves, labeled as co-sift III. Add pre-sifted Avicel PH 200 followed by co-sift I, co-sift II, co-sift III, pre-sifted Pearlitol flash and remaining Pearlitol DC 400 in double cone blender.
Blended for 300 revolutions, and add sifted magnesium stearate and lubricate for 50 revolutions. Blend samples (1X to 3X of tablet weight) were collected from 10 different positions from the blender and performed blend uniformity test. When relative standard deviation of blend uniformity found less than 5% then it
was considered adequate mixing of blend and unloaded the blend in double polybag.
Table 1: Pantoprazole MUPS tablet formulation.
Ingredients mg/tab
Pantoprazole enteric-cushion coated pellets Ceolus KG-1000
Pearlitol Flash Avicel PH 200 Pearlitol DC 400 Crospovidone Neotame Strawberry flavour Aerosil 200 Magnesium stearate
263.6 13.2 132.4 132.4 132.4 60.25 3.77 7.53 3.77 3.77
Tabletting
Tablets were compressed using Fette 102i (for development trials) and Fette P2020 (for scale up) tablet press by main compression force applied 8.0-17.0 kN, 2.0-4.5 kN of pre-compression force, 25-30 rpm of turret speed and 20-45 rpm of feeder speed at 753.1mg of standard tablet weight. Flat faced beveled edge punch tooling of 12.5 mm diameter was used. The circular rod were used in force feed instead of square shaped to uniform filling of die and avoid of crushing of pellets during compression. The prepared tablets were stored in tightly packed double polybag to protect from environmental exposure.
Tablet characterization
During compression, check the tablet in process parameters like hardness, thickness, friability, disintegration time, weight variation.
Assay
Assay test of tablets (n=2) were performed as per Pantoprazole Sodium Delayed-Release Tablets USP monograph (USP37-NF32).
Dissolution studies
Dissolution studies were carried out in two stages. Dissolution in acidic condition i.e., simulated stomach condition was performed in USP apparatus II, dissolution medium used was 1000 ml of 0.1 N hydrochloric acid at a speed 75 rpm and temperature 37±0.5 oC for 120 min followed by dissolution in simulated intestinal condition using USP apparatus II, dissolution medium used was 1000 ml of phosphate buffer pH 6.8 at a speed 75 rpm and temperature 37±0.5 oC for 30 min (n=6).
Content uniformity
Tablet samples were collected during compression and assay of 10 individual tablet were performed as per tablet assay method. Calculated the acceptance value (AV) of 10 tablets.
Weight variation
Hardness
Tablet hardness was measured from the force required to fracture tablets by diametrical compression using a tablet hardness Tester (Erweka TBH200, Germany). Mean hardness of 5 tablets from each formulation was observed and reported as tablet hardness (n=5).
Disintegration test
Disintegration time is the time required for tablet to disintegrate completely without leaving any solid residue. In vitro
disintegration time for oro-dispersible tablet (ODT) was evaluated
using USP General Chapter (USP37-NF32, 2014). A
disintegration tester (EF-2W, Electrolab, India) was used in this study as a disintegration apparatus and distilled water (800 ml) as disintegration medium (n = 6).
Friability
Friability of tablets was determined using Friabilator (Electrolab, India). Ten tablets were subjected to the combined effect of abrasions and shock in a friabilator at 25 rpm and dropping. Study repeated three times for each formulation (n=3). The percent friability was then calculated by,
Percent Friability = (W-Wo/W) x 100
Where, Wo is the weight of the tablets before the test and W is the weight of the tablet after the test.
Splitability
Splitability test performed for scored tablets to ensure each split part has same characteristics like whole tablet.
As per USFDA guidance, splitability test involved sub tests - 1) loss of mass on 15 tablets and friability at both ends of the proposed hardness range, 2) Content uniformity, dissolution and stability of split tablet parts (USFDA guidance, 2013).
Scanning electron microscopy
The split tablet was placed onto a double-sided carbon tape mounted on studs and sputter-coated (JFC-1100, Jeol, Tokyo, Japan) with gold. Photomicrographs of gold coated enteric coated pellets were obtained using a scanning electron microscope (SEM; Phenom, Netherlands). The SEM photomicrographs of different enteric coated pellets are shown in Fig. 5.
Preliminary trials
The preliminary compression trials were conducted to understand the impact of compression process variables on tablet quality and identify the critical compression variables.
During trials, main compression force varied from 10-20 kN, pre-compression force varied from 2-6 kN, turret speed varied from 20 to 80 rpm and feeder speed varied from 30 to 150 rpm. The results of preliminary trials used to design the experiment for systematic study of critical variables.
Initial risk assessment
In the preliminary trials, all possible compression process variables varied in possible ranges. The results of trials used to define the initial risk assessment of compression process. The risk assessment performed using FMEA tool. The risk of each failure is prioritized based on the risk priority number (RPN). RPN is a decision factor based on three ratings: Severity (S), Occurrence (O) and Detection (D). These ratings are scaled with numbers between 1 and 10 (Stamatis, 2003). Risk Priority Number, which is the product of the severity, occurrence and detection ratings is calculated as RPN = S x O x D. The RPN must be calculated for each cause of failure. RPN shows the relative likelihood of a failure mode, in that the higher number, the higher the failure mode. From RPN, a critical summary can be drawn up to highlight the areas where action is mostly needed (Masoud et al., 2011). Risk priority numbers (RPNs) were calculated as the product of Frequency, severity and detect-ability scores. Failure mode scores could range from 1 to 1000 (Mohammad HY et al., 2014). We ranked S, O and P of 1-3 as best-case value, 4-7 as moderate-case value and 8-10 as worst-case value, and then a maximum RPN of 1000 and a minimum RPN of 1 are possible. The variables ranked based on RPN value. The RPN threshold below 60 ranked low risk, 60-80 ranked medium risk and above 80 ranked high risk process variables (Fig. 3). The variables ranked as high risk i.e. pre-compression force, main compression force and turret speed were evaluated by conducting DoE studies to gain process understanding and remaining kept constant. Potential risks are evaluated by subsequent formulation variable studies since it possibly has a potential impact on CQAs and in consequence on product safety and efficacy, while factors with a lower RPN can be eliminated from further study (Vogt et al., 2011; IEC, 2006).
Identification of CQAs
The CQAs were divided in to intermediate and drug product CQAs, however both has impact on tablet quality. Weight variation, hardness, disintegration time, friability and split-ability were the intermediated CQAs while assay, content uniformity and drug release in 0.1N HCl were the drug product CQAs. Hardness, disintegration time and friability were the interdependent parameters on each others. If hardness increased, disintegration time increased, and friability decreased and when hardness decreased, disintegration time decreased, and friability increased. All physical parameters should be in suitable limit for ideal oro-dispersible properties of tablet. Weight variation occurred due to size and density variation of lubricated blend components and turret speed. Weight variation out of limit leads to tablets failed in content uniformity. The particle size distribution of extragranular excipients were selected similar to pellets. Assay is the best test to indentify the content of active in tablet. Due to suboptimal main compression force, pellets got cleaved during compression and increased the release in 0.1N HCl. Since PTZ MUPS was enteric coated MUPS tablet, drug release in acidic medium should not more than 10%.
Experimental design
A 23 design was used to explore the quadratic response surfaces and for constructing a second-order polynomial models using Design Expert (Version 8.1.6; Stat-Ease Inc., Minneapolis, Minnesota). A design matrix comprising 10 experimental runs including 2 center point experiments was constructed.
The response (Yi) in each trial was measured by carrying
out a multiple factorial regression analysis using the quadratic model:
Yi = b0 + b1X1 + b2X2 + b3X3 + b4X1X2 + b5X1X3 + b6X2X3 + b7X1 2
+ b8X2 2
+ b9X3 2
Where Yi is the dependent variable; b0 is the arithmetic mean
response of all trials; and bi is the estimated coefficient for factor
Xi. The main effects, X1, X2, and X3, represent the average value
of changing factor one at a time; X1X2, X1X3, and X2X3 represent
the interaction terms and the polynomial terms (X1 2
, X2 2
and X3 2
) are used to assess nonlinearity (Nagarwal et al., 2009).
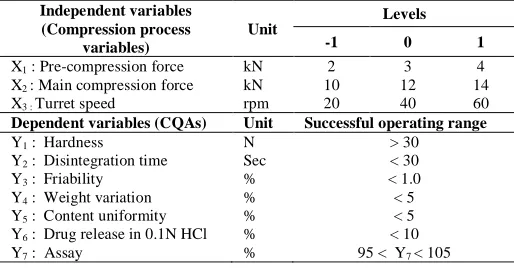
The independent variables selected were the pre-compression force (X1), main compression force (X2) and turret
speed (X3). The dependent variables were hardness (Y1),
disintegration time (Y2), friability (Y3), weight variation (Y4),
content uniformity (Y5), drug release in 0.1N HCl at 120min (Y6)
and assay (Y7). The concentration range of independent variables
under study is shown in Table 2 along with their low, medium, and high levels, which were selected based on the results from preliminary experimentation. The respective observed responses are given in Table 3.
Table 2: 23 Full factorial design matrix and successful operating range.
Development of design space and determination of control strategy for compression process
The multidimensional combination and interaction of independent variables, that have been demonstrated to provide assurance of quality, is termed as the design space (Yu , 2008). DS could be determined from the common region of successful operating ranges for the two responses. It is expected that operation within the design space will result in a product possessing the desired CQAs. Here DS was created for pre-compression and main pre-compression variables keeping turret speed constant. There are basic difference between process validation (PV) and DS that PV demonstrates consistency of the process at normal operating ranges while design space verification
demonstrates that scale effect and or model assumptions are under control in the new area of design space and do not affect product quality. Unlike validation which covers all the steps of the manufacturing process, verification studies refer only to those operations where a design space has been proposed. A control strategy is designed to ensure that a product of required quality will be produced consistently (ICH Q8, 2009). The acceptable range of material attributes were determined based on DS.
Scale up of compression process
The compression of lab scale trials and optimized compression process variables batch performed on Fette 102i compression machine. Fette 102i and Fette P2020 has same capacity of load cells and compression process parameters were scale independent which was suggested by machine vendor and proved in studies of earlier products. Hence, scale up batch ran on Fette P2020 based on optimized compression process parameters from Fette 102i to study the impact on tablet quality.
RESULT AND DISCUSSION
Preliminary trials evaluation
The extragranular excipients contained Pearlitol Flash, Avicel PH 200 and Pearlitol DC 400 had good compressibility and enough moisture content to improve tablet compactability and strength hence table hardness improved and reduced the tablet friability. The loss on drying (LOD) of lubricated blend was found 1.25% w/w at 105°C. The pre-compression force, main compression force, turret speed and feeder speed were varied at possible levels while other variables prescribed in Fig. 3 kept constant. The main compression force has effect on tablet hardness, disintegration time, friability and drug release in acidic medium, same in case of pre-compression force. Main compression force above 15 kN and pre-compression force above 6 kN, tablets physical and chemical parameters failed. At turret speed above 60 rpm, severe weight variation was observed. Feeder speed when 0.8 to 1.5 times of turret speed and turret speed less than 60 rpm, tablet weight variation and content uniformity found satisfactory. Feeder speed decided to keep constant at 1 to 1.5 times of turret speed and pre-compression force, main compression force and turret speed selected for design of experiments.
Design of experiments
The results (Table 3) showed that the hardness varied from 35±2.30 to 48±1.50N, disintegration time from 10±1.14 to 25±1.28 Sec, friability from 0.15±0.021 to 0.55±0.020%, weight variation from 0.91±0.17 to 3.52±0.20%, content uniformity from 1.2±0.15 to 8.2±0.22%, drug release in acidic media varied from 2±0.44 to 14±1.09% and assay from 97.9±0.18 to 99.8±0.14%.
The wide variation in the drug release in acid media and friability values for different formulations and the high degree of reproducibility (Table 3) suggested that these responses are strongly dependent on the selected independent factors.
Independent variables (Compression process
variables)
Unit
Levels
-1 0 1
X1 : Pre-compression force kN 2 3 4
X2 : Main compression force kN 10 12 14
X3 : Turret speed rpm 20 40 60
Dependent variables (CQAs) Unit Successful operating range
Y1 : Hardness N > 30
Y2 : Disintegration time Sec < 30
Y3 : Friability % < 1.0
Y4 : Weight variation % < 5
Y5 : Content uniformity % < 5
Y6 : Drug release in 0.1N HCl % < 10
In case of hardness, disintegration time and assay, although small variations were noticed between different formulations, the results seemed to be systematic and repeatable, which may suggest dependency on the studied factors
Analysis of variance
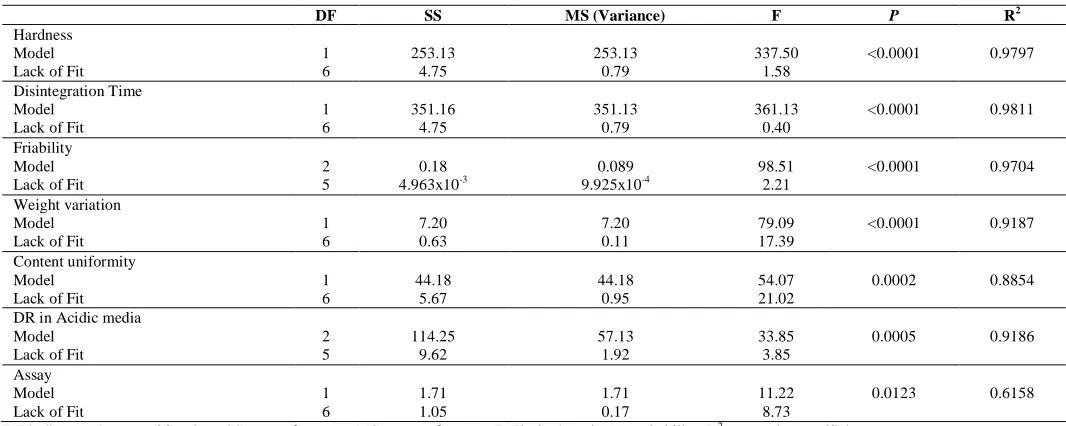
Analysis of variance (ANOVA) was performed to evaluate the significance of the quadratic models (linear, interactive and polynomial) on the responses and to estimate their quantitative effects. Table 4 summarizes the effects of the model terms and associated p-value for all five responses.
At a 95% confidence level, a model was considered significant if the p-value < 0.05. The sign and value of the quantitative effect indicate trend and magnitude of the term’s influence on the response, respectively. Positive signs indicate an increase in the response value, while negative signs demonstrate a decrease in the response value.
Response surface plot interpretation
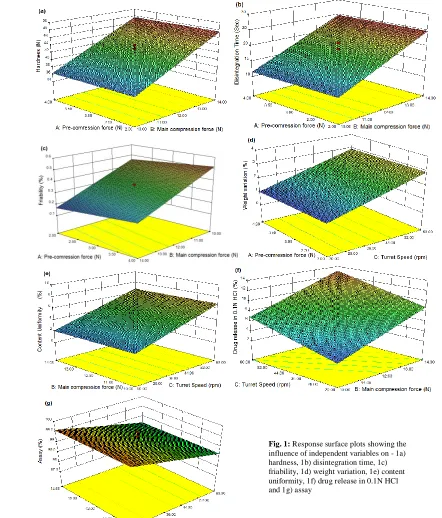
The results indicated that the hardness of tablets was significantly influenced by the main compression force (X2). Fig.
1a portray the three-dimensional surface plot indicated that when X2 increased from -1 level to +1 level, Y1 was found to increased
linearly due compaction increased linearly. The large positive coefficient (+5.63) of X2 suggested that main compression had
significantly effect on Y1 as per equation 1. This study indicated
that MUPS tablets hardness governed by main compression as same case of convectional tablets.
Disintegration time (Y2) was significantly influenced by
main compression (X2) only. Three-dimensional surface plot (Fig.
1b) indicated that when X1 increased from -1 level to +1 level, Y2
was found to increased linearly due to more compaction of blend takes time to disintegrate. The positive coefficient (+6.63) of X2
had major effected on Y2 as per equation 2. Friability (Y3) was
significantly influenced by the linear models of pre-compression
Table 3: Experimental design and results.
Trial
Independent
(Compression Process) variables* Responses (CQAs)*
X1 X2 X3
Y1 (N) Y2 (Sec) Y3 (%) Y4 (%) Y5 (%) Y6 (%) Y7 (%)
F21 -1 -1 -1 36±1.25 10±1.14 0.45±0.027 1.12±0.11 2.6±0.21 2±0.44 99.5±0.12
F22 1 -1 -1 35±2.30 11±0.98 0.51±0.016 0.91±0.17 3.5±0.19 3±0.54 99.6±0.16
F23 -1 1 -1 46±2.40 23±1.25 0.15±0.021 1.09±0.21 2.4±0.22 10±1.14 99.1±0.10
F24 1 1 -1 48±1.50 25±1.12 0.19±0.012 1.32±0.19 1.2±0.15 11±0.84 99.8±0.14
F25 -1 -1 1 37±2.05 12±1.32 0.44±0.018 2.89±0.22 6.8±0.25 8±0.71 97.9±0.18
F26 1 -1 1 36±1.85 11±1.08 0.55±0.020 2.50±0.18 7.6±0.31 9±0.89 98.8±0.21
F27 -1 1 1 47±0.95 24±1.20 0.21±0.024 3.12±0.13 5.9±0.27 12±1.14 99.1±0.15
F28 1 1 1 48±1.35 25±1.28 0.23±0.019 3.52±0.20 8.2±0.22 14±1.09 98.5±0.11
F29 0 0 0 43±2.25 19±0.95 0.34±0.018 1.52±1.11 2.9±0.28 5±0.83 99.6±0.16
F30 0 0 0 44±1.90 21±1.08 0.37±0.021 1.63±1.23 3.2±0.34 4±1.00 99.4±0.14
All values are expressed as mean ± SD
*X1 : Pre-compression force, X2 : Main compression force, X3 : Turret speed, Y1 : Hardness, Y2 : Disintegration time, Y3 : Friability, Y4 : Weight variation, Y5 : Content uniformity, Y6 : Release in 0.1N HCl (at 120 min), Y7 : Assay
Table 4: Summary of results for testing validity of the models.
DF SS MS (Variance) F P R2
Hardness Model Lack of Fit
1 6 253.13 4.75 253.13 0.79 337.50 1.58
<0.0001 0.9797
Disintegration Time Model
Lack of Fit
1 6 351.16 4.75 351.13 0.79 361.13 0.40
<0.0001 0.9811
Friability Model Lack of Fit
2 5 0.18 4.963x10⁻³ 0.089 9.925x10⁻⁴ 98.51 2.21
<0.0001 0.9704
Weight variation Model Lack of Fit
1 6 7.20 0.63 7.20 0.11 79.09 17.39
<0.0001 0.9187
Content uniformity Model
Lack of Fit
1 6 44.18 5.67 44.18 0.95 54.07 21.02
0.0002 0.8854
DR in Acidic media Model
Lack of Fit
2 5 114.25 9.62 57.13 1.92 33.85 3.85
0.0005 0.9186
Assay Model Lack of Fit
1 6 1.71 1.05 1.71 0.17 11.22 8.73
0.0123 0.6158
force (X1) and main compression force (X2). Fig. 1c portray the
three-dimensional surface plot indicated that when X2 increased
from -1 level to +1 level, Y3 was found to decreased more
compaction of pellets and hardness increased while reverse case for X1. The negative coefficient (-0.15) of X2 had major impact
followed by positive coefficient (+0.029) of X1 on Y3 as per
equation 2.
Weight variation (Y4) was significantly influenced by
turret speed (X3). Three-dimensional surface plot (Fig. 1d)
indicated that when X3 increased from -1 level to +1 level, Y4 was
found to increased linearly due to improper die filled at increased speed. The positive coefficient (+0.95) of X3 had major effected
on Y4 as per equation 4.
Content uniformity (Y5) was significantly influenced by
turret speed (X3). Three-dimensional surface plot (Fig. 1e)
indicated that when X3 increased from -1 level to +1 level, Y5 was
found to increased linearly due to improper die filled at increased speed leads to weight variation. The positive coefficient (+2.35) of X3 had major effected on Y5 as per equation 5.
Drug release in 0.1N HCl (Y6) was significantly
influenced by main compression force (X2) and turret speed (X3).
Three-dimensional surface plot (Fig. 1f) indicated that when X2
and X3 increased from -1 level to +1 level, Y6 was found to
increased linearly due more compression force cleaved the pellets and at high speed pellets ruptured in feed frame respectively. The positive coefficient (+3.13) of X2 had major effected followed by
Fig. 1: ..
Fig. 1: Response surface plots showing the
positive coefficient (+2.13) of X3 on Y6 as per equation 6. Assay
(Y7) was significantly influenced by turret speed (X3).
Three-dimensional surface plot (Fig. 1g) indicated that when X3
increased from -1 level to +1 level, Y5 was found to decreased
linearly due to improper die filled at increased speed leads to weight variation increased. The negative coefficient (-0.46) of X3
had major effected on Y7 as per equation 7.
The resulting equation for all seven responses Y1 (Hardness), Y2 (Disintegration time), Y3 (Friability), Y4 (Weight variation), Y5 (Content uniformity), Y6 (Drug release in 0.1N HCl) and Y7 (Assay) are presented below:
Y1 = +42.0 + 5.63X2 (1)
Y2 = +18.1 + 6.63X2 (2)
Y3 = +0.34 + 0.029X1 - 0.15X2 (3)
Y4 = +1.96 + 0.95X3 (4)
Y5 = +4.43 + 2.35X3 (5)
Y6 = +7.80 + 3.13X2 + 2.13X3 (6)
Y7 = +99.13 - 0.46X3 (7)
Statistical analysis for testing the validity of the models in summarized in Table 4. p-values for all the simulated responses were well below the significant level (<0.05), suggesting that all the models were significantly in predicting their response values. The correlation coefficients (R2) for all seven responses
indicated good fits to the raw data. However, lower correlation coefficients were obtained for weight variation (0.8768), content uniformity (0.8083), drug release in acidic media (0.7536) and assay (0.5483) observed due to other process variables are involved to get result of responses apart from process variables discussed in DoE study leads in big error.
Model validation study of optimized tablet compression process parameters
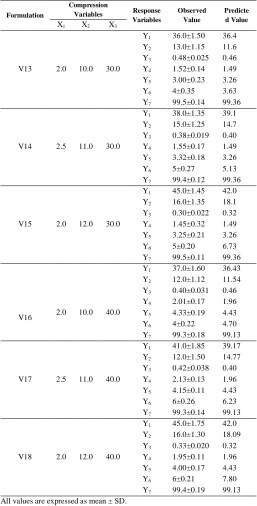
Based on the response surface plots, the software was used to perform hot spot analysis to obtain optimum compression process variables to produce PTZ MUPS tablet with desired characteristics. The request was to hardness (35-50N), disintegration time (1-20 sec), friability (0 -0.50%), weight variation (0-3%), content uniformity (0-5%), drug release in 0.1N HCl (0-10%) and assay (98-102%), to get design space. Trial V16 was selected as optimal formulation with hardness of 36N, disintegration time of 12 sec, friability of 0.46%, weight variation of 1.96%, acceptance value of 4.70, drug release in 0.1N HCl of 4.7% and assay of 99.13% will have 2.0 kN, 10.0 kN and 40 rpm of pre-compression force, main compression force and turret speed. compressed at optimum pre-compression force, main compression force and turret speed. The observed response values of the optimized compression parameters compared with the predicted values are presented in Table 5. The linear correlation plots drawn between the predicted and the observed values demonstrated higher of r2 for hardness (r2=0.9197), weight variation (r2=0.949) and content uniformity (r2=0.927). Disintegration time and friability test were physical tests and low magnitude of error during test significantly affect r2, hence r2
values found less than 0.6816 and 0.7738 respectively. There was additional variables impacting the drug release in 0.1N HCl and assay results other than variables considered in this study hence small change in that variables leads to big error reflected in r2 values, 0.7149 and 0.6667 respectively. Thus, the validity of the model was established and the compression process variables were robust within the control space.
Table 5: Model validation of tablet compression process variables.
Formulation
Compression
Variables Response Variables
Observed Value
Predicte d Value
X1 X2 X3
V13 2.0 10.0 30.0
Y1 36.0±1.50 36.4 Y2 13.0±1.15 11.6 Y3 0.48±0.025 0.46 Y4 1.52±0.14 1.49 Y5 3.00±0.23 3.26
Y6 4±0.35 3.63
Y7 99.5±0.14 99.36
V14 2.5 11.0 30.0
Y1 38.0±1.35 39.1 Y2 15.0±1.25 14.7 Y3 0.38±0.019 0.40 Y4 1.55±0.17 1.49 Y5 3.32±0.18 3.26
Y6 5±0.27 5.13
Y7 99.4±0.12 99.36
V15 2.0 12.0 30.0
Y1 45.0±1.45 42.0 Y2 16.0±1.35 18.1 Y3 0.30±0.022 0.32 Y4 1.45±0.32 1.49 Y5 3.25±0.21 3.26
Y6 5±0.20 6.73
Y7 99.5±0.11 99.36
V16 2.0 10.0 40.0
Y1 37.0±1.60 36.43 Y2 12.0±1.12 11.54 Y3 0.40±0.031 0.46 Y4 2.01±0.17 1.96 Y5 4.33±0.19 4.43
Y6 4±0.22 4.70
Y7 99.3±0.18 99.13
V17 2.5 11.0 40.0
Y1 41.0±1.85 39.17 Y2 12.0±1.50 14.77 Y3 0.42±0.038 0.40 Y4 2.13±0.13 1.96 Y5 4.15±0.11 4.43
Y6 6±0.26 6.23
Y7 99.3±0.14 99.13
V18 2.0 12.0 40.0
Y1 45.0±1.75 42.0 Y2 16.0±1.30 18.09 Y3 0.33±0.020 0.32 Y4 1.95±0.11 1.96 Y5 4.00±0.17 4.43
Y6 6±0.21 7.80
Y7 99.4±0.19 99.13 All values are expressed as mean ± SD.
Splitability test
ends of tablet hardness, tablet passed loss of mass and friability test however showed same drug release that of whole tablets due no damaged of pellets during splitting and good content uniformity. The PTZ MUPS tablet successfully passed the splitability test to deliver 20mg of Pantoprazole dose.
Table 6: Splitability test results.
Parameters Split tablet
Loss of mass
a) at low hardness (%) b) at high hardness (%)
1.42±0.10 1.35±0.09 Friability
a) at low hardness (%) b) at high hardness (%)
0.63±0.015 0.45±0.018 Content uniformity
AV 1.16±0.12
Dissolution in 0.1N HCl (%) 6±0.95
Dissolution in pH 6.8 (%) 75±0.55
All values are expressed as mean ± SD
Development of design space
Experimental validation of DoE trials was undertaken by fabrication of optimized process variables. The optimization studies performed with all possible ranges of compression process
variables combination to get response with in desire limits. Preliminary batch targeted for disintegration time less than 30 sec however during stability study disintegration time increased by 8 to 10 sec. To avoid this, disintegration time targeted to less than 20 seconds.
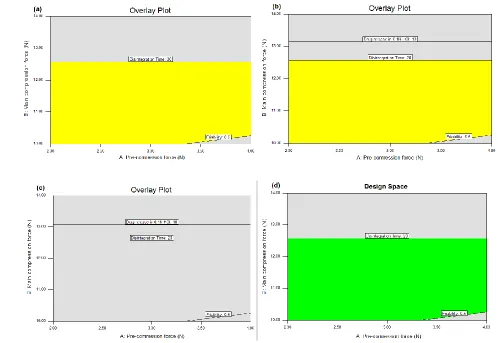
For optimized process variables, levels of factors which provided hardness (Y1) in 35-50 N range, disintegration time (Y2)
in 0-20 sec range, friability (Y3) in 0-0.5% range, weight variation
(Y4) in 0-3% range, content uniformity (Y5) in 0-5% range, drug
release in 0.1N HCl (Y6) in 0-10% range and assay (Y7) in
98-102% range were screened. Fig. 2a,b and c shows the overlay plot for turret speed of 20 rpm, 44 rpm and 45 rpm respectively kept constant. Turret speed above 45 rpm, no design space was created hence 44 rpm of turret considered as higher speed.
The DS was established which was delineated in the green region in Fig. 2d, the range of the independent variable was, pre-compression force, main compression force and turret speed of the point inside the green region. Based on the preliminary trials, levels of pre-compression and main compression be in the certain range to ensure that the production was performed favorably. Working range for turret speed found 20 to 44% got from design space.
Fig. 2: Overlay plot to compression process comprised of the overlap region of ranges for the three CQAs - 2a) 20 rpm of turret speed, 2b) 44 rpm of turret
Updated risk assessment
Following completion of process development studies, a greater understanding of the risks to tablet physical and chemical parameters associated with coating process been developed in DS which covered all validated range of compression process variables. Risk associated with process variables and mitigated discussed in Fig. 3 (Pareto chart) based on validated design model and optimization study results. Using FMEA, the modes of failure can be prioritized for risk management purposes according to the seriousness of their consequences (effects), it can also be used to predict how frequently they occur and how easily they can be detected (Bogner et al., 2012).
Control strategy for pantoprazole oro-dispersible MUPS tablets compression process variables
For ensuring a product of required quality of robustness and consistency during producing, ICH Q10 defines the control strategy as “a planned set of controls, derived from the understanding of current product and process that assures process performance and product quality”(ICH Q10, 2008).
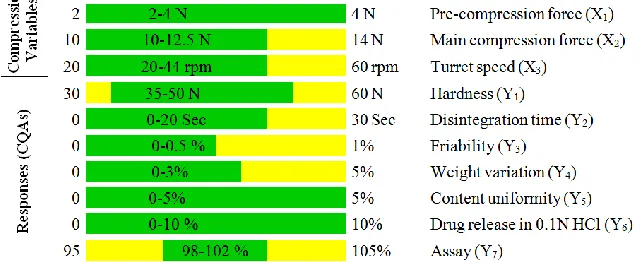
The normal operating ranges is CS which is defined as the upper and/or lower limits for the critical process variables. In the CS, the parameters were routinely controlled during production in order to assure the reproducibility (Yu, 2008). The acceptable range of process variable were determined basing on the knowledge space from screening design and DS, the detail information was explained in Fig. 4.
Scale up of compression process
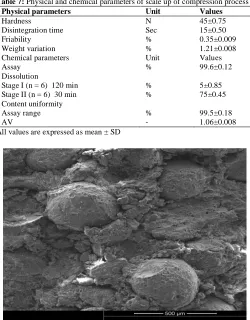
The scale up batch (B No: PTZ40-001) ran on Fette P2020 compression machine and optimized compression process parameters of Fette 102i. It was found that at 10.5 to 11.0 kN of main compression force, 3-4 kN of pre-compression force and 40 rpm of turret speed good quality tablets were compressed. All physical and chemical parameters found within limit, summarized in Table 7.
The results revealed that compression process
successfully scale up. The SEM image in Fig. 5 presented no cleavage of pellets after compression due to good pellets protection and optimum compression force.
Fig. 3: Pareto chart showing RPN scores for the compression process parameters for Pantoprazole MUPS tablets before and after risk mitigation.
Table 7: Physical and chemical parameters of scale up of compression process
Physical parameters Unit Values
Hardness N 45±0.75
Disintegration time Sec 15±0.50
Friability % 0.35±0.009
Weight variation % 1.21±0.008
Chemical parameters Unit Values
Assay % 99.6±0.12
Dissolution
Stage I (n = 6) 120 min % 5±0.85
Stage II (n = 6) 30 min % 75±0.45
Content uniformity Assay range AV
% -
99.5±0.18 1.06±0.008 Allvalues are expressed as mean ± SD
Fig. 5: SEM image of Pantoprazole MUPS tablet
CONCLUSION
In the given study Pantoprazole enteric coated pellets mixed with cushioning agent and taste enhancers to compressed in oro-dispersible MUPS tablet. However, not only formulation variables affecting the enteric protection of pellets in acidic medium but compression process also cleavage the pellets and impacting the drug release. Hence, systematic study of compression process variable were performed using experimental design and QbD approach to achieved physical and chemical parameters of tablets within limit. The risk assessment was performed using FMEA. The design space established using software to get optimized process variables and control strategy was framed for ranges of optimized process variables. It could be concluded that a quality Pantoprazole MUPS tablet was successfully designed using QbD approach to compression process variables.
REFERENCES
Sirisha VR, Vijaya SK, Suresh K, Kamalakar GR. Multiple unit pellet systems: a review. Int J Pharm, 2012; 2:419-425.
Peura DA, Berardi RR, Gonzalez J, Brunetti L. The Value of Branded Proton Pump Inhibitors Formulary Considerations. P&T, 2011;7:434-445.
Hatlebakk JG, Katz PO, Camacho-Lobato L, Castell DO. Proton
pump inhibitors: better acid suppression when taken before a meal than without a meal. Aliment Pharmacol Ther, 2000; 10:1267-1272.
Celik M. 1994. Compaction of multiparticulate oral dosage forms. In: Ghebre-Sellassie I. (ed.), Multiparticulate Oral Drug Delivery, New York: Marcel Dekker. pp. 181–15.
Dashevsky A, Kolter K, Bodmeier R. Compression of pellets coated with various aqueous polymer dispersions. Int J Pharm, 2004; 279:19–26.
Bashaiwoldu AB, Podczeck F, Newton JM. The application of non-contact laser profilometry to the determination of permanent structural change induced by compaction of pellets. II. Pellets dried by different techniques. Eur J Pharm Sci, 2004; 22:55–61.
Guidance for Industry, Tablet Scoring: Nomenclature, Labeling, and Data for Evaluation. U.S. Department of Health and Human Services Food and Drug Administration Center for Drug Evaluation and Research (CDER), March 2013.
Ramesh CK, Rehman A, Prabhakar BT, Vijay Avin BR, Aditya Rao SJ. Antioxidant potential in sprouts vs. seeds of Vigna radiata and Macrotyloma uniflorum. J App Pharm Sci, 2011; 1:99-103.
Abdul S, Chandewar AV, Jaiswal SB. A flexible technology for modified-release drugs: multiple-unit pellet system (MUPS). J Control Rel, 2010; 147:2–16.
Bhad ME, Shajan A, Jaiswal SB, Chandewar AV, Jain JM, Sakarkar DM. MUPS Tablets-A Brief Review. International J PharmTech Res, 2010; 1:847-55.
Deb R, Ahmed AB. Pellets and Pelletization techniques : A critical review. International Res J Pharm, 2013; 4:90-95.
ICH Guideline. Pharmaceutical Development Q8(R2), Current Step 4 version. August 2009.
ICH Guideline. Quality Risk Management Q9, Current Step 4 version, November 2005.
ICH Guideline. Pharmaceutical Quality System Q10, Current Step 4 version, June 2008
United state pharmacopeia, USP37-NF32, 2014; Volume 3:4182-86.
United state pharmacopeia, USP37-NF32, Volume 1, 2014, General Chapter : <701> Disintegration, 342-44.
Stamatis DH. Failure Mode and Effect Analysis: FMEA from Theory to Execution. Milwaukee: American Quality Press, 2003:Chapter 2.
Masoud H, Arash S, Natraj R. The Application of FMEA in the oil industry in Iran: The case of four litre oil canning process of Sepahan Oil Company. African J Business Management 2011; 8:3019-27.
Mohammad HY, Tahereh NBA, Shahram T, Sekine SE. Performance improvement through proactive risk assessment: Using failure modes and effects analysis. J Educ Health Promot, 2014; 3:28.
Vogt FG, Kord AS. Development of quality-by-design analytical methods. J Pharm Sci, 2011; 100:797-12.
IEC, Analysis techniques for system reliability : Procedure for failure mode and effects analysis (FMEA) - International Standard 60812, 2006.
Nagarwal RC, Srinatha A, Pandit JK. In Situ Forming Formulation: Development, Evaluation, and Optimization Using 33 Factorial Design. AAPS PharmSciTech, 2009; 3:977–84.
Yu LX. Pharmaceutical quality by design: product and process development, understanding, and control. Pharm Res, 2008; 4:781–91.
Bogner R, Drennen J, Khan M, Oksanen C, Reklaitis G. Quality by Design I: Application of Failure Mode Effect Analysis (FMEA) and Plackett-Burman Design of Experiments in the Identification of “Main Factors” in the Formulation and Process Design Space for Roller-Compacted Ciprofloxacin Hydrochloride Immediate-Release Tablets. AAPS PharmSciTech, 2012; 4:1243-54.
How to cite this article: