Volume 01, No.5, May, 2015
P
age
41
Cropping System Analysis of Kurukshetra District using Remote
Sensing and GIS
Kirti Yadav*, M.P.Sharma
**,Om Pal**,Ravindra Prawasi**
& R.S. Hooda
*** Birla Institute of Scientific Research, Jaipur, Rajasthan,
** Haryana Space Applications Centre (HARSAC), Department of Science and Technology, Hisar, India
ABSTRACT:
Agricultural sustainability has the highest priority in all countries, whether developed or developing. Cropping System Analysis is essential for studying the sustainability of agriculture. Crop rotation is stated as growing one crop after another on the same piece of land in different timings (seasons) without impairing the soil fertility. A cropping system can be defined as the cropping patterns and their management to derive maximum benefits from a given resource base under specific environmental conditions. Multiplicity of cropping system has been one of the main feature of Indian agriculture and is attributed to rained agriculture and prevailing socio-economic situations of farming community. It has been estimated that more than 250 double cropping systems are followed throughout the country. Thirty important cropping systems have been identified based on rationale spread of crops in each district in the country. Although, it is well known that one of the main advantage of remote sensing satellites is the synoptic and repeated collection of data which facilitate to map multi-year cropping patterns and crop rotations. In the present work, crop rotation and long term changes monitoring in cropping pattern along other spatial and non-spatial collateral data have been done with the help of satellite data at block level of Kurukshetra district of Haryana. Multi-date IRS LISS-III data of different seasons for the year 2007-08 have been used for the study. Cropping pattern maps of Rabi, Kharif and Summer season have been understood to know the spatial distribution and associations between crops or crops and uncultivated land in the same fields (although not in a particular order of sequence). The findings of the study may be used by Department of Agriculture, Haryana for planning of agricultural strategies in the district and for planning agricultural research and extension activities for crop diversification.
Keywords: Cropping system, Remote sensing, IRS-P6 satellite, LISS-III, Rabi, Kharif.
INTRODUCTION
Volume 01, No.5, May, 2015
P
age
42
crop area and, predict yield at small scales (Kanemasu, 1974). The structure of most crops is identical causing spectral mixes within crops and other types of vegetation. These high spectral overlaps make attempts to understand the relationships between crops and the ecosystems within which they occur in order to classify remote sensing imagery difficult. The spectral signature for vegetation is highly variable in nature since it changes completely during the seasonal cycle of many plants (Schowengerdt, 1997). Therefore, a number of contexts like spatial, spectral and temporal have been used over the years in order to carry out crop identification in remotely sensed data (Byeungwoo and Landgrebe, 1992; Wharton, 1982).
Agriculture is the backbone of Indian economy, contributing about 90% towards the Gross National product and providing livelihood to about 70% of the population. In the country, wheat is the second important food crop being next to rice and contributes to the total food grain production of the country about 25%. Importance of crop production information was realized in India as early as 1884, when the government initiated a program for wheat. Agriculture is the main occupation of the people of Haryana. Haryana is often called the “Food Mine” of the country. About 80% of the population of the state is agriculture dependent. Haryana is self sufficient in producing food grains of the country. Wheat, rice, maize and bajra are the major grains produced in the state. The crop production of Haryana can be broadly divided into Rabi and Kharif. The major Kharif crops of Haryana are rice, jowar, bajra, maize, mustard, jute, sugarcane, sesame and groundnut. The major Rabi crops are wheat, tobacco, gram, linseed, rapeseed and mustard. The total area irrigated by canal water is 21.40 lakh hectares. The state of Haryana has a geographical area of 44.20 lakh hectare. About 86% of the geographical area is cultivable in which 96% has already been brought under plough. Therefore, there is hardly any scope for bringing additional area under cultivation, except for reclamation of degraded lands affected by water logging, salinity and alkalinity. About 84% of the cultivated area in the state is irrigated. Irrigation from canals forms the lifeline of agriculture in Haryana. The various canals which are operating in the state include Western Yamuna Canal, Gurgaon Canal, Jui Canal, Jawaharlal Lal Nehru Canal and Bhakra Canal. These canals are the main source of water for cultivation in various districts of the state. Haryana together with Punjab is called the 'Grain Bowl' of India.
OBJECTIVES
This study established the methodology for spatial analysis of cropping systems. It is now envisaged to create remote sensing based Cropping System Analysis for Kurukshetra district and its development Blocks at 24 m. cell size.
STUDY AREA
Volume 01, No.5, May, 2015
P
age
43
south and south-west, Ambala in the north and Patiala in the north-west. The plain is remarkably flat and narrow low-lying flood plains, known as either Betre Khadar of Naili.
Saraswati, Markandaand Ghaggar rivers are major rivers of the district. The eastern parts of
the district falls in the Upper Jamuna Basin and western parts falls in Ghaggar basin. The river Markanda provides the major drainage in the area. (Figure 1) Irrigation in the district is done by surface water as well as ground water.
Study Area Map
Figure: 1
Database Requirement: Various types of data have been used as per the requirement of the study. The sources of data collected can be put under the following categories:-
Remote Sensing Data: Remote sensing data is the basic data source for mapping the
cropping system of the state region. Indian Remote Sensing Satellite Resourcesat (IRS-P6) LISS III data is the ideal one with optimum spatial and temporal resolution. The sensor provides 23.5 m spatial resolution data in Green, Red, NIR and SWIR bands with 24 days revisit capability. Its repeat cycle can be used for deriving Kharif, Rabi and summer cropping pattern and change analysis between these seasons. (Chart 1) Remote sensing data from sensor LISS III on-board Indian Remote Sensing Satellite Resourcesat (IRS-P6) of 2007-08 were used to analyze the changes in cropping pattern and crop rotation for three seasons’ Kharif, Rabi and summer. The Multi-date satellite data are used for different seasons which are given in Table: 1
Table-1. Satellite data used in digital analysis.
S. No. Season Satellite Sensor Date of acquisition Path/Row
1. Kharif IRS-P6 LISS-III
Oct. 24, 07 July 15, 07 Sept. 30, 07
95/50
2. Rabi IRS-P6 LISS-III Jan. 4, 08
March 16, 08 95/50
Volume 01, No.5, May, 2015
P
age
44
Chart 1: Flow Chart of methodology used
KHARIF SEASON, 2007 RABI SEASON, 2008 SUMMER SEASON, 2008
SATELLITE DATA LOADING & DISPLAY
IMAGE TO IMAGE TRANSFORMATION MODEL USING GCP’S
BOUNDARY OVERLAY& EXTRACTION OF DISTRICT AND BLOCKS IMAGE
MASK (inside, outside, Non-agricultural and combined) AND NDVI image GENERATION
UNSUPERVISED CLASSIFICATION
USING ISO-DATA CLUSTERING
LOCATION OF GT SITES
IDENTIFICATION OF CLASSES
SEGMENTS
RECLASSIFICATION OF MIX CLASSES MULTI-DATE DIGITAL DATA OF IRS
P6 LISS III
COMBINED MASK (major crop, other crops & fallow) OF DIFFERENT SEASONS
GENERATION OF CROPPING PATTERN MAPS
FOR KHARIF, RABI & SUMMER SEASONS ACCURACY ASSESSMENT
CROP ROTATION MAPPING
CROPPING SYSTEM ANALYSIS
The IRS-LIII data was the main source of satellite imageries for deriving the spatial maps of agricultural land use, cropping pattern, crop rotation and crop calendar. Total-6 dates starting from September 30, 2007, October 24, 2007, July 15, 2007, January 4, 2008, March 16, 2008 and May 27, 2008 were used. PCI Geomatica 9.3 image processing software was used for geo-referencing, multi-date data stacking and overlaying state and district boundary. The best channel selection was carried out with all the dates methodology used that resulted in 6 optimum dates. Optimum data sets were used to classify forest/permanent vegetation, wastelands and permanent water bodies. A multi-phased unsupervised ISODATA classification was used for seasonal cropping pattern mapping. The pixels that were found as correctly classified were masked and a second classification was performed for remaining area until no further increase in class separability was achieved. Data acquired from September 30, 2007, October 24, 2007, July 15 and January 4, 2008, March 16, 2008 and May 27, 2008 or Kharif, Rabi and summer cropping patterns, respectively. (Table:2)
Volume 01, No.5, May, 2015
P
age
45
Table-2:Kharif Season Cropping Pattern derived from RS data
ACCURACY ASSESSMENT OF CROP ACREAGE
Relative Deviation (% RD)
In order to get the relative deviation of current estimated vales to the last year’s BES
estimates following formula have been applied.
% RD (2007-08) = RS (2007-08) - BES (2007-08) * 100
BES (2007-08)
Where RS is Area Computed by Remote Sensing Technique.BES is Statistical Data Received by Bureau of Economics & Statistics.
RESULT
Analysis by remote sensing techniques reflected that Rice and Sugarcane are two major crops
in Kharif season, which could be identified using Multi-date RS data. Rice is mostly
concentrated throughout the district except in eastern part of the district. Other crops in the Kharif season include Bajra, Maize, Jowar etc. Wheat and Sugarcane are the two major crops during Rabi season followed by other crops.
Kharif Cropping Pattern
Analysis by remote sensing techniques reflected that Rice and Sugarcane are two major crops in Kharif season, which could be identified using Multi-date RS data. The area of different crops and categories derived from RS data shown in Table.6 and Figure.20 shows graphical representation of Kurukshetra District.(Figure:2)
Chart: 2 & Figure:2 Kharif Cropping Pattern of Kurukshetra District
S.No. Class Area (000’h) derived from RS data
1. Rice 102.93
2. Sugarcane 17.70
3. Other Crops 15.41
Volume 01, No.5, May, 2015
P
age
46
RABI CROPPING PATTERN
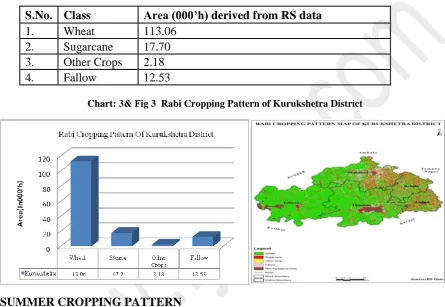
Wheat and Sugarcane are the two major crops during Rabi season followed by other crops. As it can be seen from Figure 3 and Table 3, which are derived from RS data. Wheat crop is evenly spread throughout the district except in eastern part and it occupies 113.06 (000’ha) area.
Table 3: Rabi Season Cropping Pattern derived from RS data
Chart: 3& Fig 3 Rabi Cropping Pattern of Kurukshetra District
SUMMER CROPPING PATTERN
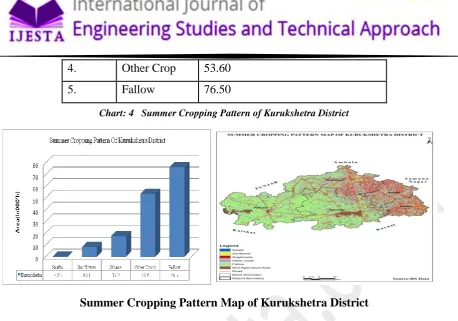
Sunflower and Saathi is also main crops of Kurukshetra district in summer season. As it can be seen from Figure 4 and Table 4, which are derived from RS data, most of the part of Kurukshetra district is Fallow. Area of Saathi crop is close to with what obtained from estimates of Saathi analyzed in 07-08. Sugarcane and Other Crops are concentrated in eastern part and occupies 17.7 (000’ha) and 53.6 (000’ha) respectively. Other crops, grown in the district include Vegetables and Fodder etc.
Table 4: Summer Season Cropping Pattern derived from RS data
S.No. Class Area (000’h) derived from RS data
1. Wheat 113.06
2. Sugarcane 17.70
3. Other Crops 2.18
4. Fallow 12.53
S.No. Class Area (000’h) derived from RS data
1. Saathi 0.25
2. Sunflower 8.21
Volume 01, No.5, May, 2015
P
age
47
Chart: 4 Summer Cropping Pattern of Kurukshetra District
Summer Cropping Pattern Map of Kurukshetra District
CROP ROTATIONS
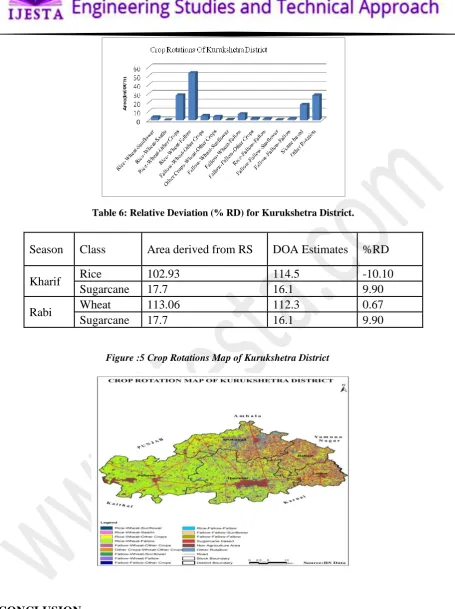
It indicates that Kurukshetra District has the major crop rotations of Rice-Wheat-other Crops, Rice- Wheat-Fallow, Fallow-Wheat-Fallow and Sugarcane based of three seasons Kharif, Rabi and summer. Rice-Wheat-other Crops, Rice- Wheat-Fallow, Fallow-Wheat-Fallow and Sugarcane based rotation is distributed in whole district except eastern part of the district shown in Figure 5 and Table 5.
Table 5: Crop Rotations Statistics derived from RS data
Chart: 5 Crop Rotations
of Kuruksh
etra District
4. Other Crop 53.60
5. Fallow 76.50
S.No. Class Area (000’h) derived from RS data
1. Rice-Wheat-Sunflower 3.701
2. Rice-Wheat-Saathi 0.14
3. Rice-Wheat-Other Crops 28.39
4. Rice-Wheat-Fallow 53.43
5. Fallow-Wheat-Other Crops 4.95
6. Other Crops-Wheat-Other Crops 4.18
7. Fallow-Wheat-Sunflower 0.63
8. Fallow-Wheat-Fallow 7.03
9. Fallow-Fallow-Other Crops 1.96
10. Rice-Fallow-Fallow 1.59
11. Fallow-Fallow-Sunflower 0.35
12. Fallow-Fallow-Fallow 1.51
13. Sugarcane based 17.70
Volume 01, No.5, May, 2015
P
age
48
Table 6: Relative Deviation (% RD) for Kurukshetra District.
Figure :5 Crop Rotations Map of Kurukshetra District
CONCLUSION
The present study introduces a method for analysis of cropping systems for main crops, other crops and fallow land of the year 2007-08 of the Kurukshetra district and its development blocks. Using unsupervised classification of multi-date satellite images of LISS III, cropping pattern and crop rotation maps are generated. This method identifies main crops of Kharif,
Season Class Area derived from RS DOA Estimates %RD
Kharif Rice 102.93 114.5 -10.10
Sugarcane 17.7 16.1 9.90
Rabi Wheat 113.06 112.3 0.67
Volume 01, No.5, May, 2015
P
age
49
Rabi and Summer Seasons shown in the study area. Although, it shows crop rotations as such, it allows spatial relationships between main crops, and other crops at a specific location to be mapped during the study period. An advantage of the proposed method is that it may show some spatial relationships between crops, which could reveal certain specific location of some rotations. For example, in the study area of Kurukshetra district the spatial relationship between Rice, Wheat and Sunflower which are seasonal crop in Kharif, Rabi and summer shows the specific location of typical distribution areas. An additional possibility of multi-year cropping pattern map is its use in future spatial crop distribution prediction, since it contains expert knowledge about spatial relationships between crops in the study area and implicit probabilities of changes.
REFERENCES
i Manjunath K.R. 2006. Remote Sensing and GIS Applications for Crop Systems
Analysis. Invited lecture delivered during NNRMS Training Programme on “Geoinformatics for Sustainable Development” at, Haryana Remote Sensing an applications Centre, Hisar, india.
ii Panigrahy Sushma. Ray S.S. Sood Anil. Patel L.B. Sharma P.K. and Parihar J.S.
2004. Analysis of Cropping Pattern changes in Bhatinda District Punjab. Journal of the Indian Society of Remote Sensing. 32(2): 209-216.
iii Panigrahy R. K. Panigrahy S. Ray S. S. and Parihar J. S. Analysis of the Cropping
pattern and Crop rotation of a subsistence Agricultural region using high temporal Remote Sensing data.
iv Saha S.K. and Choudhury Swagata. Cropping Pattern Change Analysis and Optimal
Landuse Planning By Integrated Use Of Satellite Remote Sensing and GIS - A Case Study Of Barwala C.D. Block, Panchkula District, Haryana, India. Imperial Gazetteer of India. 13: 54(3).
v Wilson F. 1904. Punjab Notes and Quarries. 547: 67.
vi Byeungwoo J. and Landgrebe D. A. 1992. Classification with spatio - temporal
interpixel class dependency contexts. IEEE Transactions on geosciences and remote sensing. 30(4): 663-672.
vii Kanemasu E. T. 1974. Seasonal canopy reflectance patterns of wheat sorghum and
soybean. Remote Sensing of Environment. 3(1-4).
viii Schulze R. E. 1997. South African Atlas of Agrohydrology and Climatology (Report
TT82/96). Pretoria: Water Research Commission.