Improving communication of patient
issues on transfer out of intensive care
Jessica Caroline Roberts, Lizzie Johnston-Walker, Kim Parker, Katherine Townend, James Bickley
To cite: Roberts JC, Johnston-Walker L, Parker K, et al. Improving communication of patient issues on transfer out of intensive care. BMJ Open Quality 2018;7:e000385. doi:10.1136/ bmjoq-2018-000385
►Additional material is published online only. To view please visit the journal online (http:// dx. doi. org/ 10. 1136/ bmjoq- 2018- 000385).
Received 23 March 2018 Revised 23 June 2018 Accepted 16 September 2018
Department of Intensive Care, Canterbury District Health Board, Christchurch, Canterbury, New Zealand
Correspondence to Dr Jessica Caroline Roberts; jessica. roberts@ cdhb. health. nz © Author(s) (or their employer(s)) 2018. Re-use permitted under CC BY-NC. No commercial re-use. See rights and permissions. Published by BMJ.
AbstrAct
The written medical handover document is frequently poor in quality and highly variable which raises concerns about patient safety. Intensive care unit (ICU) patients have complex medical and social issues which increases the risk of errors during ongoing hospital treatment. Our project team of four doctors and two nurses aimed to improve the documentation of patient problems as they leave the ICU.
A literature review and process mapping of both medical and nursing transfer documentation helped in understanding the current process. Current problems (CP) were defined as any patient issues which require ongoing thought, management or follow-up.
Our progress was tracked using a measure of the number of CPs listed in the free-text field titled ‘Current Problems’ in 50 medical transfer documents. This was graphed on a control chart showing a process in statistical control. Means and control limits were recalculated whenever a process shift occurred.
There was no relationship between the number of CPs listed and length of ICU stay, age of patient, or severity of illness on presentation (Acute Physiologic Assessment and Chronic Health Evaluation II score). An inter-relationship graph identified the key drivers which were amenable to change: (1) the doctors completing the clinical summary at the time of discharge did not have all the information readily available to them and (2) the doctors were uncertain of the types of problem which should be communicated.
Improvements were designed and trialled using Plan-Do-Study-Act cycles to address these two key drivers. At baseline, the average number of CPs per patient was 1.8. After implementation of a paper problem list at the patient bedside, with supporting education, the average increased to 2.7. This was further improved by the addition of a checklist of common patient problems. This increased the average to 3.85.
These improvements were permanently implemented and ongoing audits have shown sustained improvement using statistical process control methods.
Problem
This improvement activity took place over 2 years in a 23-bed medical and surgical intensive care unit (ICU) within a 650-bed acute tertiary hospital in Christchurch, New Zealand. When a patient is transferred from the ICU to another ward, a transfer document is completed by the doctors. The
transfer document is completed in the elec-tronic medical record and printed so it is present in both paper and electronic form. It includes sections for patient identifiers, a clinical summary of their admission and progress in ICU, diagnoses, current status, current problems (CP) and research studies they were involved in. The doctors and nurses also perform separate verbal handovers. The doctors’ verbal handovers do not have a struc-ture imposed, being tailored to the patient by the clinicians.
ICU patients who are well enough to step down to a general hospital ward often have many ongoing problems which must be addressed by the receiving team prior to the patient leaving hospital. The CP section of the doctors’ transfer document (Clinical Summary) gives the reader a quick reference to a list of those ongoing issues. Clinicians from within the ICU and from receiving teams have frequently expressed concern that these transfer documents were incomplete. This raises concern that some important patient problems are not adequately communicated to the receiving teams. This results in avoid-able patient risk and wasted time as clinicians must search for the information they need. This project aimed to increase the number of items listed in the CP section of the doctors’ transfer document as a way of improving the quality of transfer communication. CPs were defined at the first team meeting to include ‘any patient issues which require ongoing thought, management or follow-up.’ This was deliberately left broad so that a wide range of management problems would be included.
Prior to this project, improvement efforts had consisted of informal reminders to the doctors of their responsibility to ensure the document is up to date. It has been recognised that reminders and education alone are unlikely to produce sustained change in clinician behaviour,1 as was
the case here. These reminders did not produce sustained improvement indicating that a process change may be required. We recognised the importance of including both
copyright.
on September 12, 2020 by guest. Protected by
medical and nursing staff in this project as they have complementary work flows which both produce transfer documents. Also any possible solutions would likely impact both disciplines.
The organisation has a Process for Improvement which is modelled on the Institute of Healthcare Improve-ment framework. This process is not widely followed by ICU staff. This project was seen as an opportunity to demonstrate this improvement process on a small but meaningful project within the resources currently avail-able. For this reason, the scope was clearly defined and adhered to throughout the project. This project was limited to improving the communication of CPs, and did not aim to look at the broader handover structure or processes.
background
It has been shown that handovers are a point in a patient’s journey where significant risk is introduced2 leading to
adverse events. In one survey, 59% of doctors reported that patients were harmed as a result of inadequate hand-overs during their rotation.3 Inaccuracies, omissions and
inadequate handover processes all contribute to delays in diagnosis and treatment of patients, reduced patient satis-faction and adverse events.4 Intensive care patients may
be particularly vulnerable during handover as they often have complex medical problems requiring input from multiple specialties, specialist nurses and allied health professionals.
Key guidelines for handover improvement make broad recommendations but also recognise the complexities of handover.5 They acknowledge the difficulty in defining
the essential characteristics of handover and recom-mend that these are developed locally. A recent review6 found 122 articles related to the execution of discharge from ICU; however, a universal definition of quality of handover has not been achieved in the medical literature.
Many studies have looked at the transfer of data during handover,7 some attempting to define the minimum data set of information for transfer. Information transfer is often seen as the primary aim of handover but there are other important aspects to consider, such as effective coordination of care, collaborative cross-checking and task completion.8 Some have tried to impose more struc-ture to the handover, but it is recognised that sometimes standardisation is a barrier to quality in service industries9
and complex adaptive systems.10
Santos et al4 describe how incomplete data
hamper communication and patient care by describing missing data as noise which reduces the ability of a receiving team to build a mental model of the patient. They also highlight how this leads to inefficiency and technical errors in patient care. With this in mind, we have focused on improving the use of one important field of the existing handover document, the completion of the list of CPs.
measuremenT
There is no simple, easily measured metric for this problem, so a surrogate was devised. The project group spent some time deciding on an appropriate metric which could be measured at baseline, and again after improve-ments. It was essential that the measurement aspect was not time consuming, and was achievable within existing clinical workload. Our literature search found no existing tools for measuring this type of list of patient problems other than as part of a general perception of complete-ness by the receiver.11 The ideal measurement would be
to count the number of CPs which are missing from the clinical summary for a sample of patients.
Detailed examination was undertaken of 10 clinical records looking for undocumented CPs. This revealed that missing CPs were varied in type, that every clinical summary had at least one easily identifiable CP omitted, and that there was a similar problem with the nursing handover paperwork. However, it was rapidly recognised that this was an impractical task to do as an ongoing measure, in part because the definition of a CP is delib-erately broad to allow for the wide range of medical, social and psychological problems a patient may have on leaving the ICU so it is impossible to determine what the ideal number of items should be.
In the absence of a gold standard list of CPs for each patient, it would be impossible to determine if all of their problems were documented retrospectively, and would require extra resources to attempt to do this prospec-tively. So a simple count of the number of items listed in the CP section of the clinical summary was used as our ongoing measure. An improvement would be indicated by an increased number of items tracked on a control chart. Initially, 50 summaries would be reviewed and the process assessed for statistical control, subsequent process shifts would be recognised using control chart rules. There was recognition that any increase was unlikely to be detrimental to the communication unless such excessive numbers of problems were listed, that the important ones became lost in the text. This was considered sufficiently unlikely so as not to be a barrier to using this count as an indicator of quality.
A control chart was used to display and analyse the base-line data. The number of items listed per document was graphed over time. The mean was calculated at baseline and again if there was evidence of a process change. Upper and lower control limits were calculated as three SDs above and below the mean. At baseline, this showed a process in statistical control with a mean number of CPs of 1.8 prob-lems per clinical summary. Also of note was that 16% of clin-ical summaries listed zero CPs. It is very unlikely that 16% of patients had no CPs as they left intensive care.
The finding of missing CPs in some documents, and the presence of zero CPs in some documents reinforced the finding that there was a quality problem which could be amenable to change.
During this measurement phase, data were also collected on the types of CP listed and patient demographics.
copyright.
on September 12, 2020 by guest. Protected by
Scatter graphs showed no correlation between the number of CPs and length of ICU stay, age of patient or severity of illness on presentation (Acute Physiologic Assessment and Chronic Health Evaluation II score). See online supplementary material Baseline Data Analysis for graphs.
design
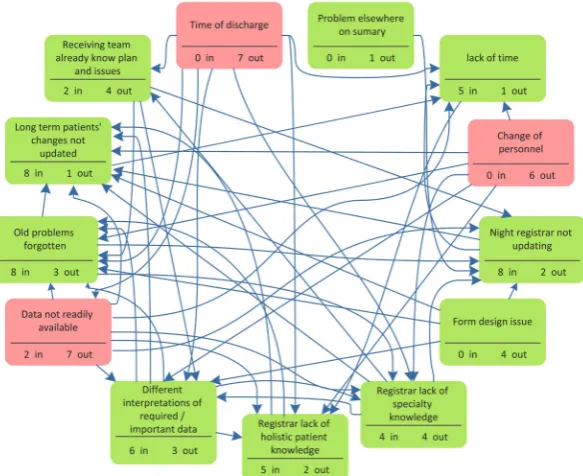
The key step to determining strategy was the formation of an inter-relationship graph (figure 1). The project team brainstormed contributing factors for the incom-plete documentation. Each possible relationship between factors was determined by group consensus, as well as the direction of cause and effect between each pair.
The three key causes of incomplete documentation were as follows.
Timing of discharge
The decision to discharge a patient is finalised on the morning ward round. The duty nurse manager imme-diately begins the process of organising a bed on the receiving ward. The patient is transferred as soon as possible to improve patient flow through the hospital and free up ICU beds for other admissions. Any delay of transfer is likely to negatively impact overall patient care making this factor inappropriate to change.
change of personnel
This refers to the fact that both nurses and registrars (doctors in specialist training) work shift patterns. The nurse and the doctor discharging the patient often do not have detailed knowledge of all of the patient’s CPs. The doctor completing the transfer document may have only known the patient for a few hours. This factor was also inappropriate to change. There are already significant efforts made to ensure continuity of care but this is not consistently achievable with ICU rostering and workload.
data not readily available
This refers to the CPs not being documented in an easily accessible way in the patient notes. A registrar must look through both written and electronic notes from ward rounds, nursing entries, visiting specialists and allied health. They correlate this with their knowledge of the patient’s current status to collate a list of CPs. This lack of a readily available list of CPs leads to old problems being forgotten, time pressures, lack of holistic knowledge of the patient and, ultimately, to problems not being listed on the transfer document.
other
Other important drivers included registrar’s lack of specialty knowledge, form design issues and perception that the receiving team already know the CPs.
Figure 1 An inter-relationship graph. The possible causes of poor documentation of current problems (CP) are examined in pairs to determine if a cause and effect relationship occurs between each pair. The arrows represent the direction from cause to effect. The total number of arrows away from an item represents that item’s contribution as a cause of the problem. The total number of arrows towards an item represents that item’s contribution as an effect. The three highlighted items are those items with the most arrows leading away, so are the main causes of poor documentation of CPs. copyright.
on September 12, 2020 by guest. Protected by
Our improvement efforts concentrated on solving the problem of doctors not having the right data easily available to them at the time of transfer. Our proposed solution was to provide a comprehensive list of patient problems at the bedside. This was based on group partici-pants’ prior experience with similar lists in other wards in the organisation. It was expected that this would improve the current process of doctors updating the transfer document.
sTraTegy
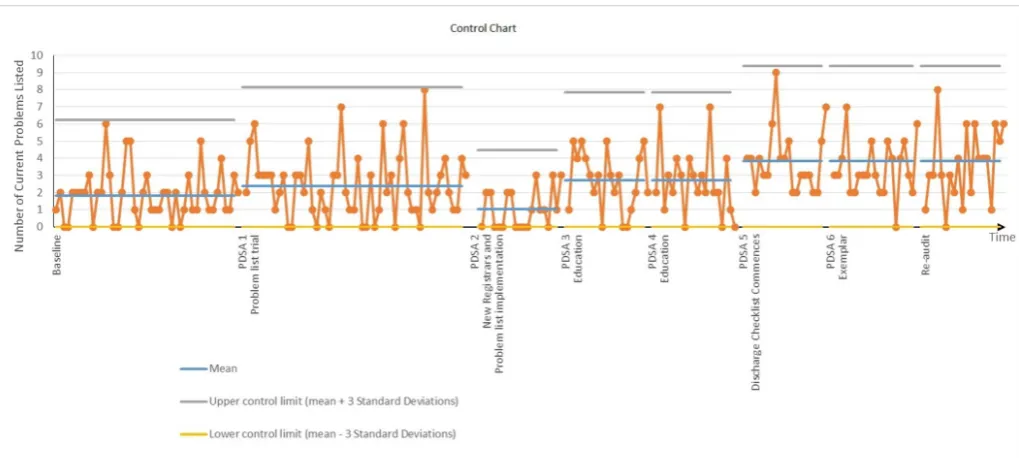
Five Plan-Do-Study-Act (PDSA) cycles were completed as outlined below. Data from all of these sequential PDSA cycles were plotted on a control chart (figure 2). The mean and control limits were recalculated when the control chart indicated a process change.
Pdsa 1: problem list trial
This was the first trial of a problem list. We hypothesised that if the registrars had a list of patient problems for reference they were more likely to communicate these on the clinical summary. We trialled a bedside paper problem list form for all ICU patients for 3 weeks. The project team were all clinical staff members in the unit and provided a continuous presence for education and support of the new process. The problem list was advertised in the staff communication newsletter and verbally in the morning notices which are read to all oncoming staff. Uptake of the new process was inconsistent; however, there was an increase in the mean number of problems listed in the clinical summary. The presence of data points outside of the original control limits suggests that this was a process shift. A new mean was calculated showing an increase from 1.8 to 2.4 CPs per document.
Feedback and analysis of the problem lists informed the next PDSA cycle with an improved design and formal adoption of the form.
Pdsa 2: problem list implementation and new registrars
A redesigned form was developed. The new form was much simpler and removed the need for dates, signatures and daily review which were poorly completed in the first trial. The organisation’s form template was applied, and it became an official document through the organisa-tion’s form process. It was hypothesised that the official appearance, colorisation and simplification of the form would further improve uptake. Once again, the new form was advertised in the daily notices and supported by the project team on the floor. The new form roll-out was timed with the start date of the new registrar rota-tion. Unfortunately, the number of CPs listed fell from an average 2.4–1.1. A run of more than seven data points below the mean indicates a true process change. Review of the problem lists collected showed us that the doctors were not always using the problem list when completing their transfer document. We decided to focus on this for the next cycle.
Pdsa 3: education
We used another coexisting process which occurs at the same time to help reinforce the use of the problem list during completion of the transfer documentation. The doctors were asked to place the problem list in a collection basket along with another document which they already place in the same basket at the same time. It was hypoth-esised that this would (1) reaffirm that the problem list does not accompany the patient to the ward so any infor-mation on it must be transferred to the clinical summary
Figure 2 An individual values control chart showing the number of current problems (CP) per discharge document over time. PDSA cycles are shown on the x axis. The mean and control limits are recalculated whenever a process change is indicated by special cause variation. PDSA, Plan-Do-Study-Act.
copyright.
on September 12, 2020 by guest. Protected by
and (2) ensure that the doctors have the problem list in their hands as they complete the transfer document. This was advertised to the registrars in the morning notices and encouraged by the project team on the ward. This change resulted in an increased number of CPs. On the control chart points outside the upper control limit indi-cate a true process change. The number of CPs increased from 1.1 to 2.7. Importantly, when graphed on the orig-inal baseline control chart, there are seven points above the mean, indicating that this is also a process improve-ment from baseline.
Pdsa 4: education
The next cycle focused on reducing the number of clin-ical summaries which listed zero CPs. It is unlikely that there are any patients leaving ICU without any ongoing problems. This was an education intervention. The PDSA leader educated every doctor in the ICU at the time. The education was designed to enhance their understanding of the importance of the clinical summary and appeal to their consideration of the junior doctors on the receiving teams. Unfortunately this had no effect, with no process change indicated on the control chart. Some clinical summaries were still listing zero CPs.
Pdsa 5: discharge checklist
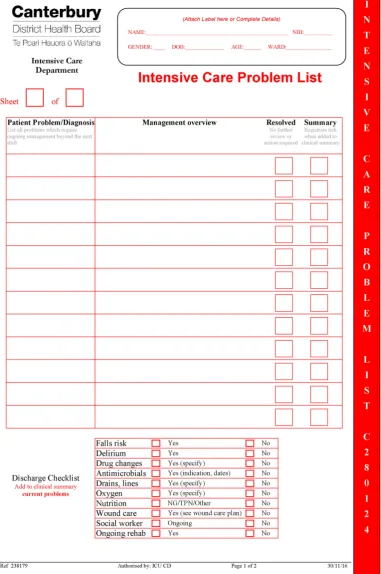
Many CPs become evident of the day of discharge. For example, medication changes, ongoing oxygen require-ment and falls risk are common issues in the ICU and therefore not highlighted during their stay as a problem on the problem list. We found that they were added to the CP section inconsistently during our initial in-depth case review. A checklist was added to the bottom of the problem list to encourage identification of these common problems on the day of transfer. It was trialled as a sticker added on the problem lists. There were now no clinical summaries showing zero CPs, and the control chart indicates a process change. The new mean showed an increase from 2.7 to 3.9 CPs listed. Figure 3 shows the final version of the ICU problem list.
Pdsa 6: exemplar
Staff feedback revealed that some of the nursing staff in ICU were reluctant to use the problem list for fear of writing the wrong thing. We produced an exemplar form with examples of problems taken from old problem lists. The reference exemplar was laminated and placed in the reference section of the bedside folders. This did not cause a significant improvement but was left there with the expectation that it may contribute to sustaining improvements. It is anticipated that it could be taken out at some stage in the future once the process is firmly embedded in the unit.
resulTs
We improved the documentation of patients’ CPs on the transfer document for ICU patients. The control chart (figure 1) shows progress over the 15-month project
and a follow-up audit 6 months later. There was special cause variation with PDSA cycles 1, 2, 3 and 5, indicating a process change.12 At these points the control limits and
mean were recalculated. Unfortunately the change with PDSA 2 was in the wrong direction, with lower numbers of problems listed. This was unexpected and on reflec-tion was thought to be due to the implementareflec-tion of the problem list occurring at the same time as doctor change-over. We were attempting to introduce a new process at a time of significant change in staff. However, with PDSA 3 (education) we saw improvement compared with the baseline and this improved even more with the addition of the checklist in PDSA 5.
Data were not continuously collected over the entirety of the project. There were some significant time gaps between PDSA cycles. This was partly due to there being no clear pathway for approving PDSA trials or implemen-tation of new processes. Fifty patient records were used for the baseline and PDSA 1. Subsequent PDSA cycle analyses were based on 20 patients after a run-in period of 1 week after the intervention.
A planned audit at 6 months after the project concluded showed that the improvements had been sustained with no special cause variation seen on the control chart. Overall the mean number of problems listed increased from 1.8 per patient to 3.85.
lessons and limiTaTions
We approached this project with an interdisciplinary team following the organisation’s ‘Process for Improvement’. It was a small project, deliberately chosen and defined to fit within current resources and clinical duties. There was no clear structure in the ICU department to facilitate this type of project which caused some delays and confusion at times. For example, it was unknown who would need to approve the PDSA trials, at which stages the project should be reviewed, and there was no accountability for comple-tion of the project. Subsequent to this project, a quality improvement governance group has been established in the ICU which facilitates this type of quality improvement project, with clear guidance and mentorship.
The team approach brought the advantage of providing broad knowledge of the processes investigated, and the implications of them. There was rich generation of ideas around causes and solutions. Wide discussion during team meetings meant that we were easily able to address any questions or concerns from the ICU senior team as the same issues had already been problem-solved within the project team. We felt that this interdisciplinary team approach led to good risk assessment when considering improvement trials.
The inter-relationship graph was a very useful tool in this situation because of the complexity of the transfer process. It also had the interesting outcome of showing that one proposed cause—the night registrars failing to update the clinical summary—was in fact a key indicator rather than a key driver. This helps explain the failure
copyright.
on September 12, 2020 by guest. Protected by
of previous attempts to improve transfer communication by reminding the doctors to simply do better. Searching for interconnections is advised when considering quality improvement initiatives10 and was felt to be an important
part of our project as it resulted in clear focus and direc-tion among the group in a complex situadirec-tion.
The absence of continuous data collection throughout the project is a limitation. Ideally data are collected contin-uously in a project like this and plotted on a control chart in real time but it was not considered to be an appro-priate use of resources in this project. The baseline data were plotted and found to be in statistical control. With
Figure 3 The final version of the intensive care unit (ICU) problem list.
copyright.
on September 12, 2020 by guest. Protected by
knowledge of the environment, and the lack of other rele-vant changes, the assumption was made that this statistical control would continue so data collection was limited to key time periods when change was expected.
The type of control chart used is an X (or individual values) chart. It is used when it is impractical to collect data on subgroups (eg, when it would take too long to get a subgroup as is the case with ICU discharges). The variation of the whole sample is used rather than the variation within subgroups (as in other control charts). It is less statistically sensitive than if subgroups were used, but is still recommended for use in some situations.12 If subgroups were to be used, the study period would have been extended as the data would need to be collected for months after each change, rather than weeks. To enable the project group to make this project achievable and meaningful the reduction in statistical robustness was considered a reasonable trade-off.
The other key limitation is the use a surrogate marker of quality, the number of CPs. In a complex adaptive system such as hospital medicine,10 it is difficult to see
meaningful outcome improvement from a single small initiative. However, each small project can contribute to the culture of improvement and, if conducted well, can be hoped to lead to an overall improvement in patient outcomes. So while the measure chosen was not ideal, it was considered a reasonable marker of change of the quality of the list of CPs, and was achievable with no extra resource in a busy ICU. However, we are unable to confirm that this change translates to significant improve-ment of the handover process as a whole.
conclusion
This project succeeded in improving the documenta-tion of patients’ CPs and also highlighted some barriers to running improvement projects in our intensive care department. We measured the number of CPs listed over the course of the project and improved this measure through analysis of the causes of the problem, and directed interventions which were trialled and implemented using PDSA cycles. The key improvements were the addition of a bedside patient problem list and discharge check-list for identifying ongoing patient issues. Education was important for embedding the new process. Reaudit after 6 months showed sustained improvement, and further plans to implement the checklist on the online document
are planned. It is expected that this process will need ongoing attention as the organisation progresses towards electronic records and improved bedside computer use.
Contributors ICU medical officer JCR planned and led the project and has submitted the report. The improvement team members were ICU registrars JB, who contributed to the group planning sessions, data collection and the first PDSA cycle; KT, who provided clinical governance and contributed to all of the group meetings and PDSA cycles; ICU nurses KP and LJW, who compared medical and nursing clinical summaries, liaised with receiving ward nurses and assisted with the PDSA cycles; and Dr Alex Reed who contributed to the group discussion at the initial planning meeting.
Funding The authors have not declared a specific grant for this research from any funding agency in the public, commercial or not-for-profit sectors.
Competing interests None declared. Patient consent Not required.
Provenance and peer review Not commissioned; externally peer reviewed. Open access This is an open access article distributed in accordance with the Creative Commons Attribution Non Commercial (CC BY-NC 4.0) license, which permits others to distribute, remix, adapt, build upon this work non-commercially, and license their derivative works on different terms, provided the original work is properly cited, appropriate credit is given, any changes made indicated, and the use is non-commercial. See: http:// creativecommons. org/ licenses/ by- nc/ 4. 0/.
references
1. Davis D, O'Brien MA, Freemantle N, et al. Impact of formal continuing medical education: do conferences, workshops, rounds, and other traditional continuing education activities change physician behavior or health care outcomes? JAMA 1999;282:867–74.
2. Colvin MO, Eisen LA, Gong MN. Improving the patient handoff process in the intensive care unit: keys to reducing errors and improving outcomes. Semin Respir Crit Care Med 2016;37:096–106. 3. Kitch BT, Cooper JB, Zapol WM, et al. Handoffs causing patient
harm: a survey of medical and surgical house staff. Jt Comm J Qual
Patient Saf 2008;34:563–70.
4. Santos GRdSd, Campos JF, Silva RCd. Handoff communication in intensive care: links with patient safety. Escola Anna Nery 2018;22. 5. Australian Commission on Safety and Quality in Health Care.
Safety and quality improvement guide standard 6: clinical handover (October 2012). Sydney: ACSQHC, 2012.
6. Stelfox HT, Lane D, Boyd JM, et al. A scoping review of patient discharge from intensive care: opportunities and tools to improve care. Chest 2015;147:317–27.
7. Manser T, Foster S, Gisin S, et al. Assessing the quality of patient handoffs at care transitions. Qual Saf Health Care 2010;19:1–5. 8. Van Eaton E. Handoff improvement: we need to understand what we
are trying to fix. Jt Comm J Qual Patient Saf 2010;36:51. 9. Beckford J. Quality: a critical introduction. 3rd edn. New York:
Routledge, 2010.
10. Braithwaite J. Changing how we think about healthcare improvement. BMJ 2018;361:k2014.
11. Goulding L, Parke H, Maharaj R, et al. Improving critical care discharge summaries: a collaborative quality improvement project using PDSA. BMJ Qual Improv Rep 2015;4:u203938:u203938. w3268.
12. Levine DM, Ramsey PP, Smidt RK, et al. Applied statistics for engineers and scientists: using microsoft excel and minitab. Upper Saddle River: Prentice Hall, 2001.
copyright.
on September 12, 2020 by guest. Protected by