►Additional material is published online only. To view please visit the journal online (http:// dx. doi. org/ 10. 1136/ openhrt- 2016- 000576).
To cite: Wall JJS, Iqbal J, Andrews M, et al. Development and validation of a clinical risk score to predict mortality after percutaneous coronary intervention. Open Heart 2017;4:e000576. doi:10.1136/ openhrt-2016-000576
Received 5 February 2017 Revised 27 April 2017 Accepted 9 May 2017
For numbered affiliations see end of article.
Correspondence to
Dr Julian Gunn, Medical School, University of Sheffield, Beech Hill Road, Sheffield, S10 2RX, UK; j. gunn@ sheffield. ac. uk
Development and validation of
a clinical risk score to predict
mortality after percutaneous
coronary intervention
Joshua J S Wall,1,2 Javaid Iqbal,1,2 Michael Andrews,1,2 Dawn Teare,3
Mina Ghobrial,1,2,4 Thomas Hinton,1,2,5,6 Samuel Turton,1,2,7 Leila Quffa,1,2
Magdi El-Omar,8 Douglas G Fraser,8 Anjan Siotia,9 Julian Gunn1,2,10
AbstrAct
Objective To develop and validate a contemporary clinical risk score to predict mortality after percutaneous coronary intervention (PCI).
Methods Using data collected from patients undergoing PCI at the South Yorkshire Cardiothoracic Centre, Sheffield, UK, between January 2007 and September 2013, a risk score was developed to predict mortality. Logistic regression was used to evaluate the effect of each variable upon 30-day mortality. A backwards stepwise logistic regression model was then used to build a predictive model. The results were validated both internally and externally with data from Manchester Royal Infirmary, UK. 30-Day mortality status was determined from the UK Office of National Statistics.
Results The development data set comprised 6522 patients from Sheffield. Five risk factors, including cardiogenic shock, procedural urgency, history of renal disease, diabetes mellitus and age, were statistically significant to predict 30-day mortality. The risk score was validated internally on a further 3290 patients from Sheffield and externally on 3230 patients from Manchester. The discrimination of the model was high in the development (C-statistic=0.82, 95% CI 0.79 to 0.85), internal (C-statistic=0.81, 95% CI 0.76 to 0.86) and external (C statistics=0.90, 95% CI 0.87 to 0.93) cohorts. There was no significant difference between observed and predicted mortality in any group.
Conclusion This contemporary risk score reliably predicts 30-day mortality after PCI using a small number of clinical variables obtainable prior to the procedure, without knowledge of the coronary anatomy.
IntroductIon
Risk scores to predict mortality after percu-taneous coronary intervention (PCI) have been present for decades. Initially designed to aid patient decisions, more recently, they have been used to allow for adjustment of operator and institutional mortality statistics and protect against risk-averse behaviour and litigation.1 2 Several risk scores can predict
mortality, some using a large number of
variables, some of which are not obtainable prior to angiography, some not reflecting contemporary PCI practice and others locally valid but untested elsewhere.3–11 A
contem-porary risk score comprising few, simpler variables, available to the operator prior to starting PCI, especially because many PCI procedures are conducted in an acute setting, would be ideal.
Key questIons
What is already known about this subject?
► There are numerous risk scores that exist to predict mortality post-percutaneous coronary intervention (PCI). The area is well studied and multiple authors have found that numerous variables significantly predict both in-hospital and 30-day mortality. But they are rarely used. Why? Most are too complex and do not use exclusively clinical variables readily available before taking the patient to the catheterisation laboratory.
What does this study add?
► In this study, we show that an accurate estimation of 30-day mortality post-PCI can be achieved with a relatively small number (five) of variables that are all obtainable prior to intervention.
How might this impact on clinical practice?
► We envisage that the risk score described here would allow patients and doctors to be fully informed before the procedure. We also foresee that the model would be an appropriate tool to protect operators from falsely elevated adverse outcome statistics, and to protect patients from risk-averse behaviour. The risk score could also be used to help stratify mortality data for operators and centres. Uniquely among risk scores that predict 30-day mortality, the model described here is unlikely to be incomplete or impossible to calculate, owing to the small number of readily ascertainable variables.
on September 12, 2020 by guest. Protected by copyright.
The objective of this study was to develop and vali-date, both internally and externally, a preprocedural risk score that is valid in the modern era, and predicts 30-day mortality post-PCI.
Methods data collection
The original data set comprised all patients who under-went PCI at the South Yorkshire Cardiothoracic Centre, Sheffield, UK. Sheffield is a tertiary centre providing all the PCI procedures for a population of ~1.8 million in the north of England. A standard panel of risk factors derived from previous risk scores was recorded using a dedicated database. This was a retrospective analysis of a prospectively kept database. The patient cohort was randomly divided into development (two-thirds) and validation (one-third) data sets and their 30-day mortality was determined from the UK Office of National Statistics. External validation was then performed by recalibrating the risk score using a technique described by Wu et al3
and applying it to similar data from Manchester Royal Infirmary, Manchester, UK.
clinical variables and outcomes
Demographic and clinical data comprising a number of clinically relevant risk factors were collected prospec-tively. Diabetes mellitus included both insulin-dependent and non-insulin-dependent types. Renal disease was labelled when serum creatinine was >200 µmol/L at the beginning of the PCI procedure, the patient was on regular dialysis or had undergone renal transplant; the absence of proof of renal disease was labelled as no history of renal disease. Cardiogenic shock was defined as signs of hypoperfusion (cold peripheries, altered mental state and oliguria) with a systolic blood pressure <90 mm Hg or one maintained artificially. Procedural urgency was categorised as elective, urgent or emergent: elective were planned procedures performed on stable patients; urgent were procedures performed on inpatients for unstable angina or non-ST segment elevation myocar-dial infarction; emergent procedures were immediate procedures usually performed for ST segment elevation myocardial infarction.
The study outcome was 30-day mortality of any cause.
statistical analysis
Logistic regression was used to evaluate the effect of each variable on 30-day mortality. Variables available prior to intervention found to affect 30-day mortality at univar-iate analysis at the level p<0.10 were then entered into a backwards stepwise logistic regression model. The vari-ables found to be still significant at the level p<0.10 were retained in the final model. Two models were created, the first using only patients for whom all variables found significant on univariate analysis were available, the second with imputed data in place of the missing vari-ables. A Mersenne Twister random number generator was used to impute five estimations for each missing variable;
the modal average was then used in place of the missing values. Analysis of the performance of the risk scores when applied to the development set was undertaken using a receiver operator characteristic curve C-statistic12
to assess discrimination, and the Hosmer-Lemeshow goodness-of-fit test to assess calibration.13 The unimputed
model was later used for a further internal validation which was undertaken by applying the risk score to patients from the Sheffield validation set and the results were analysed using identical techniques. This process was then repeated using the external (Manchester) vali-dation cohort once the risk score was recalibrated to the data. Assessment of the models was undertaken using the data sets for which there was no missing risk model vari-ables. All analyses were performed using SPSS V.21.0.
results
The baseline group comprised 10 169 patients from Sheffield who underwent PCI between January 2007 and September 2013, of which 6779 were in the devel-opment group and 3390 in the validation group. The external validation group was made up of 4899 patients from Manchester who underwent PCI between January 2012 and December 2014. After exclusions of patients with incomplete data (see online supplementary table 1), 6522 patients remained in the development set, 3290 in the internal validation set and 3230 patients in external validation set.
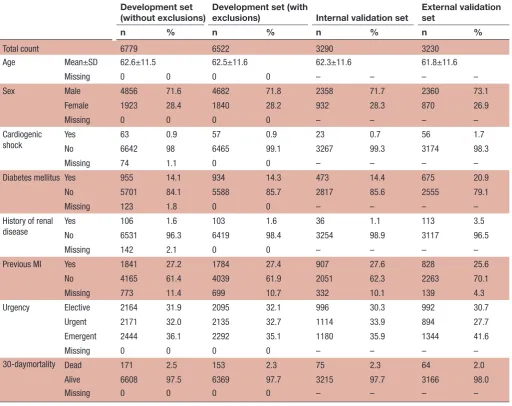
There were 171 (2.5%) deaths within 30 days in the development group (153 after exclusions (2.3%)), 75 (2.3%) in the internal validation group after exclusions and 64 (2.0%) in the external validation group after exclusions. Characteristics of the three groups are shown in table 1.
At univariate analysis of the development set, five variables were found to significantly impact mortality: cardiogenic shock (OR=20.1, 95% CI 11.6 to 35.1), emer-gent procedure (OR=10.5, 95% CI 5.8 to 19.0), history of renal disease (OR=5.0, 95% CI 2.6 to 9.5), diabetes (OR=1.6, 95% CI 1.1 to 2.4) and age (OR=1.1 for each year, 95% CI 1.0 to 1.1).
Missing data for 257 patients in the development set were imputed and the results were entered into a back-wards stepwise logistic regression model. A similar model was produced excluding the 257 patients for whom all variable data were not present (n=6522); the results of which are shown in table 2.
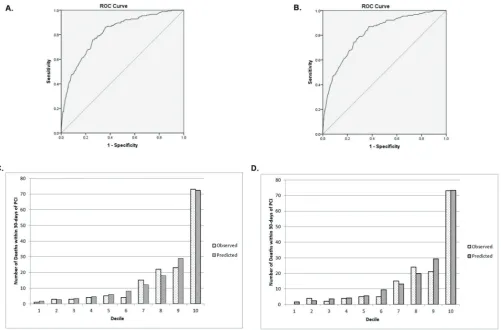
The unimputed and imputed models performed similarly when applied to the development set. The discrimination of both models was high14 (unimputed:
C-statistic=0.82, 95% CI 0.79 to 0.85, figure 1A; imputed: C-statistic=0.82, 95% CI 0.79 to 0.85, figure 1B) , and both models were well calibrated, predicting 157 and 162 deaths, respectively; 153 were observed. Hosmer-Leme-show p values of 0.71 (unimputed) and 0.32 (imputed) confirmed no significant difference between observed and predicted mortality for either model (unimputed,
on September 12, 2020 by guest. Protected by copyright.
figure 1C; imputed, figure 1D). As both models performed similarly well, the unimputed model was selected for further analysis.
Equation 1 shows the risk score derived from the unim-puted backwards stepwise logistic regression, where p=the probability of death within 30 days of undergoing PCI.
Table 1 Patient characteristics for patients in the development (with and without exclusions), internal and external validation sets and crude 30-day mortality rates. Results for the internal and external validation cohorts were calculated after the exclusion of missing variables required for completing the risk score
Development set
(without exclusions) Development set (with exclusions) Internal validation set External validation set
n % n % n % n %
Total count 6779 6522 3290 3230
Age Mean±SD 62.6±11.5 62.5±11.6 62.3±11.6 61.8±11.6
Missing 0 0 0 0 – – – –
Sex Male 4856 71.6 4682 71.8 2358 71.7 2360 73.1
Female 1923 28.4 1840 28.2 932 28.3 870 26.9
Missing 0 0 0 0 – – – –
Cardiogenic shock
Yes 63 0.9 57 0.9 23 0.7 56 1.7
No 6642 98 6465 99.1 3267 99.3 3174 98.3
Missing 74 1.1 0 0 – – – –
Diabetes mellitus Yes 955 14.1 934 14.3 473 14.4 675 20.9
No 5701 84.1 5588 85.7 2817 85.6 2555 79.1
Missing 123 1.8 0 0 – – – –
History of renal disease
Yes 106 1.6 103 1.6 36 1.1 113 3.5
No 6531 96.3 6419 98.4 3254 98.9 3117 96.5
Missing 142 2.1 0 0 – – – –
Previous MI Yes 1841 27.2 1784 27.4 907 27.6 828 25.6
No 4165 61.4 4039 61.9 2051 62.3 2263 70.1
Missing 773 11.4 699 10.7 332 10.1 139 4.3
Urgency Elective 2164 31.9 2095 32.1 996 30.3 992 30.7
Urgent 2171 32.0 2135 32.7 1114 33.9 894 27.7
Emergent 2444 36.1 2292 35.1 1180 35.9 1344 41.6
Missing 0 0 0 0 – – – –
30-daymortality Dead 171 2.5 153 2.3 75 2.3 64 2.0
Alive 6608 97.5 6369 97.7 3215 97.7 3166 98.0
Missing 0 0 0 0 – – – –
MI, myocardial infarction.
Table 2 Results of the unimputed multivariate logistic regression model
Variable Coefficient OR
95 %
CIs p Value
Lower Upper
Cardiogenic shock 2.044 7.725 4.033 14.795 <0.001
Diabetes 0.378 1.459 0.947 2.246 0.086
History of renal disease 1.353 3.867 1.885 7.936 <0.001
Age 0.052 1.053 1.038 1.068 <0.001
Urgency (overall) <0.001
Urgent versus elective 0.585 1.795 0.887 3.632 0.104
Emergent versus elective 2.168 8.741 4.786 15.962 <0.001
on September 12, 2020 by guest. Protected by copyright.
P = 1+ee−−8.673+0.052(Age)+2.044(CGS)+0.378(D)+1.353(HxR)+0.585(U1)+2.168(U2)8.673+0.052(Age)+2.044(CGS)+0.378(D)+1.353(HxR)+0.585(U1)+2.168(U2)
where Age, age of patient; CGS, presence (1) or absence (0) of cardiogenic shock; D, presence (1) or absence (0) of diabetes mellitus; HxR, presence (1) or absence (0) of a history of renal disease; U1 and U2, urgency of proce-dure (elective: U1=0, U2=0; urgent U1=1, U2=0; emergent: U1=0, U2=1).
For example, a 75-year-old patient who presented in cardiogenic shock, had no history of diabetes or renal disease and was treated emergently would have log odds=−8.673 + 0.052*(75)+2.044 + 2.168=−0.561. This can be converted into a probability: p= e-0.561/1+e-0.561=
0.363 (36.3%).
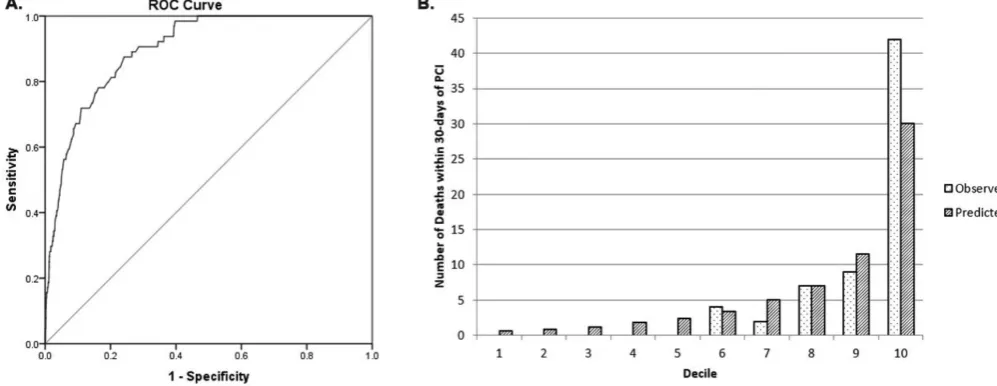
The risk model was then applied to the internal vali-dation set. The discrimination of the model was high (C-statistic=0.81, 95% CI 0.76 to 0.86; figure 2A) and the model was well calibrated, because the risk score predicted 77 deaths and 73 occurred. A Hosmer-Leme-show p=0.39 confirmed no significant difference between observed and predicted mortality (figure 2B).
The model was then recalibrated and applied to the external validation set. The discrimination of the model was high (C-statistic=0.90, 95% CI 0.87 to 0.93; figure 3A) and the model was well calibrated; predicted deaths=64, observed=64. A Hosmer-Lemeshow p=0.07 confirmed no significant difference between observed and predicted mortality (figure 3B).
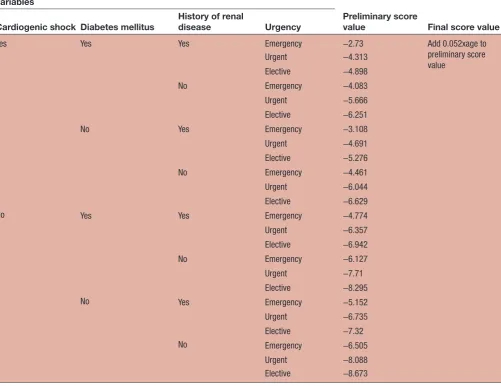
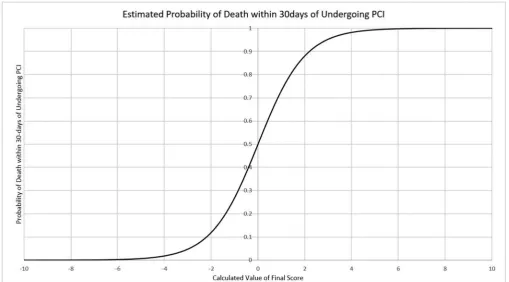
For ease of use, the risk score was then developed into a nomogram described in table 3 and figure 4.
dIscussIon
In this study, we have developed and validated a simple risk score that can predict 30-day mortality after PCI and does not require knowledge of the coronary anatomy. The final five variables that make up the risk score (cardio-genic shock, advanced age, procedural urgency, history of renal disease and diabetes mellitus) are all known prior to intervention and are readily ascertainable.
The variables in the model have been shown to impact outcomes and are used in other risk scores.3–9 11
Cardio-genic shock is one of the most powerful predictor of adverse outcomes.15 16 Increasing age is associated with
an increase in cardiovascular mortality, as well as being
Figure 1 (A) Illustration of the receiver operating characteristic (ROC) curve (discrimination) of the unimputed model on the development set data. C-statistic: 0.82 (95% CI 0.79 to 0.85). (B) Illustration of the ROC curve (discrimination) of the imputed model on the development set data. C-statistic: 0.82 (95% CI 0.79 to 0.85). (C) Illustration of the Hosmer-Lemeshow goodness-of-fit test of mortality observed versus that predicted by the unimputed model by decile of predicted risk in the development set: p value=0.71. (D) Illustration of the Hosmer-Lemeshow goodness-of-fit test of mortality observed versus that predicted by the imputed model by decile of predicted risk in the development set: p value=0.32. PCI, percutaneous coronary intervention.
on September 12, 2020 by guest. Protected by copyright.
a surrogate for comorbidities17 18 which have been
asso-ciated with an increased 30-day mortality post-PCI.19 20
Urgency is used in the risk score as a surrogate for acuity of presentation which is associated with adverse outcomes. Renal impairment has been associated with an increase in mortality post-PCI.21 and diabetes mellitus confers an
increased risk of cardiac mortality.22Left ventricular
ejec-tion fracejec-tion has been included as a variable in a number of scores to predict outcomes post-PCI.3 4 6 9 However,
it was excluded from our analysis as it is seldom known prior to intervention.
A widely used PCI risk score in the UK is the North West Quality Improvement Programme (NWQIP) model, which was developed on data from over a decade ago. However, it is reassuring to observe that three out of five
predictors in our model (age, urgency and cardiogenic shock) were also in the NWQIP model, despite a change in case mix, technology and management strategy over the intermediate years.5 Another model widely used is
US-based New York risk score and its more contempo-rary iteration published in 2013. The strength of this model includes derivation form a very large data set (n=46 090 and n=54 223, respectively). However, due to differences in population mix and management between the USA and Europe including UK, the risk scores may not necessarily be applicable to non-US practice. Integer risk scores such as the Toronto score are no longer neces-sitated in the modern era of computed recording and prediction.6 Nevertheless, we also found common
vari-ables between UK and North American scores.3 4 7 Figure 2 (A) Illustration of the receiver operating characteristic (ROC) curve (discrimination) of the model on the internal validation set data. C-statistic: 0.81 (95% CI 0.76 to 0.86). (B) Illustration of the Hosmer-Lemeshow goodness-of-fit test for observed versus predicted mortality by decile of predicted risk in the internal validation set: p value= 0.39. PCI, percutaneous coronary intervention.
Figure 3 (A) Illustration of the receiver operating characteristic (ROC) curve (discrimination) of the recalibrated model on the external validation set data. C-statistic: 0.90 (95% CI 0.87 to 0.93). (B) Illustration of the Hosmer-Lemeshow goodness-of-fit test for observed versus predicted mortality by decile of predicted risk in the external validation set: p value=0.07. PCI, percutaneous coronary intervention.
on September 12, 2020 by guest. Protected by copyright.
With the exception of the model produced by McAl-lister et al, no complete prediction of outcome can be ascertained prior to intervention, using only clinical vari-ables. The model took advantage of a large data set and was developed using results from multiple centres across the UK. Both models include age, diabetes, renal disease, indication/urgency and cardiogenic shock as predictors of outcome. Interestingly, our model compares favour-ably (validation C-statistic: 0.86 vs 0.90, (95% CI 0.87 to 0.93); H-L: both non-significant) despite requiring four fewer variables suggesting that the data that were used to develop the model is in line with UK practice and could therefore potentially be applied widely.11 Overall, the
performance of the model was favourable in comparison with all other risk scores that predict outcome post-PCI in terms of discriminating between those who did and did not die within 30 days (C-statistic) and in terms of predicted versus observed 30-day mortality (non-signifi-cant Hosmer- Lemeshow).3–9 11
There was an increase in the discrimination ability of the model described here in the external validation
cohort (C-statistic=0.90, 95% CI 0.87 to 0.93) compared with the development cohort (C-statistic=0.82, 95% CI 0.78 to 0.85) and the internal validation cohort (C-sta-tistic=0.81, 95% CI 0.76 to 0.86). The slightly higher discrimination in the external cohort may be the play of chance. However, following reviewer's comments, we looked at the patient characteristics in the three groups and found that patients in the external cohort had higher proportion of cardiogenic shock (development: 0.9%, internal validation: 0.7%, external validation: 1.7%), diabetes mellitus (development: 14.3%, internal validation: 14.4%, external validation: 20.9%) and history of renal disease (development: 1.6%, internal valida-tion: 1.1%, external validavalida-tion: 3.5%), all of which are included in the risk model. This may have resulted in better discrimination in this cohort.
study limitations
The risk model is based on data from a single centre; however, it was validated in another UK centre. Second, the numbers of patients included, while large for an
Table 3 A table to calculate the risk of a specific patient. To be used in conjunction with figure 4 Patient
variables
Preliminary score
value Final score value
Cardiogenic shock Diabetes mellitus History of renal disease Urgency
Yes Yes Yes Emergency −2.73 Add 0.052xage to
preliminary score value
Urgent −4.313
Elective −4.898
No Emergency −4.083
Urgent −5.666
Elective −6.251
No Yes Emergency −3.108
Urgent −4.691
Elective −5.276
No Emergency −4.461
Urgent −6.044
Elective −6.629
No Yes Yes Emergency −4.774
Urgent −6.357
Elective −6.942
No Emergency −6.127
Urgent −7.71
Elective −8.295
No Yes Emergency −5.152
Urgent −6.735
Elective −7.32
No Emergency −6.505
Urgent −8.088
Elective −8.673
on September 12, 2020 by guest. Protected by copyright.
individual centre, are limited by comparison with national data. Third, adverse events were relatively rare among the cohort. Finally, patients for whom variables were missing were not included in the study, though the congruence between the unimputed and imputed models derived from the development set suggest that missing variables in the development cohort were missing at random. More general limitations include the inability to predict an individual’s risk with a high level of accuracy, and the ignorance of rare but signifi-cant predictors of outcome such as advanced metastatic disease. For these reasons, this risk score should only be used to guide clinical decisions, not make them, though the risk score may have a role in the adjust-ment of operator and institutional mortality statistics and protection against risk-averse behaviour and litiga-tion.1 2 The inherent complexity of multivariate logistic
regression often, as in this case, leads to a complicated equation. Some authors have dealt with this problem by rounding the OR of a variable to an integer. But variables are routinely entered into a database that is capable of computing a non-integer risk score, so this may be an unnecessary simplification. We also devel-oped a nomogram so a crude estimation of risk could be estimated with a relatively simple calculation.
clinical implications
There are numerous existing risk scores to predict adverse outcomes after PCI, but this risk score is the only recent model that predicts 30-day mortality using only five variables that are known prior to intervention.3–9 11
The model described here offers a quick and reliable risk prediction that can help PCI operators to make more informed decision. The use of variables known prior to intervention also allows patients to be fully informed before they consent to an invasive procedure with poten-tial risks. In the current era, where PCI outcomes are available to public scrutiny, a risk score is the appropriate tool to protect operators from falsely elevated adverse outcome statistics, and to protect patients from risk-averse decisions.2 23 We believe that in modern practice, there is
little added advantage of an integer score. To make calcu-lation easy, we are aiming to develop a mobile/desktop application (app) for this score, which can truly be used at the bedside. In summary, we have developed and vali-dated a clinical risk score for PCI which is easy to use prior to intervention in modern practice.
Author affiliations
1Infection, Immunity and Cardiovascular Disease, University of Sheffield, Sheffield,
UK
2South Yorkshire Cardiothoracic Centre, Sheffield, UK 3Sheffield School for Health and Related Research, Sheffield, UK
4Freeman Hospital, Newcastle Upon Tyne Hospitals Foundation Trust, Newcastle
Upon Tyne, UK
5Bristol Heart Institute, Bristol, UK 6University of Bristol, Bristol, UK
7Faculty of Medicine, Imperial College London, London, UK 8Manchester Royal Infirmary, Manchester, UK
9BM Birla Heart Research Centre, Kolkata, India 10Insigneo Institute for In Silico Medicine, Sheffield, UK
Acknowledgements We are grateful to Louisa Yates for database preparation and
interrogation of the UK national mortality statistics.
Figure 4 A graph describing the relationship between the calculated value of final score derived from table 3and the probability of death within 30 days of undergoing percutaneous coronary intervention (PCI).
on September 12, 2020 by guest. Protected by copyright.
Contributors JG originated the idea, supervised the project and critically appraised the manuscript. JG is the guarantor. JJSW analysed the data, developed and validated the risk score and wrote the draft paper. JI assisted with statistical analysis of the data, sourced data for external validation and critically appraised the manuscript. MA assisted with data analysis. DT supervised the statistics. MG, TH, ST and LQ performed preliminary work on risk analysis. ME-O and DGF sourced data for external validation. AS originated a preliminary risk score model and all the above critically appraised the manuscript.
Competing interests None declared.
Patient consent Detail has been removed from this case description/these case
descriptions to ensure anonymity. The editors and reviewers have seen the detailed information available and are satisfied that the information backs up the case the authors are making.
Provenance and peer review Not commissioned; externally peer reviewed.
Open Access This is an Open Access article distributed in accordance with the
Creative Commons Attribution Non Commercial (CC BY-NC 4.0) license, which permits others to distribute, remix, adapt, build upon this work non-commercially, and license their derivative works on different terms, provided the original work is properly cited and the use is non-commercial. See: http:// creativecommons. org/ licenses/ by- nc/ 4. 0/
© Article author(s) (or their employer(s) unless otherwise stated in the text of the article) 2017. All rights reserved. No commercial use is permitted unless otherwise expressly granted.
RefeRences
1. Farooq V, Brugaletta S, Serruys PW. Contemporary and evolving risk scoring algorithms for percutaneous coronary intervention. Heart 2011;97:1902–13.
2. Siotia A, Gunn J. Risk scoring for percutaneous coronary intervention: let's do it!. Heart 2006;92:1539–40.
3. Wu C, Hannan EL, Walford G, et al. A risk score to predict in-hospital mortality for percutaneous coronary interventions. J Am Coll Cardiol 2006;47:654–60.
4. Hannan EL, Farrell LS, Walford G, et al. The New York State risk score for predicting in-hospital/30-day mortality following percutaneous coronary intervention. JACC Cardiovasc Interv 2013;6:614–22.
5. Grayson AD, Moore RK, Jackson M, et al. North West Quality Improvement Programme in Cardiac Interventions. Multivariate prediction of major adverse cardiac events after 9914 percutaneous coronary interventions in the north west of England. Heart
2006;92:658–63.
6. Chowdhary S, Ivanov J, Mackie K, et al. The Toronto score for in-hospital mortality after percutaneous coronary interventions. Am
Heart J 2009;157:156–63.
7. Brennan JM, Curtis JP, Dai D, et al. National Cardiovascular Data Registry. Enhanced mortality risk prediction with a focus on high-risk percutaneous coronary intervention: results from 1,208,137 procedures in the NCDR (National Cardiovascular Data Registry).
JACC Cardiovasc Interv 2013;6:790–9.
8. Singh M, Lennon RJ, Holmes DR, et al. Correlates of procedural complications and a simple integer risk score for percutaneous coronary intervention. J Am Coll Cardiol 2002;40:387–93.
9. Singh M, Rihal CS, Lennon RJ, et al. Bedside estimation of risk from percutaneous coronary intervention: the new Mayo Clinic risk scores.
Mayo Clin Proc 2007;82:701–8.
10. Iqbal J, Vergouwe Y, Bourantas CV, et al. Predicting 3-year mortality after percutaneous coronary intervention: updated logistic clinical SYNTAX score based on patient-level data from 7 contemporary stent trials. JACC Cardiovasc Interv 2014;7:464–70.
11. McAllister KS, Ludman PF, Hulme W, et al. British Cardiovascular Intervention Society and the National Institute for Cardiovascular Outcomes Research. A contemporary risk model for predicting 30-day mortality following percutaneous coronary intervention in England and Wales. Int J Cardiol 2016;210:125–32.
12. Hanley JA, McNeil BJ. The meaning and use of the area under a receiver operating characteristic (ROC) curve. Radiology 1982;143:29–36.
13. Hosmer DW, Lemeshow S, Sturdivant RX. Applied Logistic
regression. 3rd Edition3rd Edition: Applied Logistic Regression,
2013:1–500.
14. Using the Receiver operating characteristic (ROC) curve to analyze a
classification model: The University of Utah, 2010.
15. Hochman JS. Cardiogenic shock complicating acute myocardial infarction: expanding the paradigm. Circulation 2003;107:2998–3002. 16. Iqbal J, Sumaya W, Tatman V, et al. Incidence and predictors of stent
thrombosis: a single-centre study of 5,833 consecutive patients undergoing coronary artery stenting. EuroIntervention 2013;9:62–9. 17. Hafiz AM, Jan MF, Mori N, et al. Contemporary clinical outcomes
of primary percutaneous coronary intervention in elderly versus younger patients presenting with acute ST-segment elevation myocardial infarction. J Interv Cardiol 2011;24:357–65. 18. Batchelor WB, Anstrom KJ, Muhlbaier LH, et al. Contemporary
outcome trends in the elderly undergoing percutaneous coronary interventions: results in 7,472 octogenarians. J Am Coll Cardiol 2000;36:723–30.
19. Midwall S, Swaminathan RV, Charitakis K, et al. Impact of peripheral vascular disease on short- and long-term outcomes in patients undergoing non-emergent percutaneous coronary intervention in the drug-eluting stent era. J Invasive Cardiol 2013;25:132–6.
20. Saw J, Bhatt DL, Moliterno DJ, et al. The influence of peripheral arterial disease on outcomes: a pooled analysis of mortality in eight large randomized percutaneous coronary intervention trials. J Am
Coll Cardiol 2006;48:1567–72.
21. Rothman MT, Jain AK. E-Five Registry Investigators. Outcomes in patients with renal impairment undergoing percutaneous coronary intervention and implantation of the Endeavor zotarolimus-eluting stent: 1- and 2-year data from the E-Five Registry. Catheter
Cardiovasc Interv 2012;80:885–92.
22. Jensen LO, Maeng M, Thayssen P, et al. Influence of diabetes mellitus on clinical outcomes following primary percutaneous coronary intervention in patients with ST-segment elevation myocardial infarction. Am J Cardiol 2012;109:629–35.
23. McCabe JM, Joynt KE, Welt FG, et al. Impact of public reporting and outlier status identification on percutaneous coronary intervention case selection in Massachusetts. JACC Cardiovasc Interv
2013;6:625–30. on September 12, 2020 by guest. Protected by copyright.