R E S E A R C H
Open Access
HPOAnnotator: improving large-scale
prediction of HPO annotations by low-rank
approximation with HPO semantic
similarities and multiple PPI networks
Junning Gao
1, Lizhi Liu
1, Shuwei Yao
1, Xiaodi Huang
2, Hiroshi Mamitsuka
3,4and Shanfeng Zhu
1,5,6*FromIEEE International Conference on Bioinformatics and Biomedicine (2018) Madrid, Spain, 3-6 December 2018
Abstract
Background: As a standardized vocabulary of phenotypic abnormalities associated with human diseases, the Human Phenotype Ontology (HPO) has been widely used by researchers to annotate phenotypes of genes/proteins. For saving the cost and time spent on experiments, many computational approaches have been proposed. They are able to alleviate the problem to some extent, but their performances are still far from satisfactory.
Method: For inferring large-scale protein-phenotype associations, we propose HPOAnnotator that incorporates multiple Protein-Protein Interaction (PPI) information and the hierarchical structure of HPO. Specifically, we use a dual graph to regularize Non-negative Matrix Factorization (NMF) in a way that the information from different sources can be seamlessly integrated. In essence, HPOAnnotator solves the sparsity problem of a protein-phenotype association matrix by using a low-rank approximation.
Results: By combining the hierarchical structure of HPO and co-annotations of proteins, our model can well capture the HPO semantic similarities. Moreover, graph Laplacian regularizations are imposed in the latent space so as to utilize multiple PPI networks. The performance of HPOAnnotator has been validated under cross-validation and independent test. Experimental results have shown that HPOAnnotator outperforms the competing methods significantly.
Conclusions: Through extensive comparisons with the state-of-the-art methods, we conclude that the proposed HPOAnnotator is able to achieve the superior performance as a result of using a low-rank approximation with a graph regularization. It is promising in that our approach can be considered as a starting point to study more efficient matrix factorization-based algorithms.
Keywords: Low-rank approximation, Human phenotype ontology, Protein-protein interaction networks, Hierarchical structure
*Correspondence:[email protected]
1School of Computer Science and Shanghai Key Laboratory of Intelligent Information Processing, Fudan University, 220 Handan Road, 200433, Shanghai, China
5Shanghai Institute of Artificial Intelligence Algorithms and ISTBI, Fudan University, 200433 Shanghai, China
Full list of author information is available at the end of the article
Background
Phenotypes refer to observable physical or biological traits of an organism. Revealing the relationships between genes/proteins and their related phenotypes is one of the main objectives of genetics in the post-genome era [1–3]. The Human Phenotype Ontology (HPO) [4] is a standardized vocabulary for describing the phenotypic abnormalities associated with human diseases [5]. Being initially populated by using databases of human genes and genetic disorders such as OMIM [6], Orphanet [7] and DECIPHER [8], HPO was later expanded by using literature curation [9]. At present, only small quantities of human protein-coding genes (∼ 3500) have HPO annotations. It is, however, believed that a large num-ber of currently unannotated genes/proteins are related to disease phenotypes. Therefore, it is critical to pre-dict genes/protein-HPO associations by using accurate computational methods.
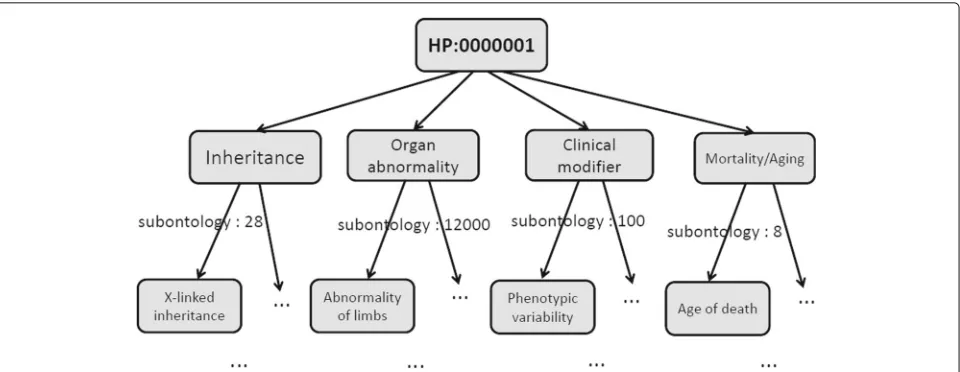
Currently, HPO contains four sub-ontologies: Organ abnormality, Mode of inheritance, Clinical modifier, and Mortality/Aging. As the main sub-ontology, Organ abnor-mality describes clinical abnormalities whose first- level children are formed by terms like abnormality of a skele-tal system. The Mode of inheritance describes inheritance patterns of phenotypes and contains terms such as Auto-somal dominant. The Clinical modifier contains classes that describe typical modifiers of clinical symptoms such as those triggered by carbohydrate ingestion. For Mortal-ity/Aging, it describes the age of death by terms like Death in childhood and Sudden death. The Organ abnormal-ity, Mode of inheritance, Clinical modifier, and Mortal-ity/Aging have∼12000, 28, 100, and 8 terms, respectively. The annotations between genes/proteins and HPO terms are very sparse. Specifically, 284621 annotations are for 3459 proteins and 6407 HPO terms with the spar-sity of 1.2%. Meanwhile, the annotation growth by time, for example, is about 5%, with adding only 14820 annota-tions as new ones between June 2017 to December 2017. Since genes/proteins are annotated with multiple HPO terms, the prediction can be regarded as a problem of multi-label predictions. Differing from this, HPO terms, however, form a hierarchical structure. This implies that once a gene/protein is labeled with one HPO term, it should also be labeled with all of its ancestors of this par-ticular HPO term. In other words, when a gene/protein is not labeled with an HPO term, it should not be labeled with all of its descendants, either. That is, general terms are located at the top of the HPO structure, with the term specificity increasing from the root to the leaves. Figure 1 shows a real example of an HPO hierarchical structure (i.e., Directed Acyclic Graph, DAG) and the scale of sub-ontologies.
The existing computational approaches for HPO anno-tation prediction can be divided into two categories,
namely feature-based and network-based methods. The feature-based approaches use gene/protein information as the features to predict its annotations for a query gene/protein. For sparse and noisy data, the incorporation of auxiliary information into original input data generally helps to improve predictive performance. One of these methods, learning to rank, has been demonstrated the superior performance in GO annotation prediction [10], for example. Compared with GO annotations, HPO anno-tations are, however, more reliable and stable. In addition, the sparseness of HPO annotations is much less than that of GO annotations, with focusing on human proteins and terms under Organ abnormality only. Nevertheless, few existing feature-based models take into consideration HPO information, e.g., the hierarchical structure and co-occurrence of HPO terms. The network-based approaches are more prevalent at present. Usually, multiple networks are integrated into a new large-scale network in order to improve the prediction in these approaches such as random-walk [11] and weighted score computation [12]. However, network-based approaches cannot perform well for sparse data. This is because of disconnected nodes that are commonly encountered in real-world graphs, partic-ulary for sparse data, even though they can be related to each other.
Fig. 1An example of the HPO hierarchical tree. All parent-child relationships in HPO represent “is-a” relationships. X-linked inheritance, Abnormality of limbs, Phenotypic variability, and Age of death are examples for sub-ontologies Mode of inheritance, Organ abnormality, Clinical modifier, and Mortality/Aging, respectively
annotations. It is likely that they help improve prediction results.
To address the above four problems, we apply matrix factorization to approximate a protein-HPO annotation matrix by two factorized low-rank matrices. As such, the latent factors that underlie the HPO annotations can be well captured. Since the HPO annotation matrix is binary, we choose to use Non-negative Matrix Factoriza-tion (NMF). NMF has proved to be effective for sparse problems in the field of bioinformatics [13–16]. Based on our above observations, we propose an NMF-based framework called HPOAnnotator by which to predict missing protein-HPO annotations. In essence, the key idea of our model is to factorize the HPO annotation matrix into two non-negative low-rank latent matrices, which correspond to the respective latent feature spaces of proteins and HPO terms. In addition, the graph Laplacian on PPI networks is performed to exploit their intrinsic geometric structure. Co-annotations and the hierarchical structure of HPO are also incorporated to measure HPO semantic relationships.
We have experimentally validated the performance of HPOAnnotator by comparing it with the three network-based approaches, which will be reviewed in the related work. The proposed model was tested on the latest large-scale HPO data with around 300000 annotations. Exper-imental results clearly demonstrated that HPOAnnotator outperformed the competing methods under two scenar-ios: cross-validation and independent test. It indicates that a low-rank approximation and network information are effective for pair prediction. Furthermore, our case studies further provide evidence for the practical use of HPOAn-notator. Note that, the work presented in this paper is
the extension of our previous work AiProAnnotator [17] (AiPA for short). The main difference between the two methods is that HPOAnnotator can seamlessly combine multiple rather than single PPI networks and then benefit from them.
Related work
As mentioned before, we can group the existing approaches to HPO annotations into two categories: feature-based and network-based ones.
Two well-known methods of feature-based approaches are PHENOstruct [9] and Clus-HMC-Ens [18]. Clus-HMC-Ens applies the decision tree ensembles, while PHENOstruct (the extension of GOstruct which was designed to predict GO annotations) relies on the Struc-tural Support Vector Machine (SSVM). Together with HPO annotations (i.e., labels) of each protein, a feature-based method normally accepts feature vectors as the input of a classifier. The trained classifier is then used to make a prediction. The above procedure is the same for both two categories of approaches. Additionally, it is worth noting that PHENOstruct and Clus-HMC-Ens were originally developed for GO but then applied to HPO annotation prediction. In this sense, the difference between HPO annotations and GO annotations has not been fully taken into account by researchers.
following, we review the three methods as representatives of network-based approaches, all of which are compared against our proposed approach in the experiments.
Bi-random walk
Bi-Random Walk (BiRW) [19,20] has been demonstrated as a useful method for the bi-network prediction problem. BiRW performs random walks on the Kronecker product graph between PPN and NHPO in a way that they can be combined effectively for the protein-phenotype associa-tion predicassocia-tion. The random walks iteratively performed by BiRW follow the equation:
Yt=αPYt−1G+(1−α)Y (1)
whereα >0 is a decay factor, P and G are the normalized PPN and NHPO matrix, respectively. Yt is the estima-tion of associaestima-tions at iteraestima-tiont, andYdenotes the initial annotations in the training data. By introducing BiRW to capture the circular bigraphs patterns in the networks, the model can unveil phenome-genome associations over time.
Dual label propagation model
The label propagation-based algorithm has been success-fully applied to predict phenotype-gene associations in various forms [21,22]. With the following objective func-tion, label propagation assumes that proteins should be assigned to the same label, if they are connected in a PPN:
(y)=θ np
i,j=1 ¯
Sp(yi−yj)2+
i
(yi−yi)2
=θyTLSy+(1−θ)y−y2
(2)
where S¯p is a normalized PPN defined as S¯p = D−12SpD−12, and D is a diagonal matrix with the row-sum
of Spon the diagonal entries. Equation2can be rewritten as follows:
(Y)=θtr(YTLSY)+(1−θ)Y−Y2F (3) where tr(·)denotes the trace of matrix,·F denotes the Frobenius norm, and LSis the normalized graph Laplacian matrix ofS¯pdefined as LS=I− ¯Sp.
The Dual Label Propagation model (DLP) [23] extends the label propagation model by adding two smooth-ness terms. The first term imposes the smoothsmooth-ness in a PPN such that interacting proteins tend to be associated with the same HPO term. The second term imposes the smoothness in NHPO in a way that the connected pheno-types (parent-child pair) are encouraged to be associated with the same protein. The objective function of DLP is given as:
(Y)= (Y−Y)2F+βtr(YTLSY)+γtr(YLGYYT) (4)
where β,γ ≥ 0 are tuning parameters, LS and LGY encode the PPN and NHPO information, respectively. is the binary indicator matrix that selects only the known associations to be penalized, and denotes Hadamard product (a.k.a entrywise product).
Ontology-guided group lasso
The last method to be reviewed is Ontology-guided Group Lasso (OGL) [24]. It uses an ontology-guided group norm for HPO, rather than the graph regularizer in DLP. By combining label propagation and an ontology-guided group lasso norm derived from the hierarchical structure of HPO, OGL updates estimation, according to the following objective function:
(Y)= (Y−Y)2F+βtr(YTLSY)+γ np
i=1
g∈GY
rYgY(g)i2
(5)
where β,γ ≥ 0 are balancing factors. rY
g is the group weight for group g. Y(g)i selects the group members of group g from the i-th column of Y, and the smooth-ness is imposed through the 2-norm group lasso (·2)
among the members for the consistent prediction within the group. A notable difference between OGL and our model is that the estimated matrix is not factorized into low-rank matrices.
One of the biggest drawbacks of network-based meth-ods is that data sparseness has a significant impact on the performance. As mentioned before, the current HPO annotations are quite sparse. In addition, all of the net-work based-methods suffer the heavy computational bur-den, as they accept a large-scale protein-HPO annotation matrix as an input directly.
Methods Notation
Let Y∈ {0, 1}Np×Nhbe a protein-HPO annotation matrix, where NpandNh are the number of proteins and HPO terms, respectively. If protein iis annotated by an HPO term j, then Yij = 1, and 0 otherwise. We define Spk (k = 1, 2,· · ·,t) be the networks for proteins, namely PPNs, wheretis the total number of networks. Spki,j rep-resents the strength of the relationship between protein i and proteinj in thek-th PPN. Similarly, let Sh be the network of HPO terms which is generated from an ontol-ogy structure and co-annotations, and Shi,jis the similarity value between termiand termj. Our goal is to estimateYˆ given Y, Spkand Sh.
Our proposed method
Preprocessing: generating a network from HPO
hierarchy. We adopt the measure proposed in [25]. Hav-ing been extensively used in natural language processHav-ing, this metric defines the semantic similarity between two labeled nodes by counting the co-occurrence frequency in a corpus.
Specifically for HPO, the semantic similarity between two termssandtis defined as:
Shs,t= 2·I(mca(s,t))
I(s)+I(t) (6)
whereI(s) =log(p(s))andp(s)= countNp(s). Here, count(s) denotes the number of proteins annotated by termsand mca(s,t)is given as follows:
mca(s,t)=arg min k∈A(s,t)p(k)
where A(s,t)represents the set of all common ancestors ofsandt.
The weight of the edge between nodessandtin NHPO is exactly the similarity score. The larger the number of annotated proteins shared by s and t, the higher their similarity score is. It is more likely to happen when the common ancestor ofsandtis located closely. This means that Sh considers both the co-annotations of two HPO terms and their distance in a hierarchical structure.
Non-negative matrix factorization
The aim of Non-negative Matrix Factorization (NMF) is to find two low-rank matrices with all non-negative ele-ments by approximating the original input matrix. In fact, the latent factors that underlie the interactions are cap-tured. Mathematically, the input matrix Y∈RNp+×Nh is decomposed into two rank-Kmatrices, U ∈ RNp+×K and V ∈ RNh+×K. Then, finding U and V can be done by minimizing the reconstruction error which is defined as:
J= Y−UVT2F, s.t.U≥0, V≥0 (7)
Generally, the2 (Tikhonov) regularization is imposed to Eq. (7) so as to alleviate overfitting of U and V.
Since there are unknown (missing) entries in Y, we encode the missingness with a masking matrix W ∈ {0, 1}Np×Nh. If the annotation between proteiniand HPO term j is missing, we set Wij = 0. Otherwise, we set Wij = 1, meaning that the element Yij is observed. Accordingly, W is also plugged as an extra input into our model. Together with the2-norm regularization terms, the objective function is refined as follows:
JNMF=W(Y−UVT)2F
+λ(U2F+ V2F), s.t.U≥0, V≥0 (8) whereλis a regularization coefficient.
The unobserved protein-HPO associations are com-pleted by multiplying two factor matrices, or concretely,
ˆ
Y=UVT.
Network regularization
Once we obtain the similarity matrix of HPO, Sh, we can regularize V with the help of it. The basic idea is to impose smoothness constraints on the phenotype-side factors; that is
1 2
i,j
Shi,jVi−Vj2
= tr(VT(Dh−Sh)V) = tr(VTLhV)
(9)
where Vi is the i-th row vector of V, Dh is a diagonal matrix whose diagonals are the node degrees, and Lh = Dh−Shis the graph Laplacian of Sh. Actually, the term is exactly the vanilla graph regularizer.
For proteins, multiple PPNs are derived from diverse data sources with heterogeneous properties. In this way, for a collective of PPNs Spk(k=1,· · ·,t), their regularizer is imposed as
t
k=1
tr(UTLpkU), (10)
where Lpk =Dpk −Spk is the graph Laplacian ofSpk, and Dpkis the degree matrix.
Minimization of graph-based regularization terms will lead to the learned data representations (U and V) that respect the intrinsic geometrical structure of original data spaces (Spk and Sh). Note that such standard graph regularization has already been used in a variety of applications [26].
Model formulation
By combining (8), (9) and (10), our model is formulated as follows:
min
U≥0,V≥0W(Y−UV
T)2
F+λ(U2F+ V2F)
+α t
k=1
tr(UTLpkU)+βtr(VTLhV)
(11)
where α and β are regularization coefficients to strike a balance between the reconstruction error and graph smoothness.
Model optimization
Notice that the objective function defined in Eq. (11) is biconvex with respect to U and V. A very regular but effective procedure for fitting is Alternating Least Square (ALS), which alternately optimizes one of the variables by fixing the others as constants until convergence.
We first hold U fixed and derive the updating rule of V. The objective function of V can be written as:
Accordingly, the derivative ofJ(V)with respect to V is
∂J(V)
∂V = −2(WY)
TU+2(WUVT)TU+2λV+2βLhV
(13)
Taking the Karush-Kuhn-Tucker (KKT) complementary condition, we obtain
[(WUVT)TU−(WY)TU+λV+βLhV]ijVij=0 (14)
Now let us rewrite Lh=Lh+−Lh−, where we have Lh+=
(|Lh| +Lh)/2 and Lh−=(|Lh| −Lh)/2. The multiplicative update rule of V is then:
Vij←−Vij
(WY)TU+βLh−V
(WUVT)TU+λV+βLh+V (15)
Note that the problem given by (11) is symmetric in terms of U and V. Therefore, the derivation of the updat-ing rule of U is simply the reverse of the above case. Precisely, we have
Uij←−Uij
(WY)V+αtk=1(Lpk−U)
(WUVT)V+λU+αt
k=1(Lpk+U)
(16)
Training algorithm
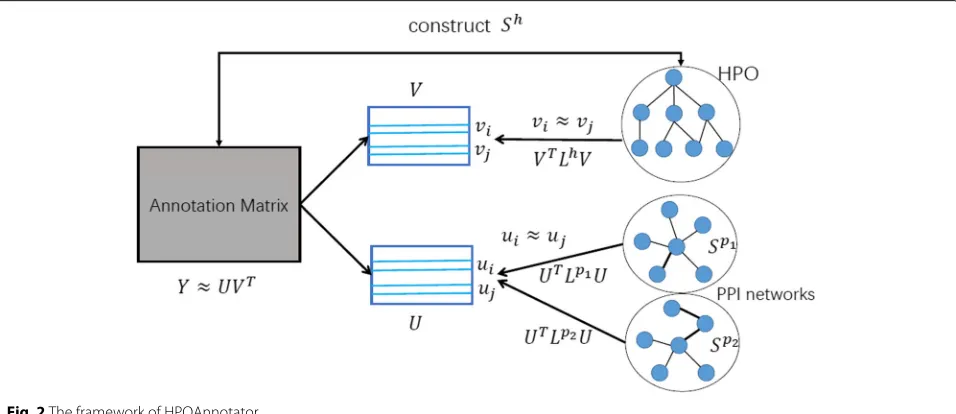
We describe the overall framework of HPOAnnotator in Fig. 2. The procedure of our optimization process is presented in Algorithm 1. The optimization was imple-mented based on the MATLAB code provided by [26].
Algorithm 1The training algorithm of HPOAnnotator Require: Protein-HPO annotation matrix: Y∈RNp×Nh;
Mask of observed entries: W∈ {0, 1}Np×Nh; Protein-protein networks (PPNs): Spk ∈RNp×Np; Hierarchical structure of HPO
Ensure: U, V.
1: Generate the network of HPO terms, i.e. NHPO, Sh by (6).
2: repeat
3: Update V by (15) . 4: Update U by (16). 5: until convergence 6: return: U, V andYˆ =UVT
Results Data
HPO annotations
Two HPO annotation datasets released by June 2017 and December 2017 were downloaded from the official HPO website (https://hpo.jax.org/). For the sake of brevity, we call them Data-201706 and Data-201712 in the following, respectively. The true-path-rule is applied here to propagate annotations, and only HPO terms with at least one related pro-tein remains. Table 1 lists the statistics of the two datasets.
According to the number of proteins annotated, we sep-arated the HPO terms into five groups: 1 to 10, 11 to 30, 31 to 100, 101 to 300, and more than 300. Figure3shows the percentage of HPO terms and corresponding annotations over five groups in Data-201706.
Table 1Statistics of two datasets: Data-201706 and Data-201712
Dataset Data-201706 Data-201712
#Proteins 3,459 3,644
#HPO terms 6,407 6,642
#Leaves of HPO 4,092 4,274
#Annotations 284,621 317,443
Ave. #annotations per protein 82.28 87.11
Ave. #annotations per HPO term 44.42 47.79
NHPO (Network of HPO)
We downloaded the hierarchical structure of HPO from their official website.
PPN (Protein-Protein Network)
Four types of PPNs were used in our experiments; that is, STRING [27] (https://string-db.org/), GeneMANIA [28] (http://genemania.org/data/), BioGRID [29] (https:// downloads.thebiogrid.org/BioGRID), and Reactome [30] (https://reactome.org/download-data). Table 2 reports the statistics of these four networks. Note that STRING is the most famous PPI network, which was found very useful for predicting HPO annotations in [9]. It com-bines diverse data sources, including expression, co-occurrence, fusion, neighborhood, genetic interactions, and physical interactions, by assigning a confidence score to a certain pair of proteins for indicating its reliability.
A preliminary test on pairs of two HPO terms in NHPO: the correlation between the number of shared proteins and the average similarity
First, we grouped all pairs of two HPO terms (from NHPO), according to the number of proteins, say M,
Fig. 3HPO terms are divided into five groups according to the number of proteins they annotate. The number of HPO terms per group (the left-hand side of each group) and the total number of annotations per group (the right-hand side of each group) are shown for Data-201706
Table 2Statistics of PPNs of Data-201706
Dataset #Annotations #Connect-proteins
STRING 214,410 3,342
GeneMANIA 206,900 3,385
BioGRID 10,752 2,725
Reactome 970 1,051
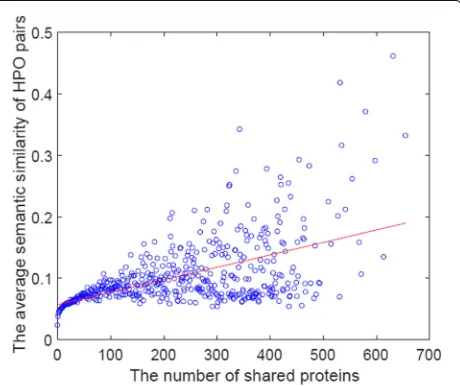
shared by the two HPO terms. For each group, we then computed the average similarity score (Sh) by NHPO over those sharingMproteins. Finally, we plotted each group over the two-dimensional space ofM×the average simi-larity score. Figure4shows the result. The similarity score is equal to the edge weight of NHPO. This means that this test would be evaluated on the consistency of the similar-ity with the number of shared proteins from each HPO term pair. There found some correlations between these two, which would be a positive support for using NHPO for HPO annotations.
A preliminary test on pairs of protein-protein edges in a PPN: correlations between the average similarity by a PPN and #shared HPO
Considering the extensiveness, we chosen STRING as the research object. At first step, we grouped all pairs of two proteins, according to the number of their shared HPO terms, denoted asK. For each group, we then computed the average of similarity score (Sp) of STRING PPN over those sharing the same number of HPO terms. Finally, we plotted each group over the two-dimensional space of the average score (similarity)×K. Figure5shows the plotted
Fig. 4Each circle is a pair of two HPO terms in NHPO, with sharing the same numbers of proteins, sayM. They-axis is the average similarity score between two HPO terms over those proteins sharing the same
Fig. 5Each circle is a pair of two proteins in STRING PPN, with sharing the same numbers of HPO terms, sayK. Thex-axis is the average similarity score between two proteins over those HPO terms sharing the sameK, and they-axis isK, i.e., the number of shared HPO terms. The red line shows the trend, which is fitted by a polynomial function with the maximum degree of three
results. The line in this figure shows that the polynomial trend line is fitted to the distributed points of the two-dimensional space. It shows a slightly positive correlation between the number of shared HPO terms and the aver-age similarity score by a PPN. This observation validates the idea that the edges in a PPN may imply that proteins connected by the edges share the same HPO.
Evaluation criteria
The performance is evaluated from three aspects. Annotation-centric measure Each annotation (or a protein-HPO term pair) is viewed as one instance. The models are evaluated using Area Under the receiver oper-ator characteristics Curve (AUC) [31]. Considering the sparseness of protein-HPO association matrix, we mea-sure the Area Under the Precision-Recall curve (AUPR) as well.
Protein-centric measure AUCs (AUPRs) are calculated for each protein based on the corresponding predictive
scores by all available HPO terms. Then the computed AUCs (AUPRs) are averaged over all proteins, resulting in micro-AUC (micro-AUPR).
HPO term-centric measure We think that the term-centric measure is important. Typical scientists or biolo-gists focus first on a certain HPO term and are interested in obtaining genes/proteins, which can be annotated by the focused HPO term. The HPO term-centric measure can be computed in a total reverse manner of the protein-centric measure, with the following two steps: 1) AUCs (AUPRs) are first computed for each HPO term; and 2) The computed AUCs (AUPRs) are averaged over all HPO terms, which result in macro-AUC (macro-AUPR). In addition, we average the computed AUCs (AUPRs) over HPO terms at only leaves of the HPO hierarchical structure. We call the obtained AUC (AUPR) leaf-AUC (leaf-AUPR).
We further calculate the macro-AUCs (macro-AUPRs) for each of the five groups, which are generated by focus-ing on the number of annotations per HPO term (see Fig. 3). In total, (from annotation-, protein-, and HPO term-centric measures) we have the eight criteria to vali-date the performance.
Experimental procedures Parameter settings
Our approach is compared with three network-based methods: BiRW [20], DLP [23] and OGL [24] as described in related work. Besides, we take Logistic Regression (LR) as a feature-based baseline. Note that LR classifiers are trained on each single HPO term independently, and the features are built by concatenating association scores in PPNs together.
The parameter of BiRW is selected from {0.1, 0.2,· · ·, 0.9}. Regularization coefficients (i.e., hyper-parameters) of DLP and OGL, β and γ are selected from{10−6, 10−5,· · ·, 106}. Note that the ranges of these parameters are specified by following [23]. Our model has four parameters:K,α,βandλ, which are determined by internal five-fold cross-validation, where the training
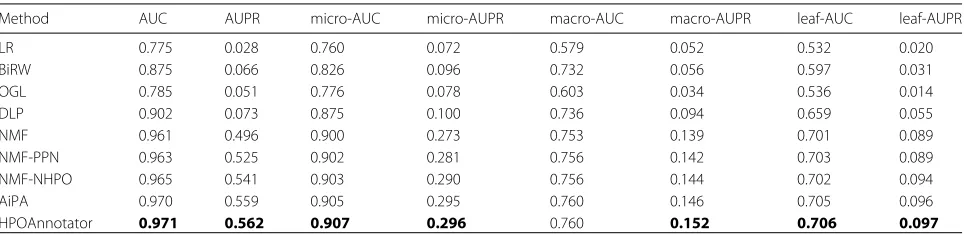
Table 3The results of the eight criteria obtained by 5×5-fold cross-validation over Data-201706 for the nine competing methods in total
Method AUC AUPR micro-AUC micro-AUPR macro-AUC macro-AUPR leaf-AUC leaf-AUPR
LR 0.775 0.028 0.760 0.072 0.579 0.052 0.532 0.020
BiRW 0.875 0.066 0.826 0.096 0.732 0.056 0.597 0.031
OGL 0.785 0.051 0.776 0.078 0.603 0.034 0.536 0.014
DLP 0.902 0.073 0.875 0.100 0.736 0.094 0.659 0.055
NMF 0.961 0.496 0.900 0.273 0.753 0.139 0.701 0.089
NMF-PPN 0.963 0.525 0.902 0.281 0.756 0.142 0.703 0.089
NMF-NHPO 0.965 0.541 0.903 0.290 0.756 0.144 0.702 0.094
AiPA 0.970 0.559 0.905 0.295 0.760 0.146 0.705 0.096
HPOAnnotator 0.971 0.562 0.907 0.296 0.760 0.152 0.706 0.097
Table 4Macro-AUC obtained by 5×5-fold cross-validation over Data-201706 for the nine competing methods
Method [1-10] [11-30] [31-100] [101-300] [≥301]
LR 0.526 0.553 0.633 0.735 0.755
BiRW 0.608 0.854 0.875 0.835 0.815
OGL 0.586 0.670 0.788 0.812 0.806
DLP 0.622 0.880 0.914 0.863 0.834
NMF 0.649 0.908 0.942 0.948 0.911
NMF-PPN 0.651 0.911 0.943 0.951 0.916
NMF-NHPO 0.653 0.919 0.946 0.947 0.919
AiPA 0.654 0.922 0.943 0.957 0.931
HPOAnnotator 0.655 0.925 0.947 0.958 0.931
Method performs best in terms of this evaluation metric are in boldface
data is further randomly divided into five folds (one for validation and the rest for training). The search ranges are as follows:{100, 200}forK,{2−3, 2−2,· · ·, 22, 23}for
λ,{2−7, 2−6,· · ·, 26, 27}forαandβ.
There are several variants of our algorithm by changing the settings of hyper-parametersαandβ. We also evaluate each of them as comparison methods. The details are as follows.
1. NMF:α=0andβ=0
Now the model is reduced to standard NMF, and the objective function is exactly the same as Eq. (8). 2. NMF-PPN:α=0andβ =0
Under this setting, there is no regularization term of NHPO, but PPN has. Thus, we term this model as NMF-PPN.
3. NMF-NHPO:α=0andβ=0
This setting is in contrast to NMF-PPN. That is, the regularization term of NHPO is kept, while that of PPN is not.
For the case ofα =0 andβ =0, there are two another variants depending on whether or not multiple PPNs are utilized.
1. AiPA:only one PPN is utilized
It is proposed in our previous study [17], which can be regarded as a special case of HPOAnnotator because only single PPN of STRING is exploited.
2. HPOAnnotator:multiple PPNs are utilized It is our final model presented in this paper. All four PPNs are used, including STRING, GeneMANIA, BioGRID, and Reactome as described before.
Two evaluation settings
Under two different settings, we validate the performance of the compared methods from two viewpoints:
1. Cross-validation over Data-201706
We conduct 5×5-fold cross-validation over all annotations on Data-201706. That is, we repeat the following procedure five times: all known annotations are divided randomly into five equal folds. The four folds are for training, while the remaining one is for test. After selecting the test annotation between proteinp and HPO term h, all annotations between p and the descendants of termh in the hierarchical structure of HPO are removed from the training data, in order to avoid any overlaps between training data and test data. It means that we predict the annotation of proteinp out of all unknown HPO terms, which is a fair and strict evaluation. 2. Independent test by using Data-201712
HPO annotations are incomplete, due to various reasons, such as slow curation. The way of annotations might be changed over time. So we
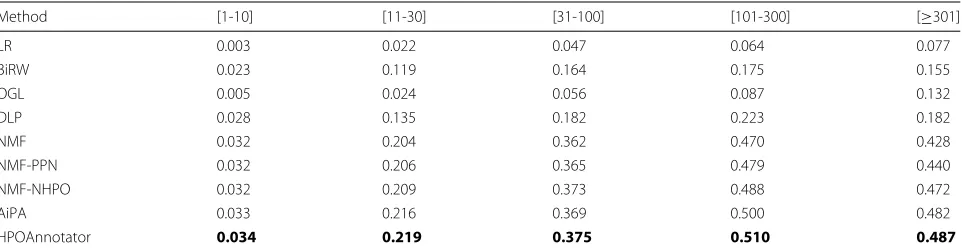
Table 5Macro-AUPR obtained by 5×5-fold cross-validation over Data-201706 for the nine competing methods
Method [1-10] [11-30] [31-100] [101-300] [≥301]
LR 0.003 0.022 0.047 0.064 0.077
BiRW 0.023 0.119 0.164 0.175 0.155
OGL 0.005 0.024 0.056 0.087 0.132
DLP 0.028 0.135 0.182 0.223 0.182
NMF 0.032 0.204 0.362 0.470 0.428
NMF-PPN 0.032 0.206 0.365 0.479 0.440
NMF-NHPO 0.032 0.209 0.373 0.488 0.472
AiPA 0.033 0.216 0.369 0.500 0.482
HPOAnnotator 0.034 0.219 0.375 0.510 0.487
Table 6Performance of NMF-PPN with individual PPNs
Data scource AUPR micro-AUPR macro-AUPR
STRING 0.525 0.281 0.142
GeneMANIA 0.523 0.280 0.143
BioGRID 0.517 0.280 0.140
Reactome 0.505 0.278 0.139
All 0.545 0.283 0.145
Results are for each PPN on the Data-201706. “All” means all four PPNs are used. Method performs best in terms of this evaluation metric are in boldface
conduct additional several experiments other than regular cross-validation by using data obtained in different time periods. That is, the training data is obtained before June 2017. All annotations in Data-201706 are used for training, where an internal five-fold cross-validation is done for setting up parameter values. After training, annotations obtained from June to December 2017 are then used for testing.
Experimental results
Predictive performance in cross-validation on Data-201706 Table 3reports the scores of the eight criteria obtained by averaging over 5×5 cross-validation (25 runs in total) on Data-201706. In this experiment, we compare the nine methods in total. In particular, the four are existing meth-ods (LR, BiRW, OGL and DLP), and another five are vari-ants of our model (NMF, NMF-PPN, NMF-NHPO, AiPA and HPOAnnotator). Note that STRING is the only PPN utilized in NMF-PPN. From the table, it clearly shows that our five methods perform better than the four existing methods. For example, our four methods achieve around 0.5 to 0.56 in AUPR, while all the scores by the exist-ing methods are less than 0.1. In fact, our five methods perform better than the existing methods with respect to all of the eight metrics. Thus, their performance dif-ferences are very clear. We can conclude that a low-rank approximation is useful for the HPO annotation problem. Furthermore, HPOAnnotator always outperforms other variants in eight conditions among our five methods. This indicates that network information is well incorporated into our formulation.
Table 4 lists the AUC scores obtained for five groups divided by the number of annotations. Again, the results reported in these tables demonstrate the same conclusion as that in Table3. That is, HPOAnnotator outperforms all other methods in all of the cases. A similar trend is also shown in Table5. In summary, our approach is capable of achieving the best performance for HPO annotations in terms of cross-validation.
A noteworthy point is that our method works well for the HPO terms with a very small number of annotations, i.e., only one to ten annotations per HPO term. In fact,
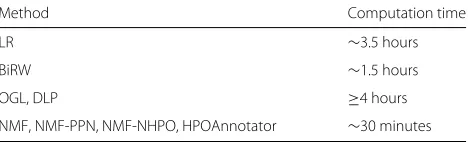
Table 7Training times of a single run in 5×5-fold cross-validation (average over 25 runs)
Method Computation time
LR ∼3.5 hours
BiRW ∼1.5 hours
OGL, DLP ≥4 hours
NMF, NMF-PPN, NMF-NHPO, HPOAnnotator ∼30 minutes
this situation is usually hard for a low-rank approximation. As HPOAnnotator has achieved the best performance, this implies that a low-rank approximation is useful for all types of groups including HPO terms with a very small number of annotations for HPO annotations.
The effectiveness of individual PPNs in cross-validation on Data-201706
By using NMF-PPN, we perform a set of experiments in order to identify the most effective PPN in terms of HPO predictions. To this end, we perform a series of experi-ments on NMF-PPN by using a single PPN as its input at a time. NMF-PPN with the four PPNs performs best as reported in Table6. As shown in Table6, we can conclude that STRING is the most useful PPN for predicting HPO annotations. By the way, Our model can take advantage of different PPNs to achieve the best performance.
Computation times in cross-validation on Data-201706 The computation (training) times of the eight methods compared in the cross-validation are recorded, where the times are averaged over the total 25 runs (5×5 folds). The computation times on the same machine with the same settings are reported in Table7. From the table, our four models run faster than the compared ones. In fact, they are more than eight times faster than OGL and DLP. The training data is updated periodically, thus the model must be trained by the updated data often. As such, this advan-tage of our models would make a difference. In addition, OGL and DLP need much more memory spaces than the compared methods.
Table 8AUC obtained by independent test using Data-201712
Method AUC
BiRW 0.7971
DLP 0.8298
OGL 0.7322
NMF 0.8527
NMF-PPN 0.8923
NMF-NHPO 0.8959
AiPA 0.9187
HPOAnnotator 0.9231
Table 9Seven true predictions out of the top 30 results (by HPOAnnotator) among all newly added annotations
Rank Protein ID Protein name Gene name HPO ID HPO name
2 Q02388 Collagen alpha-1(VII) chain (Long-chain collagen) (LC collagen)
COL7A1 HP:0001072 Thickened skin
7 Q9UBX5 Fibulin-5 FBLN5 DANCE,
UNQ184/PRO210
HP:0012638 Abnormality of nervous system physiology
17 Q9H5I5 Piezo-type mechanosensitive ion channel component 2 (Protein FAM38B)
PIEZO2 HP:0000422 Abnormality of the nasal bridge
19 O43175 D-3-phosphoglycerate dehydrogenase (3-PGDH) (EC 1.1.1.95) (2-oxoglutarate reductase) (EC 1.1.1.399) (Malate
dehydrogenase) (EC 1.1.1.37)
PHGDH HP:0000366 Abnormality of the nose
24 Q02388 Collagen alpha-1(VII) chain (Long-chain collagen) (LC collagen)
COL7A1 HP:0000962 Hyperkeratosis
26 Q04656 Copper-transporting ATPase 1 (EC 3.6.3.54) (Copper pump 1) (Menkes disease-associated protein)
ATP7A HP:0002650 Scoliosis
27 P43026 Growth/differentiation factor 5 GDF5 BMP14, CDMP1
HP:0005622 Broad long bones
These seven annotations were not in the training data (Data-201706), but found in the latest release (Data-201712)
Predictive performance in the independent test on Data-201712
Table 8 reports AUC obtained by the experiments conducted on independent data for the eight compet-ing methods. Among the three existcompet-ing methods, DLP achieves the best performance, with AUC of 0.8298. NMF outperforms DLP with AUC of 0.8527, while two variants of NMF with one network regularizer further achieves better performance with AUC of around 0.89. AiPA achieves 0.9187 of AUC with STRING PPN and NHPO. Most importantly, HPOAnnotator archives the best performance, with the AUC of more than 0.92.
As Table9reports, seven out of the 30 highest ranked predicted annotations are validated to be true accord-ing to Data-201712 which is released later. For example, protein Q02388, encoded by gene COL7A1, is actually
annotated by HPO term HP:0001072 (Thickened skin). But we fail to find it in the data released by December 2017. Another example is protein Q9UBX5. According to Data-201706, it has no relationship with HPO term HP:0012638 (Abnormality of nervous system physiology). But this record occurs in the later release of the data.
As the highest-ranked new annotation found by our model, HP:0001072 is known to also annotate another ten proteins, O43897, P07585, P08123, P08253, P12111, P20849, P20908, P25067, P53420, and Q13751, based on Data-201706. We find that their similarity scores with Q02388 in STRING are more than 0.9. It indicates that their interactions between Q02388 and those ten proteins in PPNs imply a high possibility of annotating Q02388 by HP:0001072. In summary, the number of these examples have demonstrated both the effectiveness and necessity of
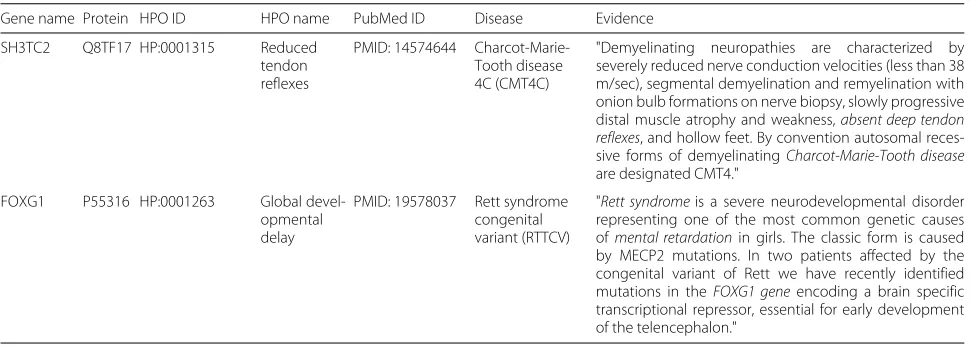
Table 10Validation of false positives in the top 10 ranked predictions
Gene name Protein HPO ID HPO name PubMed ID Disease Evidence
SH3TC2 Q8TF17 HP:0001315 Reduced tendon reflexes
PMID: 14574644 Charcot-Marie-Tooth disease 4C (CMT4C)
"Demyelinating neuropathies are characterized by severely reduced nerve conduction velocities (less than 38 m/sec), segmental demyelination and remyelination with onion bulb formations on nerve biopsy, slowly progressive distal muscle atrophy and weakness,absent deep tendon reflexes, and hollow feet. By convention autosomal reces-sive forms of demyelinatingCharcot-Marie-Tooth disease
are designated CMT4."
FOXG1 P55316 HP:0001263 Global devel-opmental delay
PMID: 19578037 Rett syndrome congenital variant (RTTCV)
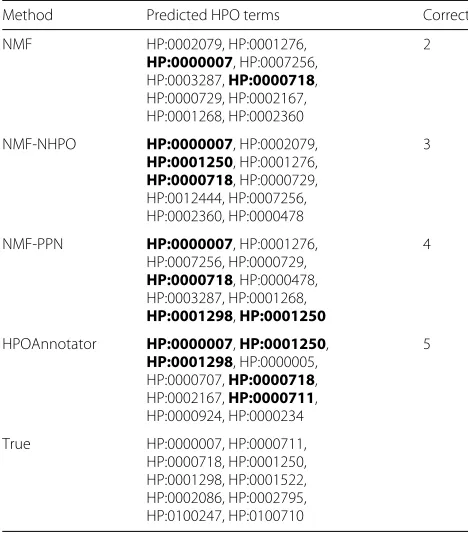
Table 11Predicted HPO terms of P23434 (gene name: GCSH) by our four methods based on NMF
Method Predicted HPO terms Correct
NMF HP:0002079, HP:0001276, HP:0000007, HP:0007256, HP:0003287,HP:0000718, HP:0000729, HP:0002167, HP:0001268, HP:0002360
2
NMF-NHPO HP:0000007, HP:0002079, HP:0001250, HP:0001276, HP:0000718, HP:0000729, HP:0012444, HP:0007256, HP:0002360, HP:0000478
3
NMF-PPN HP:0000007, HP:0001276, HP:0007256, HP:0000729, HP:0000718, HP:0000478, HP:0003287, HP:0001268, HP:0001298,HP:0001250
4
HPOAnnotator HP:0000007,HP:0001250, HP:0001298, HP:0000005, HP:0000707,HP:0000718, HP:0002167,HP:0000711, HP:0000924, HP:0000234
5
True HP:0000007, HP:0000711, HP:0000718, HP:0001250, HP:0001298, HP:0001522, HP:0002086, HP:0002795, HP:0100247, HP:0100710
Correctly predicted HPO terms are in boldface
introducing PPI networks for unknown HPO annotations prediction.
Validating false positives
As mentioned before, seven of the top 30 correct pre-dictions from our model have already been found in the December 2017 release version of HPO annotations. Due to the fact that a curation process on HPO annotations is normally slow, we believe that there may be more false positives among our top ranked predictions. In order to validate our assumption, we first select the rest of the top 10 predictions that have not been found in the Decem-ber 2017 HPO data. Using a protein name (or its coding gene name) and an HPO term name as a query for online search engines, we then check the relevant literature and
diseases for each false prediction. Finally, we manually extract the information from the retrieved papers con-taining supporting evidence that suggest a particular false positive to be correct in fact. Using this manual process, we find evidence for another two predictions. Table 10
lists the PubMed IDs of the relevant literature, the relevant diseases names, and the detailed evidence for each pair of the found gene/protein-HPO term. The results strongly indicate that the performance of HPOAnnotator is under-estimated, which is caused by the incompleteness of the current gold standard.
A typical example of demonstrating the performance of HPOAnnotator
To further demonstrate the performance of our proposed method for predicting HPO annotations, we here present the different predictions made by the four methods for a typical example, protein P23434. As listed in the last row of Table 11, this protein has 10 annotations. It is interesting to note that the number of correctly predicted HPO terms gradually increases from the first row to the fourth row. Again, this indicates that network information is effective for improving the performance of predicting HPO annotations.
Performance comparisons focusing on Organ abnormality Most of the existing models are evaluated on separate sub-ontologies. However, considering only part of the ontology may lose entire network information. Such infor-mation can connect proteins or HPO terms that are even beyond the boundaries of two or more subontolo-gies in the network space. As such, we do not conduct the experiments on separate sub-ontologies. Instead, we focus on the major sub-ontology, Organ abnormality (the part under HP:0000118), with 6370 HPO terms, 3446 proteins and 269420 annotations in total according to Data-201706. A 5×5-fold cross-validation has been con-ducted by following the same splitting strategy as before. Table12reports the scores of the eight evaluation crite-ria obtained by all compared methods. The results clearly show that the performance differences among the seven cases are subtle. For example, HPOAnnotator achieves the
Table 12Performance results on Data-201706 focusing on the sub-ontology Organ abnormality
Method AUC AUPR micro-AUC micro-AUPR macro-AUC macro-AUPR leaf-AUC leaf-AUPR
NMF-Organ 0.955 0.507 0.883 0.250 0.745 0.127 0.682 0.077
NMF-PPN-Organ 0.962 0.555 0.889 0.276 0.755 0.144 0.701 0.091
NMF-NHPO-Organ 0.962 0.535 0.888 0.264 0.756 0.141 0.702 0.089
NMF-All 0.956 0.512 0.884 0.258 0.755 0.129 0.685 0.083
NMF-PPN-All 0.962 0.553 0.889 0.273 0.755 0.143 0.698 0.089
NMF-NHPO-All 0.962 0.556 0.889 0.274 0.755 0.144 0.699 0.090
HPOAnnotator-All 0.963 0.559 0.891 0.278 0.759 0.146 0.702 0.094
Table 13Macro-AUC obtained by focusing on Organ abnormality
Method [1-10] [11-30] [31-100] [101-300] [≥301]
NMF-Organ 0.645 0.897 0.924 0.945 0.922
NMF-PPN-Organ 0.654 0.921 0.943 0.956 0.934
NMF-NHPO-Organ 0.652 0.926 0.942 0.958 0.936
NMF-All 0.645 0.906 0.939 0.941 0.912
NMF-PPN-All 0.651 0.924 0.941 0.954 0.919
NMF-NHPO-All 0.650 0.928 0.940 0.953 0.935
HPOAnnotator-All 0.655 0.929 0.946 0.955 0.938
The three rows with “Organ" use only organ abnormality for training, while the others with “All" take all sub-ontologies for training. Method performs best in terms of this evaluation metric are in boldface
best performance with respect to all evaluation measure except for leaf-AUC. Comparing Organ and NMF-PPN-Organ in terms of AUC, we can find that network information can help to improve the performance to a certain extent. Nonetheless, the use of both networks of PPN and NHPO might not be so effective in this scenario. Besides, it seems that the performance improvement is quite limited when we consider the whole ontology rather than individual sub-ontologies. Tables13and14list the evaluation scores of Macro-AUC and Macro-AUPR over the five HPO term groups, respectively. The trend is sim-ilar to that presented in Table12. Again, the results show no notable difference among the compared methods.
Discussion and Conclusion
In this paper, we have presented an approach that uses a low-rank approximation to solve the problem of the large-scale prediction of HPO annotations for human proteins. In particular, network information is used to regulate such an approximation. The network informa-tion can be derived from both sides of annotainforma-tions, i.e., PPI networks, and a hierarchical structure of an ontology. In essence, we provided a low-rank approximation solu-tion to the optimizasolu-tion problem of matrix factorizasolu-tion with a network-derived regularization. Extensive experi-ments on the current HPO database have been conducted
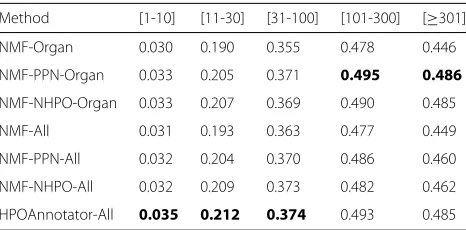
Table 14Macro-AUPR obtained by focusing on Organ abnormality
Method [1-10] [11-30] [31-100] [101-300] [≥301]
NMF-Organ 0.030 0.190 0.355 0.478 0.446
NMF-PPN-Organ 0.033 0.205 0.371 0.495 0.486 NMF-NHPO-Organ 0.033 0.207 0.369 0.490 0.485
NMF-All 0.031 0.193 0.363 0.477 0.449
NMF-PPN-All 0.032 0.204 0.370 0.486 0.460
NMF-NHPO-All 0.032 0.209 0.373 0.482 0.462
HPOAnnotator-All 0.035 0.212 0.374 0.493 0.485 The three rows with “Organ" use only organ abnormality for training, while the other four rows with “All" take all sub-ontologies for training.
Method performs best in terms of this evaluation metric are in boldface
to validate the effectiveness of our approach. Experimen-tal results clearly demonstrated the good performance of the proposed method under various settings, including cross-validation, independent test, analysis on the major sub-ontology Organ abnormality, and detailed case stud-ies. The results have validated the good effectiveness as a result of using network information and ontology hierar-chical structure as regularization and a low-rank approxi-mation for HPO predictions, even for predictions on HPO terms with a very small number of known annotations.
Overall, the four important findings can be concluded from the experimental results: 1) a low-rank approxima-tion works quite well for a large-scale HPO annotaapproxima-tions prediction; or more generally, for multi-label classifica-tion, even for predicting labels with an extremely small number of labeled instances; 2) a hierarchical ontology structure is very useful as side information for improv-ing the performance of a low-rank approximation; 3) PPI networks from different sources play an important role in predictions; and 4) multiplicative parameter update of a low-rank approximation (matrix factorization) is time-efficient, with around eight times faster than network-based approaches that need the huge memory because of using the original annotation matrices directly.
Abbreviations
AiPA: AiProAnnotator; ALS: Alternating least square; AUC: Area under the receiver operator characteristics curve; AUPR: Area under the precision-recall curve; BiRW: Bi-random walk; CAFA: Critical assessment of functional annotation; DAG: Directed acyclic graph; DLP: Dual label propagation; GO: Gene ontology; HPO: Human phenotype ontology; KKT: Karush-kuhn-tucker; LR: Logistic regression; NHPO: Network of HPO; NMF: Non-negative matrix factorization; OGL: Ontology-guided group lasso; PPI: Protein-protein interaction; PPN: Protein-protein network; SSVM: Structural support vector machine
About this supplement
This article has been published as part ofBMC Medical Genomics Volume 12 Supplement 10, 2019: Selected articles from the IEEE BIBM International Conference on Bioinformatics & Biomedicine (BIBM) 2018: medical genomics. The full contents of the supplement are available online athttps://bmcmedgenomics. biomedcentral.com/articles/supplements/volume-12-supplement-10.
Authors’ contributions
manuscript. LL, SY, XH, HM and SZ helped the result analysis, and contributed to improving the writing of manuscripts. All authors read and approved the final manuscript.
Funding
Publication costs were funded by National Natural Science Foundation of China (No. 61872094 and No. 61572139). S. Z. is supported by Shanghai Municipal Science and Technology Major Project (No. 2017SHZDZX01). J. G., L. L. and S. Y. are supported by the 111 Project (NO. B18015), the key project of Shanghai Science & Technology (No. 16JC1420402), Shanghai Municipal Science and Technology Major Project (No. 2018SHZDZX01) and ZJLab. H. M. has been supported in part by JST ACCEL (grant number JPMJAC1503), MEXT Kakenhi (grant numbers 16H02868 and 19H04169), FiDiPro by Tekes (currently Business Finland) and AIPSE program by Academy of Finland. The funding body have no role in the design of the study and collection, analysis, and interpretation of data and writing the manuscript.
Availability of data and materials Not applicable.
Ethics approval and consent to participate Not applicable.
Consent for publication Not applicable.
Competing interests
The authors declare that they have no competing interests.
Author details
1School of Computer Science and Shanghai Key Laboratory of Intelligent
Information Processing, Fudan University, 220 Handan Road, 200433, Shanghai, China.2School of Computing and Mathematics, Charles Sturt
University, Elizabeth Mitchell Dr, NSW 2640, Albury, Australia.3Bioinformatics
Center, Institute for Chemical Research, Kyoto University, Kashiwada Gokasho, Uji, 611-0011 Kyoto, Japan.4Department of Computer Science, Aalto
University, Konemiehentie 2, 02150 Espoo, Finland.5Shanghai Institute of
Artificial Intelligence Algorithms and ISTBI, Fudan University, 200433 Shanghai, China.6Key Laboratory of Computational Neuroscience and Brain-Inspired
Intelligence (Fudan University), Ministry of Education, Shanghai, China.
Published: 23 December 2019
References
1. Botstein D, Risch N. Discovering genotypes underlying human phenotypes: past successes for mendelian disease, future approaches for complex disease. Nat Genet. 2003;33(3s):228.
2. Li MJ, Sham PC, Wang J. Genetic variant representation, annotation and prioritization in the post-gwas era. Cell Res. 2012;22(10):1505–8. 3. Lage K, Karlberg EO, Størling ZM, et al. A human phenome-interactome
network of protein complexes implicated in genetic disorders. Nat Biotechnol. 2007;25(3):309–316.
4. Freimer N, Sabatti C. The human phenome project. Nat Genet. 2003;34(1):15–21.
5. Köhler S, Doelken SC, Mungall CJ, et al. The human phenotype ontology project: linking molecular biology and disease through phenotype data. Nucleic Acids Res. 2013;42(D1):966–74.
6. Hamosh A, Scott AF, Amberger JS, et al. Online mendelian inheritance in man (omim), a knowledgebase of human genes and genetic disorders. Nucleic Acids Res. 2005;33(suppl_1):514–7.
7. Aymé S, Schmidtke J. Networking for rare diseases: a necessity for europe. Bundesgesundheitsblatt Gesundheitsforschung Gesundheitsschutz. 2007;50(12):1477–83.
8. Bragin E, Chatzimichali EA, Wright CF, et al. Decipher: database for the interpretation of phenotype-linked plausibly pathogenic sequence and copy-number variation. Nucleic Acids Res. 2013;42(D1):993–1000. 9. Kahanda I, Funk C, Verspoor K, Ben-Hur A. Phenostruct: Prediction of
human phenotype ontology terms using heterogeneous data sources. F1000Res. 2015;4:259.
10. You R, Zhang Z, Xiong Y, et al. Golabeler: Improving sequence-based large-scale protein function prediction by learning to rank. Bioinformatics. 2018;34(14):2465–73.
11. Xie M, Hwang T, Kuang R. Reconstructing disease phenome-genome association by bi-random walk. Bioinformatics. 2012;1(02):1–8. 12. Wang P, Lai W, Li MJ, et al. Inference of gene-phenotype associations via
protein-protein interaction and orthology. PloS one. 2013;8(10):77478. 13. Gao Y, Church G. Improving molecular cancer class discovery through sparse non-negative matrix factorization. Bioinformatics. 2005;21(21): 3970–5.
14. Kim H, Park H. Sparse non-negative matrix factorizations via alternating non-negativity-constrained least squares for microarray data analysis. Bioinformatics. 2007;23(12):1495–502.
15. Wang JJ, Wang X, Gao X. Non-negative matrix factorization by maximizing correntropy for cancer clustering. BMC Bioinformatics. 2013;14(1):107.
16. Hofree M, Shen JP, Carter H, Gross A, Ideker T. Network-based stratification of tumor mutations. Nat Methods. 2013;10(11):1108–15. 17. Gao J, Yao S, Mamitsuka H, Zhu S. Aiproannotator: Low-rank
approximation with network side information for high-performance, large-scale human protein abnormality annotator. In: IEEE International Conference on Bioinformatics and Biomedicine, BIBM. Madrid: IEEE; 2018. p. 13–20.
18. Schietgat L, Vens C, Struyf J, et al. Predicting gene function using hierarchical multi-label decision tree ensembles. BMC Bioinformatics. 2010;11(1):2.
19. Xie M, Hwang T, Kuang R. Prioritizing disease genes by bi-random walk. In: Advances in Knowledge Discovery and Data Mining - 16th Pacific-Asia Conference, PAKDD. Kuala Lumpur: Springer; 2012. p. 292–303. 20. Xie M, Xu Y, Zhang Y, Hwang T, Kuang R. Network-based
phenome-genome association prediction by bi-random walk. PloS One. 2015;10(5):0125138.
21. Hwang T, Kuang R. A heterogeneous label propagation algorithm for disease gene discovery. In: Proceedings of the SIAM International Conference on Data Mining, SDM. Columbus: SIAM; 2010. p. 583–94. 22. Mehan MR, Nunez-Iglesias J, Dai C, Waterman MS, Zhou XJ. An
integrative modular approach to systematically predict gene-phenotype associations. BMC Bioinformatics. 2010;11(1):62.
23. Petegrosso R, Park S, Hwang TH, Kuang R. Transfer learning across ontologies for phenome-genome association prediction. Bioinformatics. 2016;33(4):529–36.
24. K S, X EP. Tree-guided group lasso for multi-task regression with structured sparsity. In: Proceedings of the 27th International Conference on Machine Learning (ICML-10). Haifa: Omnipress; 2010. p. 543–50. 25. Lin D. An information-theoretic definition of similarity. In: Proceedings of
the Fifteenth International Conference on Machine Learning (ICML) 1998. Madison: Morgan Kaufmann; 1998. p. 296–304.
26. Cai D, He X, Han J, Huang TS. Graph regularized nonnegative matrix factorization for data representation. IEEE Trans Pattern Anal Mach Intell. 2011;33(8):1548–60.
27. Szklarczyk D, Franceschini A, Kuhn M, et al. The string database in 2011: functional interaction networks of proteins, globally integrated and scored. Nucleic Acids Res. 2010;39(suppl_1):561–8.
28. Warde-Farley D, Donaldson SL, Comes O, et al. The genemania prediction server: biological network integration for gene prioritization and predicting gene function. Nucleic Acids Res. 2010;38(suppl_2):214–20. 29. Stark C, Breitkreutz B, Reguly T, et al. Biogrid: a general repository for
interaction datasets. Nucleic Acids Res. 2006;34(suppl_1):535–9. 30. Fabregat A, Jupe S, Matthews L, et al. The reactome pathway
knowledgebase. Nucleic Acids Res. 2017;46(D1):649–55.
31. Wu X, Zhou Z. A unified view of multi-label performance measures. In: Proceedings of the 34th International Conference on Machine Learning, ICML. Sydney: PMLR; 2017. p. 3780–8.
Publisher’s Note