Prediction of adolescent subjective
well-being: A machine learning approach
Naixin Zhang,1,2 Chuanxin Liu,3 Zhixuan Chen,1,2 Lin An,1,2 Decheng Ren,1,2 Fan Yuan,1,2 Ruixue Yuan,1,2 Lei Ji,1,2 Yan Bi,1,2 Zhenming Guo,1,2 Gaini Ma,1,2 Fei Xu,1,2 Fengping Yang,1,2 Liping Zhu,4 Gabirel Robert,5 Yifeng Xu,1,2 Lin He,1,2 Bo Bai,6 Tao Yu,1,2,3 Guang He 1,2
To cite: Zhang N, Liu C, Chen Z, et al. Prediction of adolescent subjective well-being: A machine learning approach. General Psychiatry 2019;32:e100096. doi:10.1136/ gpsych-2019-100096
NZ and CL contributed equally.
Received 31 May 2019 Revised 04 July 2019 Accepted 22 July 2019
1Bio-X Institutes, Shanghai Jiao
Tong University, Shanghai, China 2Shanghai Key Laboratory
of Psychotic Disorders, and Brain Science and Technology Research Center, Shanghai Jiao Tong University, Shanghai, China 3School of Mental Health, Jining
Medical University, Shandong, China
4Shanghai Center for Women
and Children's Health, Shanghai, China
5Department of psychiatry,
Medical University of Rennes, Rennes, France
6Institute of Neurobiology, Jining
Medical University, Shandong, China
Correspondence to Professor Guang He, Shanghai 200030, China;
heguangbiox@ 163. com © Author(s) (or their employer(s)) 2019. Re-use permitted under CC BY-NC. No commercial re-use. See rights and permissions. Published by BMJ.
AbsTrACT
background Subjective well-being (SWB), also known as happiness, plays an important role in evaluating both mental and physical health. Adolescents deserve specific attention because they are under a great variety of stresses and are at risk for mental disorders during adulthood.
Aim The present paper aims to predict undergraduate students’ SWB by machine learning method.
Methods Gradient Boosting Classifier which was an innovative yet validated machine learning approach was used to analyse data from 10 518 Chinese adolescents. The online survey included 298 factors such as depression and personality. Quality control procedure was used to minimise biases due to online survey reports. We applied feature selection to achieve the balance between optimal prediction and result interpretation.
results The top 20 happiness risks and protective factors were finally brought into the predicting model. Approximately 90% individuals’ SWB can be predicted correctly, and the sensitivity and specificity were about 92% and 90%, respectively.
Conclusions This result identifies at-risk individuals according to new characteristics and established the foundation for adolescent prevention strategies.
InTroduCTIon
Happy people tend to live longer and have better physical and mental health. Adoles-cence is a critical period since some results suggest that positive youth development can
improve long-term health.1 Furthermore,
adolescent depression was a strong predictor of mental disorders during adulthood.2 For example, many investigators had reported that undergraduate students suffered from depression and are vulnerable to suicide
attempt and completed suicide.3–8 In a
meta-analysis, Ibrahim et al also concluded that undergraduate students were more prone to depression with high prevalence.9 Therefore, robust identification of unhappy students is critical to develop and apply specific interven-tions to at-risk individuals. So far, traditional approaches adopted single self-report scale such as Centre for Epidemiologic Studies
Depression Scale (CES-D), Satisfaction with Life Scale (SWL) and Positive and Negative Affect Schedule (PANAS), which are not reli-able since SWB was multifaceted.10 Indeed, SWB contains many dimensions such as life-satisfaction, positive emotion and nega-tive emotion.11 For these reasons, identifying unhappy students required multivariate approaches to adequately circumscribe the multifaceted construct of SWB.
As a multivariable big-data problem,12
machine learning can provide SWB problem with solutions that would outperform clas-sical method. As such, previous studies had applied machine learning approaches to
predict SWB. For example, Bogomolov et al
used machine learning to predict SWB by using real-world and online data from mobile phone.13 14 Saputri and Lee adopted the same method to predict country SWB15 and Jatupai-boon et al used electroencephalogram to train model.16 These studies showed that machine learning could predict SWB better than single scale measurements. However, these previous studies focused on adult population and their application in terms of preventive strategies towards mental health was limited. Moreover, recent learning approaches, such as ensemble methods, had shown improved classification accuracies.
Ensemble methods had been widely adopted recently because of its good performance. The general idea of ‘ensemble methods’ was essentially based on constructing a set of simple classifiers and combining them. Final decisions were given by weighted or unweighted votes from each simple classi-fier, which contributes to model accuracy.17 One of the most representative ensemble methods was gradient boosting algorithm. It combined a set of simple classifiers. Each of them performed on data with one distri-bution. Those weak classifiers generated one strong classifier which can achieve higher
on September 12, 2020 by guest. Protected by copyright.
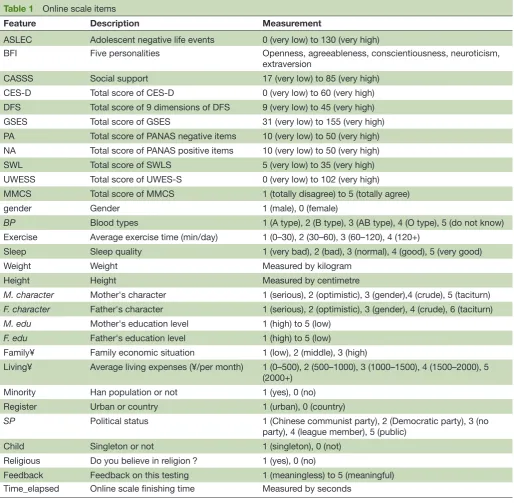
Table 1 Online scale items
Feature Description Measurement
ASLEC Adolescent negative life events 0 (very low) to 130 (very high)
BFI Five personalities Openness, agreeableness, conscientiousness, neuroticism, extraversion
CASSS Social support 17 (very low) to 85 (very high) CES-D Total score of CES-D 0 (very low) to 60 (very high) DFS Total score of 9 dimensions of DFS 9 (very low) to 45 (very high) GSES Total score of GSES 31 (very low) to 155 (very high) PA Total score of PANAS negative items 10 (very low) to 50 (very high) NA Total score of PANAS positive items 10 (very low) to 50 (very high) SWL Total score of SWLS 5 (very low) to 35 (very high) UWESS Total score of UWES-S 0 (very low) to 102 (very high) MMCS Total score of MMCS 1 (totally disagree) to 5 (totally agree) gender Gender 1 (male), 0 (female)
BP Blood types 1 (A type), 2 (B type), 3 (AB type), 4 (O type), 5 (do not know) Exercise Average exercise time (min/day) 1 (0–30), 2 (30–60), 3 (60–120), 4 (120+)
Sleep Sleep quality 1 (very bad), 2 (bad), 3 (normal), 4 (good), 5 (very good) Weight Weight Measured by kilogram
Height Height Measured by centimetre
M.character Mother's character 1 (serious), 2 (optimistic), 3 (gender),4 (crude), 5 (taciturn)
F.character Father's character 1 (serious), 2 (optimistic), 3 (gender), 4 (crude), 6 (taciturn)
M.edu Mother's education level 1 (high) to 5 (low)
F.edu Father's education level 1 (high) to 5 (low)
Family¥ Family economic situation 1 (low), 2 (middle), 3 (high)
Living¥ Average living expenses (¥/per month) 1 (0–500), 2 (500–1000), 3 (1000–1500), 4 (1500–2000), 5 (2000+)
Minority Han population or not 1 (yes), 0 (no) Register Urban or country 1 (urban), 0 (country)
SP Political status 1 (Chinese communist party), 2 (Democratic party), 3 (no party), 4 (league member), 5 (public)
Child Singleton or not 1 (singleton), 0 (not) Religious Do you believe in religion? 1 (yes), 0 (no)
Feedback Feedback on this testing 1 (meaningless) to 5 (meaningful) Time_elapsed Online scale finishing time Measured by seconds
Italicised items are one-hot coded dummy features.
ASLEC, Adolescent Self-Rating Life Events Check List; BFI, Big Five Inventory; CASSS, Child and Adolescent Social Support Scale; CES-D, Centre for Epidemiologic Studies Depression Scale; DFS, Dispositional Flow Scale; GSES, General Self-Efficacy Scale; MMCS, Multidimensional-Multiattributional Causality Scale; PANAS, Positive and Negative Affect Schedule; SWL, Satisfaction with Life Scale; UWES-S, Utrecht Work Engagement Scale-Student.
accuracy than other simple ones.18 Finally, their perfor-mance would be improved. Gradient boosting algorithm had many advantages. First, it was insensitive to data with non-normal distributions and outliers. Additionally, we did not have any a priori hypotheses about input vari-ables, which should be considered by the boosting algo-rithm. This algorithm was also robust against the addition of irrelevant input variables due to trees’ attribute.19
Including both psychological and physiological param-eters, we can take advantages of the gradient boosting
algorithm to predict undergraduates’ SWB with satisfying accuracy.
MeThods
online survey design
Scores of SWL and PANAS were used to measure undergraduate SWB. Other measurement items were summarised in table 1. Scales consisted of Adolescent Self-Rating Life Events Check List, Big Five Inventory
on September 12, 2020 by guest. Protected by copyright.
Figure 1 Flowchart of the study.
(BFI),7 Child and Adolescent Social Support Scale, CES-D Dispositional Flow Scale (DFS) General Self-Efficacy Scale (GSES) Utrecht Work Engagement Scale-Student (UWES-S) and Multidimensional-Multiattributional Causality Scale (MMCS). We also collected general infor-mation such as gender, blood type, exercise, sleep, reli-gion, economical situations, parents’ education level and characters. Moreover, four feedback questions and time elapsing were designed for sifting reliable data.
data collecting
All participants came from Jining Medical University. We included all participants who signed the ethical approval document.
Students (freshmen) who were entranced in 2016 and 2017 were recruited in this study in their first year. And students (sophomores) who were entranced in 2016 also took online survey in 2017 in their second year. We recruited 10 518 survey data in total. To minimise envi-ronmental influences, students were gathered and asked to complete the online scale together.
data processing
Figure 1 shows the steps of our data processing. First, we dropped samples with one score feedback questions, such as ‘this survey is meaningless’, ‘harry when answering questions’, ‘hard to understand this questionnaire’ and ‘answers do not reflect the truth’. In addition, only answering times within 99% CI were included. Second, the data size was reduced to 10 272 in total. Then, dummy
features (table 1) were encoded to one-hot codes and
binary classifying features were encoded to 0/1 codes, which were the proper format for machine learning. Third, standardisation was adopted to eliminate different orders’ problem. After principal component analysis of SWL and PANAS, the foremost two components were calculated as the ‘pca’ score. Whole data were divided into two datasets according to freshmen and sophomore.
Data 1 contained all freshmen’s information (N=6 886), and data 2 contained all sophomores’ information (N=3 386). The top 30% samples with ‘pca’ were labelled as 1 (data 1: N=2062; data 2: N=1016), and the bottom 30% were labelled as 0 (data 1: N=2063; data 2: N=1016). The remaining 40% of data were excluded in this study. After random shuffle, each dataset was divided into the training set and testing set with a conventional ratio 7 (data 1: N=2887; data 2: N=1422) to 3 (data 1: N=1238; data 2: N=610).
Feature selection
Each item of every scale was input as a feature, we included 298 features in total. To avoid overfitting and facilitate practical application, fewer features would be better. We assessed all 298 features simultaneously with elastic net regularisation, which can avoid correlated factors overfit-ting. This method would remove uninformative features and assign low weight to correlated ones. We selected the best 20 features from data 1 and data 2 separately. Further model construction would only consider these 20 features. This number was selected to balance predic-tion accuracy and usability in practical analysis. We also assessed models with 10 or 30 features.
Machine learning algorithm
This research applied computational language python and Gradient Boosting Classifier (GBC) in scikit-learn (sklearn, http:// scikit- learn. org/ stable/ index. html), a machine learning module in python, to build our predicting model. It was the model parameters which constructed one specific model. As an ensemble method, GBC combined multiple weak classifiers to produce more accurate prediction significantly; it was much better than any base classifiers. Initially, one specific classifier fits the data. The next new classifier would re-weight parameters to the direction of gradient descend, which would mini-mise loss of function. Finally, a model with the minimum
on September 12, 2020 by guest. Protected by copyright.
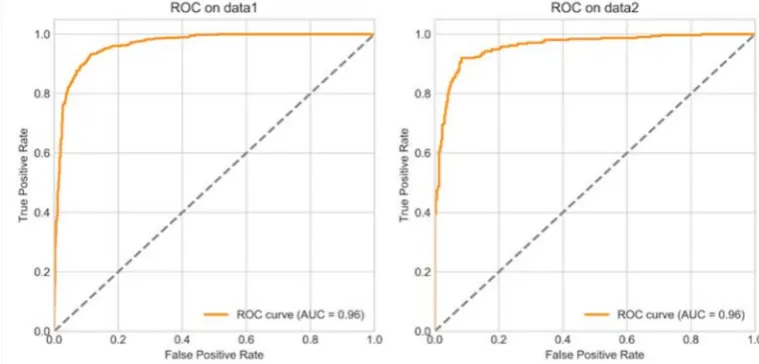
Figure 2 ROAUC.
AUC, area under curve; ROC, receiver operating characteristic curve.
error on training data (70% dataset) was generated. Model performance was evaluated by confusion matrix, receiver operating characteristic curve (ROC) and area under curve (AUC). Considering different life patterns between freshmen and sophomores, two models on data 1 (GBC1) and data 2 (GBC2) were built separately.
Tuning parameters
To achieve better predicting accuracy, tuning hyperpa-rameters of model was necessary. For example, model accuracy with different settings of two main important hyperparameters n_estimators and learning_rate has a typical pattern. With many important hyperparameters (eg, max_depth, min_samples_split, min_samples_leaf, max_
features) and trade-off problems, specific algorithm makes
this process efficient. A machine learning algorithm named GridSearchCV was applied to process optimal hyperparameters searching in GBC.
resulTs
label construction
Subjective well-being included three dimensions: life satisfaction, positive affect and negative affect.20 21 We took the SWL score and PANAS two subscores (positive and negative affect scores) as SWB measurement. After principal component analysis, we took foremost two components which can explain freshmen 82.5% (86.0%, sophomores) variance as the ‘pca’ score for further label tagging. The ‘pca’ score was negatively related with happi-ness, and it was calculated by formula listed below. The top 30% points were 1.87 (2.69, sophomores) and bottom 30% points were −2.48 (−2.47, sophomores). Observa-tions with a score higher than 1.87 (2.69, sophomores) were labelled as unhappy while individuals with a score lower than −2.48 (−2.47, sophomores) were considered as happy.
Freshmen: ‘pca’=0.536×component 1+0.289×compo-nent 2
Sophomores: ‘pca’=0.509×component 1+0.352×compo-nent 2
Model performance
After tuning parameters, GBC1 with 0.06 learning_rate enabled the model to achieve best performance. GBC2
with default parameters was the best. Figure 2 shows
models’ ROCs. GBC had tiny advantage on predicting
sophomores’ SWB. Table 2 shows various model
perfor-mance measurements on different sets of feature numbers. Models with 10, 20 and 30 predictors had no significant difference.
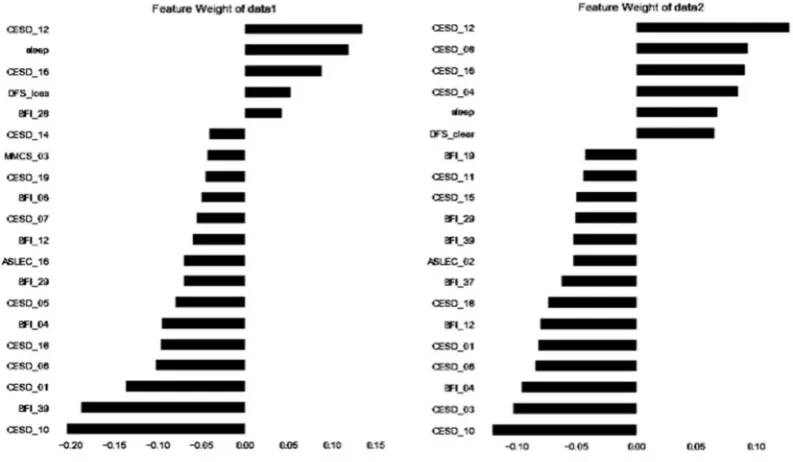
Feature importance
All 20 selected features’ relative importance for predicting
undergraduate SWB are shown in figure 3. Risk and
protective factors with huge difference patterns can be observed between freshmen and sophomores. The top three predictors of freshmen were “I felt fearful” (CES-D), ‘get nervous easily’ (BFI), “I was bothered by things that usually don’t bother me” (CES-D). The top three predictors of sophomores were questions of CES-D: “I was happy”, “I felt fearful”, “I felt that I could not shake off the blues even with help from my family or friends”.
dIsCussIon Main findings
The present paper constructed a machine learning model for predicting undergraduate students’ SWB with an accu-racy of about 91%. Meanwhile, important predictors for SWB were displayed and analysed. Personality and depres-sive symptoms affect both freshmen’s and sophomores’ SWB most. In addition, this paper presented a machine learning method, GBC, to predict undergraduate SWB. Two models were built on freshmen data (GBC1) and sophomore data (GBC2). The prediction accuracy achieved 90.47% (GBC1) and 90.98% (GBC2). Different SWB patterns between freshmen and sophomore were
on September 12, 2020 by guest. Protected by copyright.
Table 2 Model evaluation
GBC1 GBC2
10 features 20 features 30 features P value 10 features 20 features 30 features P value
Accuracy 89.74% 90.47% 90.79% 0.23 89.02% 90.98% 91.15% 0.45 AUC 0.9564 0.9644 0.9042 0.58 0.9558 0.9596 0.9588 0.64 Sensitivity 90.85% 92.06% 92.57% 0.24 88.14% 91.99% 90.71% 0.70 Specificity 88.77% 89.07% 89.23% 0.20 89.93% 89.93% 91.61% 0.50 PPV 87.67% 88.10% 88.30% 0.22 90.16% 90.54% 91.88% 0.33 NPV 91.69% 92.73% 93.19% 0.24 87.87% 91.47% 90.40% 0.68
AUC, area under receiver operating characteristic curve; GBC, Gradient Boosting Classifier; NPV, negative predictive value; PPV, positive predictive value.
Figure 3 Top 20 features for predicting undergraduates’ SWB
CES-D: items of CES-D; sleep: reported sleep quantity; DFS_loss: one of nine dimensions of DFS, loss of
self-consciousness; BFI: items of BFI; MMCS: items of MMCS; ASLEC: items of ASLEC; DFS_clear: one of nine dimensions of DFI, clear goals. ASLEC, Adolescent Self-Rating Life Events Check List; BFI, Big Five Inventory; CES-D, Centre for Epidemiologic Studies Depression Scale; DFS, Dispositional Flow Scale; MMCS, Multidimensional-Multiattributional Causality Scale; SWB, subjective well-being.
explored according to different important predic-tors. As far as we know, this work might be the first one adopting machine learning method to predict adolescent happiness in the Chinese population. Furthermore, two possible 20-item questionnaires for interpreting were generated (table 3). Rather than evaluate happiness with redundant factors, these 20 self-reported questions may diagnose SWB more efficiently. Students with this simple self-test can monitor their mental health, and psycholog-ical consultation teachers could identify at-risk individ-uals easily by evaluating the scores of each question. For example, a depressive student with a relatively low sleep situation may receive sleep therapy.
Freshmen and sophomores shared 11 predictors. Most of those items measuring depressive symptoms were also important predictors. For both freshmen and sopho-mores, half predictors came from CES-D. Depression
and happiness are ‘mirror images’, and the relation-ship between depression and SWB had already been reported.22 23 Reasonably, happier students were less depressed. Since depression had been proved to be related to genomic background,24 the relationship between SWB and depression suggested the possibility of ‘biological happiness’ in addition to ‘sociological happiness’. A quan-tified SWB level could be possible in the future. Moreover, a Genome-wide Association Study (GWAS) had reported that parts of ‘SWB’ SNPs were significantly associated with
depression symptoms.25 Both SWB and depression may
share some of the same genetic factors. Clinically, well-being therapy (WBT) was a psychotherapeutic strategy. It aimed to increase patients’ mental health, and guide themselves to a state of positive emotion by emphasising on self-observations. WBT has been proved as a successful way in easing depression.26 Those results indicated a close
on September 12, 2020 by guest. Protected by copyright.
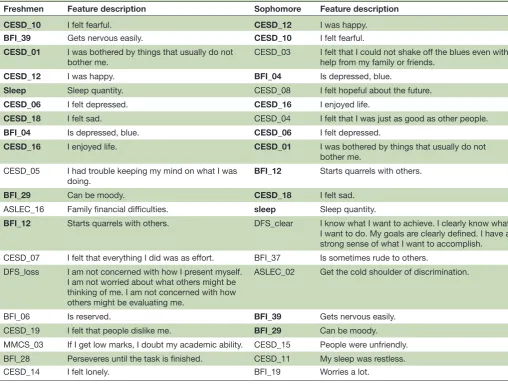
Table 3 Twenty features of predicting undergraduate SWB
Freshmen Feature description Sophomore Feature description
CESD_10 I felt fearful. CESD_12 I was happy.
BFI_39 Gets nervous easily. CESD_10 I felt fearful.
CESD_01 I was bothered by things that usually do not
bother me. CESD_03 I felt that I could not shake off the blues even with help from my family or friends.
CESD_12 I was happy. BFI_04 Is depressed, blue.
Sleep Sleep quantity. CESD_08 I felt hopeful about the future.
CESD_06 I felt depressed. CESD_16 I enjoyed life.
CESD_18 I felt sad. CESD_04 I felt that I was just as good as other people.
BFI_04 Is depressed, blue. CESD_06 I felt depressed.
CESD_16 I enjoyed life. CESD_01 I was bothered by things that usually do not bother me.
CESD_05 I had trouble keeping my mind on what I was
doing. BFI_12 Starts quarrels with others.
BFI_29 Can be moody. CESD_18 I felt sad.
ASLEC_16 Family financial difficulties. sleep Sleep quantity.
BFI_12 Starts quarrels with others. DFS_clear I know what I want to achieve. I clearly know what I want to do. My goals are clearly defined. I have a strong sense of what I want to accomplish. CESD_07 I felt that everything I did was as effort. BFI_37 Is sometimes rude to others.
DFS_loss I am not concerned with how I present myself. I am not worried about what others might be thinking of me. I am not concerned with how others might be evaluating me.
ASLEC_02 Get the cold shoulder of discrimination.
BFI_06 Is reserved. BFI_39 Gets nervous easily.
CESD_19 I felt that people dislike me. BFI_29 Can be moody. MMCS_03 If I get low marks, I doubt my academic ability. CESD_15 People were unfriendly. BFI_28 Perseveres until the task is finished. CESD_11 My sleep was restless.
CESD_14 I felt lonely. BFI_19 Worries a lot.
Items are listed as predicting importance order. Shared factors are in bold. DFS_clear, clear goals; DFS_loss, loss of self-consciousness.
relationship between happiness and depression, which may contribute to antidepression therapy in the future.
The importance of personality questions was about the same as depressive items. Many studies had reported the strong relationship between personality and happi-ness.20 27 In this study, consistent with previous studies, agreeableness, openness, conscientiousness and extra-version were positively correlated with happiness while neuroticism was negatively related to happiness. Since people with agreeableness, openness, conscientiousness and extraversion were more likely to get involved in positive social network, these traits would contribute to positive enjoyment or life satisfaction as well. The happi-ness level of people with these personalities can increase at the same time. On the contrary, people with neuroti-cism tended to suffer more misfortunate feelings, which resulted in less joy or pleasures.28
Two dimensions of DFS: loss of self-consciousness and
clear goals can affect undergraduates’ SWB slightly. DFS was designed as the measurement of flow. ‘Flow’ was first put forward as an intrinsically optimal state that resulted
from intense engagement with daily activities.29 In other words, people who were facing certain challengeable activ-ities with matched skills would generate positive emotions during acting. Being intrinsically motivated, everyone can gain happiness because of a sense of euphoria and satis-faction.30 We suppose college students can achieve SWB if they can be guided to experience more flow states.
limitations
First, all participants came from the same college, which may not represent the undergraduate popula-tion perfectly. In the future, we would try to seek for global cooperation to understand happiness predictors generally. Furthermore, no validation studies had been conducted on our 20-item questionnaires, which may possibly be used to measure undergraduate SWB. The reliability and effectiveness needed to be further studied.
Implications
This work provides a new evaluating approach on SWB, and contributes to understand SWB predictors. The
on September 12, 2020 by guest. Protected by copyright.
20-item questionnaires may inspire further simple self-re-ported SWB measurement, which could benefit individu-alised happiness detection.
Acknowledgements The authors appreciate the contribution of the members participating in this study.
Contributors NZ helped in the analysis of data, proof-reading and result formation. CL, LA, ZC, DR, FY, RY, LJ, YB, ZG, GM, FX and FY helped in the data collection and compilation of analysis. GR, YX, LH, BB, GH and TY provided valuable guidance and input to complete the task on time.
Funding This work was supported by the National Key Research and Development Program (2016YFC0906400, 2016YFC1307000, 2016YFC0905000), the National Nature Science Foundation of China (81421061, 81361120389), the Shanghai Key Laboratory of Psychotic Disorders (13dz2260500), the Shanghai Leading Academic Discipline Project (B205), and the Fundamental Research Funds for the Central Universities (16JXRZ01).
disclaimer This article does not contain any studies with human participants or animals performed by any of the authors.
Competing interests None declared. Patient consent for publication Not required.
Provenance and peer review Not commissioned; externally peer reviewed. open access This is an open access article distributed in accordance with the Creative Commons Attribution Non Commercial (CC BY-NC 4.0) license, which permits others to distribute, remix, adapt, build upon this work non-commercially, and license their derivative works on different terms, provided the original work is properly cited, appropriate credit is given, any changes made indicated, and the use is non-commercial. See: http:// creativecommons. org/ licenses/ by- nc/ 4. 0/.
reFerenCes
1 Hoyt LT, Chase-Lansdale PL, McDade TW, et al. Positive youth, healthy adults: does positive well-being in adolescence predict better perceived health and fewer risky health behaviors in young adulthood? J Adolesc Health 2012;50:66–73.
2 Johnson D, Dupuis G, Piche J, et al. Adult mental health outcomes of adolescent depression: a systematic review. Depress Anxiety 2018;35:700–16.
3 Acharya L, Jin L, Collins W. College life is stressful today - Emerging stressors and depressive symptoms in college students. J Am Coll Health 2018;66:655–64.
4 Horgan A, Kelly P, Goodwin J, Aine H, Peter K, John G, et al. Depressive symptoms and suicidal ideation among Irish undergraduate college students. Issues Ment Health Nurs 2018;39:1–10.
5 Ithnain N, Ghazali SE, Jaafar N. Relationship between smartphone addiction with anxiety and depression among undergraduate students in Malaysia. International Journal of Health Science Research 2018;8:163–71.
6 Kay N, Li K, Xiao X, et al. Hopelessness and Suicidal Behavior among Chinese, Thai and Korean College Students and Predictive Effects of the World Health Organization’s WHOQOL-BREF. Int Electron J Health Educ 2009;12:16–32.
7 Uglesić B, Lasić D, Zuljan-Cvitanović M, et al. Prevalence of depressive symptoms among college students and the influence of sport activity. Coll Antropol 2014;38:235–9.
8 Wolanin A, Hong E, Marks D, et al. Prevalence of clinically elevated depressive symptoms in college athletes and differences by gender and sport. Br J Sports Med 2016;50:167–71.
9 Ibrahim AK, Kelly SJ, Adams CE, et al. A systematic review of studies of depression prevalence in university students. J Psychiatr Res 2013;47:391–400.
10 Diener E, Scollon CN, Lucas RE. The evolving concept of subjective well-being: the multifaceted nature of Happiness. Advances in cell aging and gerontology 2003;15:187–219.
11 Robertson S, Davies M, Winefield H. Why weight for Happiness? correlates of BMI and SWB in Australia. Obes Res Clin Pract 2015;9:609–12.
12 Kido T, Swan M. Machine learning and personal genome informatics contribute to Happiness sciences and wellbeing computing 2016. 13 Jaques N, Taylor S, Azaria A, et al. Predicting students’ happiness
from physiology, phone, mobility, and behavioral data. International Conference on Affective Computing and Intelligent Interaction
2015:222–8.
14 Bogomolov A, Lepri B, Pianesi F. Happiness recognition from mobile phone data 2014.
15 Saputri TRD, Lee S-W. A study of cross-national differences in Happiness factors using machine learning approach. International Journal of Software Engineering and Knowledge Engineering 2015;25:1699–702.
16 Jatupaiboon N, Pan-ngum S, Israsena P. Real-Time EEG-based Happiness detection system. ScientificWorldJournal 2013;2013:1–12.
17 Dietterich TG. Ensemble methods in machine learning. Proc MCS’2000, Lect Notes Comput Sci 2005;1857.
18 Rokach L. Ensemble-based classifiers. Artif Intell Rev 2010;33:1–39. 19 Friedman JH. 1999 Reitz lecture greedy Funtion approximation:
a gradient boosting machine. The Annals of Statistics
2001;29:1189–232.
20 Ford TE, Lappi SK, Holden CJ. Personality, humor styles and happiness: happy people have positive humor styles. Eur. J. Psychol. 2016;12:320–37.
21 Hills P, Argyle M. The Oxford Happiness questionnaire: a compact scale for the measurement of psychological well-being. Pers Individ Dif 2002;33:1073–82.
22 Cheng H, Furnham A. Personality, self-esteem, and demographic predictions of Happiness and depression. Pers Individ Dif 2003;34:921–42.
23 Ford BQ, Shallcross AJ, Mauss IB, et al. Desperately seeking Happiness: Valuing Happiness is associated with symptoms and diagnosis of depression. J Soc Clin Psychol 2014;33:890–905. 24 Cai N, Bigdeli TB, Kretzschmar W, et al. Sparse whole-genome
sequencing identifies two loci for major depressive disorder. Nature
2015;523:588–91.
25 Okbay A, Baselmans BML, De Neve J-E, et al. Genetic variants associated with subjective well-being, depressive symptoms, and neuroticism identified through genome-wide analyses. Nat Genet 2016;48:624–33.
26 Fava GA, Cosci F, Guidi J, et al. Well-Being therapy in depression: new insights into the role of psychological well-being in the clinical process. Depress Anxiety 2017;34:801–8.
27 González Gutiérrez JL, Jiménez BM, Hernández EG, et al. Personality and subjective well-being: big five correlates and demographic variables. Pers Individ Dif 2005;38:1561–9.
28 Costa PT, McCrae RR. Influence of extraversion and neuroticism on subjective well-being: happy and unhappy people. J Pers Soc Psychol 1980;38:668–78.
29 Mihaly C. Flow: the psychology of optimal experience. New York: Harper Collins, 1990.
30 Seifert T, Hedderson C. Intrinsic motivation and flow in Skateboarding: an ethnographic study. J Happiness Stud 2010;11:277–92.
on September 12, 2020 by guest. Protected by copyright.
Naixin Zhang obtained a bachelor degree from the department of life science, Nankai University, Tianjin, China in 2017. She is now working on the master program in the Bio-X Institutes, Department of Life Science and Technology, Shanghai Jiaotong University, Shanghai, China. Her research interest include susceptibility genes of mental disorders, such as schizophrenia and major disorder depression, pharmacogenomics, such as different effectiveness of anti-depressant venlafaxine on patients with single nueleotide polymorphism, and subjective well-being of adolescent by machine learning method.
on September 12, 2020 by guest. Protected by copyright.