Copyright © 2011-15. Vandana Publications. All Rights Reserved.
Volume-5, Issue-1, February-2015
International Journal of Engineering and Management Research
Page Number: 231-250
Effect of Time Constant Parameter Uncertainties on Dynamic
Performance of interconnected Power Systems with EHVAC/HVDC
Transmission Links
Ram Naresh Mishra1,Dr. Prabhat Kumar2
1
Department of Electrical Engineering, G L A University, Mathura INDIA
2
Ex-Professor & Chairman, Department of Electrical Engineering, Aligarh Muslim University, Aligarh, INDIA
ABSTRACT
This paper presents a comprehensive study on dynamic performance of two-area interconnected power systems when subjected to Time constant parametric uncertainties. Power system model consists of one area with reheat thermal power plants and other area with hydro power plants having identical capacity. the system interconnection considered as namely EHVAC transmission
link only, HVDC transmission link with ∆Pdc taken as state
variable, HVDC transmission link with ∆Pdc taken as control
variable, EHVAC in parallel with HVDC transmission link
with ∆Pdc taken as state variable and EHVAC in parallel
with HVDC transmission link with ∆Pdc taken as control
variable. The dynamic model of incremental power flow through HVDC transmission link is derived based on frequency deviation at rectifier end only. Moreover, the HVDC link is considered to be operating in constant current control mode. To carry out the investigations, optimal AGC regulators are designed using proportional-plus-integral
control strategy and implemented on the system under consideration in the wake of 1% step load perturbation in area-1. The effect of ± 50% variation in system Time constant parameters from their nominal parameter values on system dynamic performance has been studied by investigating the response plots with (i) nominal system Time constant parameters and (ii) ± 50% variation in system Time constant parameter values. The system responses have been simulated
in Mat lab. Responses of ∆f1, ∆f2 , ∆Ptie, ∆Pdc, IACE1 a nd
IACE2 have been plotted for each Time constant parameter variation. The most significant parameters, which influence the system dynamic performance, are identified.
Keywords---- Interconnected power systems; HVDC transmission links; System dynamic Performance; EHVAC//HVDC transmission link; Optimal AGC regulator.
Notations:
i Subscript referring to area (i=1,2)
∆Xgi Incremental change in governor valve position of ith area
∆Pc Incremental change in speed changer position of ith area
i
∆Pg Incremental change in power generation of ith area
i
∆Pd Incremental change in load demand of ith area (p.u. MW/Hz)
i
∆F Incremental change in frequency of ith area
i
∆Ptiei Incremental change in tie-line power
flow of ith area (MW)
∆Pdc Incremental change in DC link power flow of ith area
i
∆Pr Incremental change in reheat turbine output of ith area
i
Hi Per unit inertia constant of ith area (sec) D Load frequency constant of ith area
(p.u. MW/Hz)
i
R Speed regulation parameter of ith area (Hz/p.u. MW)
i
B Frequency bias constant of ith area (p.u. MW/Hz)
Copyright © 2011-15. Vandana Publications. All Rights Reserved.
Mi Effective rotary inertia of ith area (pu MW-s2)
Tg Speed governor time constant of ith area (sec)
i
Kri Reheat turbine gain
Tri Reheat turbine time constant (sec) T1,T2,T3
Tw
Time constants representing hydro governor
Water inertia time constant K* Optimal feedback gain matrix Kdc DC-Link gain
Tdc DC-Link time constant (sec) Pri Rated power output of ith area Δi Power angle of ith area Pmax Maximum rated power
T12 Synchronizing coefficient of AC link a12 Area size ratio coefficient
U Control vector Pd Disturbance vector
J Performance index value
Q Positive semi-definite symmetric state cost weighting matrix
R Positive definite symmetric control cost weighting matrix
P Positive definite symmetric matrix K Feedback gain matrix
ACE Area Control Error
IACE Integral Area Control Error AGC Automatic Generation Control LQR Linear Quadratic Regulator
Α Rectifier Firing Angle
EHVAC Extra High Voltage Alternating Current HVDC High Voltage Direct Current
PI Proportional integral control
I.
INTRODUCTION
Reliable and secure operation of interconnected power
systems is a fundamental requirement for the modern
societies.The continuous growth in size & complexity of
interconnected power systems their operational & control problems have gained paramount significance and their control philosophies have tremendously changed from their earlier classical control concept to the application of modern control theory concepts .Moreover, the advancement in computer era has also revolutioned implementation of control strategies. The operational and control problems mainly aim of maintaining system variables at their scheduled levels at different instants of system operation satisfying the system constraints. To cope with enormously increasing load demands and subsequently meeting economical, technical and environmental considerations, power engineers are presently motivated to propose generating stations sites remote from the load centers. Moreover, sharing benefits of utilizing variability in generation mixes and load patterns, led to the evolution of interconnected power systems consisting of generating units of widely varying characteristics and sizes. Therefore, this development has necessitated such transmission links which are capable of exchanging the large chunk of electrical power among widely spread power pools effectively and economically fulfilling technical objectives. Till seventies, this requirement was fulfilled by EHVAC transmission lines and later by transmission at rapidly increasing AC voltage
levels. However, the power transmission at EHVAC/UHVAC levels and over extra long distances is associated with various operational and control problems. To combat these problems, HVDC transmission systems have emerged on power scenario due to its numerous economical and technical advantages over EHVAC transmission especially for controlled transfer of power between areas operating even at different frequencies, to enhance transient and dynamic stability in the associated AC networks and fast control to limit fault currents. Many HVDC transmission lines are commissioned all over the world and several HVDC projects are envisaged in ensuing years. One of the major applications of HVDC transmission is operating an HVDC link in parallel with an EHVAC link.
Copyright © 2011-15. Vandana Publications. All Rights Reserved. situation may arise for power engineers to have an
inter-regional interconnection of hydroelectric power pools and hydrothermal power pools. In a hydro-turbine relatively large inertia of water, used as the source of energy, causes a greater time lag in the response of the change in prime mover torque to a change in gate position. Moreover, there is an initial tendency for the torque to change in a direction opposite to that finally produced. The design and implementation of AGC regulators for power system with hydro turbines offers some technical difficulties due to large time constants associated with hydropower plants [4]. The implementation of optimal AGC regulator, designed with nominal system parameter values, may give rise to the deteriorated system dynamic performance in the wake of system parameter uncertainties. In practical conditions, the system parameters do not remain constant. There may be some variations in the system nominal values due to operating conditions, aging effect, and errors in the measurement or due to assumptions made in simplifying the mathematical model. Thus in presence of system parameters variations, the dynamic performance of the system may get deteriorated and become poor. Hence, for this reason, here, we have taken up a look to study the effect of parameters variations on the system’s dynamic performance and find out most significant parameters.
II.
THE TWO AREA POWER
SYSTEM MODEL
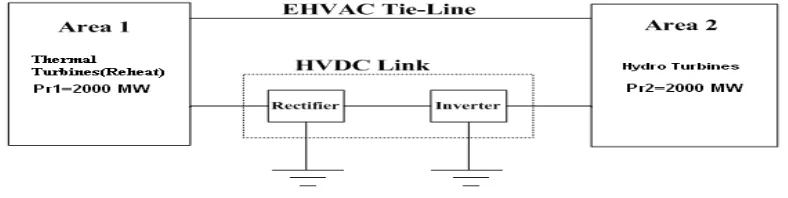
The two area interconnected hydrothermal power systems consisting of one power system with reheat thermal power plants and other power system with hydro power plants having identical capacity. the following configuration;
(i) EHVAC tie-line is used as a system
interconnection.
(ii) HVDC link is used as a system interconnection.
(iii)EHVAC tie-line in parallel with HVDC link is
Copyright © 2011-15. Vandana Publications. All Rights Reserved. Fig. 1: 2-Area Power System with EHVAC, HVDC & EHVAC in Parallel with HVDC Link
III.
OPTIMAL AGC REGULATOR
DESIGN WITH FULL STATE VECTOR
FEEDBACK
Let us take an s-area interconnected power system described by a completely controllable and observable linear time-invariant state space representation. The differential equations of the system are can be written as
=
•
X
A X + B U + Γ Pd ---- (1.1)Y = C X ---- (1.2)
Where: X , U, Γ Pd
We find the control U, so as to minimize the performance index
and Y are the state, control, disturbance and output vectors respectively.
Copyright © 2011-15. Vandana Publications. All Rights Reserved.
J =
∫
[
∞
°
2
1
XT Q X + U T R U
]
dt---- (1.3)
Where,
Q – a positive semi-definite symmetric state cost weighting matrix.
R – a positive definite symmetric control cost weighting matrix.
In the application of optimal control theory, the term ΓPd
in eqn (1.1) is eliminated by redefining the states and controls in terms of their steady-state values occurring after the disturbance.
Eqn (1.1) can be rewritten as;
=
•
X
A X + B U ;X (0) = Xo ---- (1.4)Where, X (0) = Xo is the initial condition.
And equation (1.2) will remain same
With a full state vector feedback control problem, a control law is stated in the form
U* = -K* X --- (1.5)
Hence, in order to design optimal regulator so as to minimize the performance index, we have to solve the Matrix- Riccatti (MR) equation given as:
AT P + PA – P B R-1BT P + Q = 0
---- (1.6)
By solving this equation, we get positive definite symmetric matrix P such that the optimal control law is calculated as
U* = - R-1 BT P X ---- (1.7)
Hence, the desired optimal feedback gain matrix will be
K* = R-1 BT
(a3) System interconnection as HVDC transmission link
only, with ∆Pdc as control variable
P ---- (1.8)
IV.
STATE VARIABLE MODEL
(1)(a1) System interconnection as EHVAC transmission
link only.
(a2) System interconnection as HVDC transmission link
only, with ∆Pdc as state variable.
(a4) System interconnection as parallel EHVAC/HVDC
transmission link, with ∆Pdc as state variable.
(a5) System interconnection as parallel EHVAC/HVDC
transmission link, with ∆Pdc as control variable.
(2)State vectors
[Xa1] = [∆f1, ∆Pg1, ∆Pr1, ∆Xg1, ∆f2, ∆Pg2, ∆Xg2,
∆Xgh2 , ∆Ptie, ∫ACE1,∫ACE2] ΄
[Xa2] = [∆f1, ∆f2, ∆Xg1, ∆Xg2, ∆Pg1, ∆Pg2, ∆Pr1, ∆Pr2,
∆Pdc, ∫ACE1, ∫ACE2]
[Xa3] = [∆f1, ∆Pg1, ∆Pr1, ∆Xg1, ∆f2, ∆Pg2, ∆Xg2,
∆Xgh2 , ∫ACE1, ∫ACE2] ΄
[Xa4] = [∆f1, ∆Pg1, ∆Pr1, ∆Xg1, ∆f2, ∆Pg2, ∆Xg2,
∆Xgh2 , ∆Ptie, ∆Pdc,∫ACE1, ∫ACE2] ΄
[Xa5] = [∆f1, ∆Pg1, ∆ Pr1, ∆Xg1, ∆f2, ∆Pg2, ∆Xg2,
∆Xgh2 , ∆Ptie, ∫ACE1, ∫ACE2] ΄
(3)Control vectors
[Ua1] = [Ua2] = [Ua4] = [∆Pc1, ∆Pc2]’; [Ua3] = [Ua5]=
[∆Pc1, ∆Pc2, ∆Pdc] ΄;
(4) Disturbance Vectors
[Pd-a1] = [Pd-a2] = [Pd-a3] = [Pd-a4] = [Pd-a5] =[∆Pd1,
∆Pd2] ΄;
V.
SYSTEM DATA AND MATRICES
The nominal system parameter values are given in Appendix A. The system matrices are derived based on (i) nominal values of system parameters; (ii) values of system parameters with 50% Reduction; and (iii) values of system parameters with 50% increase. The structure of all system
matrices is not reported due to brevity.
SIMULATION RESULTS; The system responses have
Copyright © 2011-15. Vandana Publications. All Rights Reserved. (1)Variations in Tg (governor time constant):
0 2 4 6 8 10 12
-0.03 -0.02 -0.01 0
∆
f1
EHVAC only
0 2 4 6 8 10 12
-15 -10 -5 0
5x 10
-3
∆
f1
HVDC, ∆Pdc State Var.
0 2 4 6 8 10 12
-0.03 -0.02 -0.01 0
∆
f1
HVDC, ∆Pdc Control Var.
0 2 4 6 8 10 12
-0.02 -0.015 -0.01 -0.005 0
time (sec)
∆
f1
AC/DC, ∆Pdc State Var.
0 2 4 6 8 10 12
-0.03 -0.02 -0.01 0
time (sec)
∆
f1
AC/DC, ∆Pdc Control Var.
50% Reduction
Nominal value 50% Increment
0 2 4 6 8 10 12
-0.04 -0.03 -0.02 -0.01 0
∆
f
2
EHVAC only
0 2 4 6 8 10 12
-0.06 -0.04 -0.02 0
∆
f
2
HVDC,Delta Pdc State Var.
0 2 4 6 8 10 12
-15 -10 -5 0
5x 10
-3
∆
f
2
HVDC,Delta Pdc Control Var.
0 2 4 6 8 10 12
-0.04 -0.03 -0.02 -0.01 0
time (sec)
∆
f
2
AC/DC,Delta Pdc State Var.
0 2 4 6 8 10 12
-0.03 -0.02 -0.01 0
time (sec)
∆
f
2
AC/DC,Delta Pdc Control Var.
50% Reduction Nominal value 50% Increment
0 2 4 6 8 10 12
-6 -4 -2 0 2
4x 10
-3
∆
P
t
i
e
EHVAC only
0 2 4 6 8 10 12
-5 0 5 10 15
20x 10
-3
time (sec)
∆
P
t
i
e
EHVAC/DC,Delta Pdc State Var.
50% Reduction Nominal value 50% Increment
0 2 4 6 8 10 12
-10 -8 -6 -4 -2 0 2x 10
-3
∆
P
d
c
HVDC,Delta Pdc State Var.
0 2 4 6 8 10 12
-0.02 -0.015 -0.01 -0.005 0
time (sec)
∆
P
d
c
EHVAC/DC,Delta Pdc State Var.
Copyright © 2011-15. Vandana Publications. All Rights Reserved. In case of Tg (above fig ),50% increment in its
nominal value improves system dynamic performance for
∆f1 (EHVAC only, HVDC ∆Pdc as control variable
,AC/DC ∆Pd c as state variable), ∆f2 ( HVDC ∆Pd c as
state variable ,AC/DC ∆Pdc as state variable), ∆Ptie(
EHVAC/DC ,∆Pdc as state variable), ∆Pdc ( EHVAC/DC
,∆Pdc as state variable), IACE1( HVDC, AC/DC ∆Pdc as
control variable) & IACE2 (HVDC, ∆Pdc as state
variable),while remaining responses have no considerable effect in the dynamic performance .
(2)Variations inTt (Time constant of the turbine):
0 2 4 6 8 10 12
-15 -10 -5 0
5x 10
-3 A C E 1 EHVAC only
0 2 4 6 8 10 12
-15 -10 -5 0
5x 10
-3
IA
C
E
1
HVDC,Delta Pdc State Var.
0 2 4 6 8 10 12
-0.015 -0.01 -0.005 0 IA C E 1
HVDC,Delta Pdc Control Var.
0 2 4 6 8 10 12
-0.015 -0.01 -0.005 0 time (sec) IA C E 1
AC/DC,Delta Pdc State Var.
0 2 4 6 8 10 12
-0.015 -0.01 -0.005 0 time (sec) IA C E 1
AC/DC,Delta Pdc Control Var.
50% Reduction Nominal value 50% Increment
0 2 4 6 8 10 12
-0.02 -0.01 0 0.01 IA C E 2 EHVAC only
0 2 4 6 8 10 12
-0.02 -0.01 0 0.01 IA C E 2
HVDC,Delta Pdc State Var.
0 2 4 6 8 10 12
-6 -4 -2 0 2x 10
-3
IA
C
E
2
HVDC,Delta Pdc Control Var.
0 2 4 6 8 10 12
-0.02 -0.01 0 0.01 time (sec) IA C E 2
AC/DC,Delta Pdc State Var.
0 2 4 6 8 10 12
-6 -4 -2 0x 10
-3 time (sec) IA C E 2
AC/DC,Delta Pdc Control Var.
50% Reduction Nominal value 50% Increment
0 2 4 6 8 10 12
-0.03 -0.02 -0.01 0 ∆ f1 EHVAC only 50% Reduction Nominal value 50% Increment
0 2 4 6 8 10 12
-15 -10 -5 0 5x 10
-3
∆
f1
HVDC, ∆Pdc State Var.
0 2 4 6 8 10 12
-0.03 -0.02 -0.01 0 ∆ f1
HVDC, ∆Pdc Control Var.
0 2 4 6 8 10 12
-0.015 -0.01 -0.005 0 time (sec) ∆ f1
AC/DC, ∆Pdc State Var.
0 2 4 6 8 10 12
-0.03 -0.02 -0.01 0 time (sec) ∆ f1
AC/DC, ∆Pdc Control Var.
0 2 4 6 8 10 12
-0.04 -0.03 -0.02 -0.01 0 ∆ f 2 EHVAC only 50% Reduction Nominal value 50% Increment
0 2 4 6 8 10 12
-0.04 -0.03 -0.02 -0.01 0 ∆ f 2
HVDC,Delta Pdc State Var.
0 2 4 6 8 10 12
-0.02 -0.01 0 0.01 ∆ f 2
HVDC,Delta Pdc Control Var.
0 2 4 6 8 10 12
-0.04 -0.03 -0.02 -0.01 0 time (sec) ∆ f 2
AC/DC,Delta Pdc State Var.
0 2 4 6 8 10 12
-0.02 -0.015 -0.01 -0.005 0 time (sec) ∆ f 2
AC/DC,Delta Pdc Control Var.
0 2 4 6 8 10 12
-6 -4 -2 0 2 4x 10
-3 ∆ P ti e EHVAC only 50% Reduction Nominal value 50% Increment
0 2 4 6 8 10 12
-5 0 5 10 15 20x 10
-3 time (sec) ∆ P ti e
EHVAC/DC,Delta Pdc State Var.
0 2 4 6 8 10 12
-10 -8 -6 -4 -2 0 2x 10
-3
∆
P
d
c
HVDC,Delta Pdc State Var.
50% Reduction Nominal value 50% Increment
0 2 4 6 8 10 12
-0.015 -0.01 -0.005 0 time (sec) ∆ P d c
Copyright © 2011-15. Vandana Publications. All Rights Reserved. In case of Tt (above fig), 50% decrement in its
nominal value gives improved system dynamic performance for all cases(i.e. the magnitudes of first peak, oscillatory modes around steady state error & settling time has been reduced marginally).
(3) Variations inT1, T2and T3 (hydro –governor
time constants):
0 2 4 6 8 10 12
-0.015 -0.01 -0.005 0
IA
C
E
1
EHVAC only
50% Reduction Nominal value 50% Increment
0 2 4 6 8 10 12
-15 -10 -5 0 5x 10
-3
IA
C
E
1
HVDC,Delta Pdc State Var.
0 2 4 6 8 10 12
-0.015 -0.01 -0.005 0
IA
C
E
1
HVDC,Delta Pdc Control Var.
0 2 4 6 8 10 12
-15 -10 -5 0 5x 10
-3
time (sec)
IA
C
E
1
AC/DC, DeltaPdc State Var.
0 2 4 6 8 10 12
-0.015 -0.01 -0.005 0
time (sec)
IA
C
E
1
AC/DC, DeltaPdc Control Var.
0 2 4 6 8 10 12
-0.02 -0.01 0 0.01
IA
C
E
2
EHVAC only
50% Reduction Nominal value 50% Increment
0 2 4 6 8 10 12
-0.02 -0.01 0 0.01
IA
C
E
2
HVDC,Delta Pdc State Var.
0 2 4 6 8 10 12
-10 -5 0 5x 10
-3
IA
C
E
2
HVDC,Delta Pdc Control Var.
0 2 4 6 8 10 12
-0.02 -0.01 0 0.01
time (sec)
IA
C
E
2
AC/DC,Delta Pdc State Var.
0 2 4 6 8 10 12
-6 -4 -2 0x 10
-3
time (sec)
IA
C
E
2
AC/DC,Delta Pdc Control Var.
0 2 4 6 8 10 12
-0.03 -0.02 -0.01 0
∆
f1
EHVAC only
50% Reduction Nominal value 50% Increment
0 2 4 6 8 10 12
-15 -10 -5 0
5x 10
-3
∆
f1
HVDC, ∆Pdc State Var.
0 2 4 6 8 10 12
-0.03 -0.02 -0.01 0
∆
f1
HVDC, ∆Pdc Control Var.
0 2 4 6 8 10 12
-0.02 -0.015 -0.01 -0.005 0
time (sec)
∆
f1
AC/DC, ∆Pdc State Var.
0 2 4 6 8 10 12
-0.03 -0.02 -0.01 0
time (sec)
∆
f1
AC/DC, ∆Pdc Control Var.
0 2 4 6 8 10 12
-0.04 -0.03 -0.02 -0.01 0
∆
f
2
EHVAC only
50% Reduction Nominal value 50% Increment
0 2 4 6 8 10 12
-0.04 -0.03 -0.02 -0.01 0
∆
f
2
HVDC,Delta Pdc State Var.
0 2 4 6 8 10 12
-15 -10 -5 0 5x 10
-3
∆
f
2
HVDC,Delta Pdc Control Var.
0 2 4 6 8 10 12
-0.04 -0.03 -0.02 -0.01 0
time (sec)
∆
f
2
AC/DC,Delta Pdc State Var.
0 2 4 6 8 10 12
-0.02 -0.015 -0.01 -0.005 0
time (sec)
∆
f
2
Copyright © 2011-15. Vandana Publications. All Rights Reserved.
In case of T1, T2, T3 (above fig), 50% decrement in its nominal value improves system dynamic
performance for ∆Ptie (EHVAC only, AC/DC ∆Pdc
as state variable), ∆Pdc (HVDC, ∆Pdc as state
variable, AC/DC ∆Pdc as state variable),
IACE2(excluding HVDC, ∆Pdc as control
variable).While remaining responses have no considerable effect in the dynamic performance.
0 2 4 6 8 10 12
-6 -4 -2 0 2 4x 10
-3
∆
P
ti
e
EHVAC only
50% Reduction Nominal value 50% Increment
0 2 4 6 8 10 12
-5 0 5 10 15 20x 10
-3
time (sec)
∆
P
ti
e
EHVAC/DC,Delta Pdc State Var.
0 2 4 6 8 10 12
-10 -8 -6 -4 -2 0 2x 10
-3
∆
P
d
c
HVDC,Delta Pdc State Var.
50% Reduction Nominal value 50% Increment
0 2 4 6 8 10 12
-0.016 -0.014 -0.012 -0.01 -0.008 -0.006 -0.004 -0.002 0
time (sec)
∆
P
d
c
EHVAC/DC,Delta Pdc State Var.
0 2 4 6 8 10 12
-0.015 -0.01 -0.005 0
IA
C
E
1
EHVAC only
50% Reduction Nominal value 50% Increment
0 2 4 6 8 10 12
-15 -10 -5 0 5x 10
-3
IA
C
E
1
HVDC,Delta Pdc State Var.
0 2 4 6 8 10 12
-0.015 -0.01 -0.005 0
IA
C
E
1
HVDC,Delta Pdc Control Var.
0 2 4 6 8 10 12
-0.015 -0.01 -0.005 0
time (sec)
IA
C
E
1
AC/DC,Delta Pdc State Var.
0 2 4 6 8 10 12
-0.015 -0.01 -0.005 0
time (sec)
IA
C
E
1
AC/DC, DeltaPdc Control Var.
0 2 4 6 8 10 12
-15 -10 -5 0 5x 10
-3
IA
C
E
2
EHVAC only
50% Reduction Nominal value 50% Increment
0 2 4 6 8 10 12
-0.02 -0.01 0 0.01
IA
C
E
2
HVDC,Delta Pdc State Var.
0 2 4 6 8 10 12
-10 -5 0 5x 10
-3
IA
C
E
2
HVDC,Delta Pdc Control Var.
0 2 4 6 8 10 12
-0.02 -0.01 0 0.01
time (sec)
IA
C
E
2
AC/DC,Delta Pdc State Var.
0 2 4 6 8 10 12
-6 -4 -2 0x 10
-3
time (sec)
IA
C
E
2
Copyright © 2011-15. Vandana Publications. All Rights Reserved.
(4) Variations in Tw (water inertia time
constant):
0 2 4 6 8 10 12
-0.03 -0.02 -0.01 0 ∆ f1 EHVAC only 50% Reduction Nominal value 50% Increment
0 2 4 6 8 10 12
-15 -10 -5 0 5x 10
-3
∆
f1
HVDC, ∆Pdc State Var.
0 2 4 6 8 10 12
-0.03 -0.02 -0.01 0 ∆ f1
HVDC, ∆Pdc Control Var.
0 2 4 6 8 10 12
-0.02 -0.015 -0.01 -0.005 0 time (sec) ∆ f1
AC/DC, ∆Pdc State Var.
0 2 4 6 8 10 12
-0.03 -0.02 -0.01 0 time (sec) ∆ f1
AC/DC, ∆Pdc Control Var.
0 2 4 6 8 10 12
-0.04 -0.03 -0.02 -0.01 0 ∆ f 2 EHVAC only 50% Reduction Nominal value 50% Increment
0 2 4 6 8 10 12
-0.04 -0.03 -0.02 -0.01 0 ∆ f 2
HVDC,Delta Pdc State Var.
0 2 4 6 8 10 12
-0.02 -0.01 0 0.01 ∆ f 2
HVDC,Delta Pdc Control Var.
0 2 4 6 8 10 12
-0.04 -0.03 -0.02 -0.01 0 time (sec) ∆ f 2
AC/DC, DeltaPdc State Var.
0 2 4 6 8 10 12
-0.02 -0.015 -0.01 -0.005 0 time (sec) ∆ f 2
AC/DC,Delta Pdc Control Var.
0 2 4 6 8 10 12
-6 -4 -2 0 2 4x 10
-3 ∆ P ti e EHVAC only 50% Reduction Nominal value 50% Increment
0 2 4 6 8 10 12
-5 0 5 10 15 20x 10
-3 time (sec) ∆ P ti e
EHVAC/DC, Delta Pdc State Var.
0 2 4 6 8 10 12
-10 -8 -6 -4 -2 0 2x 10
-3
∆
P
d
c
HVDC,Delta Pdc State Var.
50% Reduction Nominal value 50% Increment
0 2 4 6 8 10 12
-0.016 -0.014 -0.012 -0.01 -0.008 -0.006 -0.004 -0.002 0 time (sec) ∆ P d c
EHVAC/DC, Delta Pdc State Var.
0 2 4 6 8 10 12
-15 -10 -5 0 5x 10
-3 IA C E 1 EHVAC only 50% Reduction Nominal value 50% Increment
0 2 4 6 8 10 12
-15 -10 -5 0 5x 10
-3
IA
C
E
1
HVDC,Delta Pdc State Var.
0 2 4 6 8 10 12
-0.015 -0.01 -0.005 0 IA C E 1
HVDC,Delta Pdc Control Var.
0 2 4 6 8 10 12
-0.015 -0.01 -0.005 0 time (sec) IA C E 1
AC/DC,Delta Pdc State Var.
0 2 4 6 8 10 12
-0.015 -0.01 -0.005 0 time (sec) IA C E 1
AC/DC,Delta Pdc Control Var.
0 2 4 6 8 10 12
-15 -10 -5 0 5x 10
-3 IA C E 2 EHVAC only 50% Reduction Nominal value 50% Increment
0 2 4 6 8 10 12
-0.02 -0.01 0 0.01 IA C E 2
HVDC,Delta Pdc State Var.
0 2 4 6 8 10 12
-10 -5 0 5x 10
-3
IA
C
E
2
HVDC,Delta Pdc Control Var.
0 2 4 6 8 10 12
-0.02 -0.01 0 0.01 time (sec) IA C E 2
AC/DC, Delta Pdc State Var.
0 2 4 6 8 10 12
-6 -4 -2 0x 10
-3 time (sec) IA C E 2
Copyright © 2011-15. Vandana Publications. All Rights Reserved. In case of Tw (above fig ),50% increment in its
nominal value improves system dynamic performance for
∆Ptie( EHVAC only AC/DC ,∆Pdc as state variable), ∆Pdc
( HVDC ∆Pdc as state variable, AC/DC ∆Pd c as state
variable), while remaining responses have no considerable effect in the dynamic performance.
(5) Variations inR (Frequency bias constant) :
0 2 4 6 8 10 12
-0.03 -0.02 -0.01 0
∆
f
1
EHVAC only
50% Reduction Nominal value 50% Increment
0 2 4 6 8 10 12
-15 -10 -5 0 5x 10
-3
∆
f
1
HVDC,Delta Pdc State Var.
0 2 4 6 8 10 12
-0.03 -0.02 -0.01 0
∆
f
1
HVDC, Delta Pdc Control Var.
0 2 4 6 8 10 12
-0.015 -0.01 -0.005 0
time (sec)
∆
f
1
AC/DC,Delta Pdc State Var.
0 2 4 6 8 10 12
-0.03 -0.02 -0.01 0
time (sec)
∆
f
1
AC/DC,Delta Pdc Control Var.
0 2 4 6 8 10 12
-0.04 -0.03 -0.02 -0.01 0
∆
f
2
EHVAC only
50% Reduction Nominal value 50% Increment
0 2 4 6 8 10 12
-0.04 -0.03 -0.02 -0.01 0
∆
f
2
HVDC,Delta Pdc State Var.
0 2 4 6 8 10 12
-0.02 -0.01 0 0.01
∆
f
2
HVDC,Delta Pdc Control Var.
0 2 4 6 8 10 12
-0.04 -0.03 -0.02 -0.01 0
time (sec)
∆
f
2
AC/DC,Delta Pdc State Var.
0 2 4 6 8 10 12
-0.02 -0.015 -0.01 -0.005 0
time (sec)
∆
f
2
AC/DC,Delta Pdc Control Var.
0 2 4 6 8 10 12
-6 -4 -2 0 2 4x 10
-3
∆
P
ti
e
EHVAC only
50% Reduction Nominal value 50% Increment
0 2 4 6 8 10 12
-5 0 5 10 15 20x 10
-3
time (sec)
∆
P
ti
e
EHVAC/DC,Delta Pdc State Var.
0 2 4 6 8 10 12
-10 -8 -6 -4 -2 0 2x 10
-3
∆
P
d
c
HVDC,Delta Pdc State Var.
50% Reduction Nominal value 50% Increment
0 2 4 6 8 10 12
-0.015 -0.01 -0.005 0
time (sec)
∆
P
d
c
Copyright © 2011-15. Vandana Publications. All Rights Reserved. In case of R (above fig), 50% decrement in its value
improves slightly the dynamic performance for∆f1(HVDC,
∆Pdc as control variable), ∆f2 (HVDC, AC/DC for both ∆Pdc as state variable & control variable), ∆Ptie, ∆Pdc
&IACE2.But remaining responses have no considerable effect.
(6) Variations inB (Speed regulation constant):
0 2 4 6 8 10 12
-15 -10 -5 0 5x 10
-3 IA C E 1 EHVAC only 50% Reduction Nominal value 50% Increment
0 2 4 6 8 10 12
-15 -10 -5 0 5x 10
-3
IA
C
E
1
HVDC,Delta Pdc State Var.
0 2 4 6 8 10 12
-0.015 -0.01 -0.005 0 IA C E 1
HVDC,Delta Pdc Control Var.
0 2 4 6 8 10 12
-0.015 -0.01 -0.005 0 time (sec) IA C E 1
AC/DC,Delta Pdc State Var.
0 2 4 6 8 10 12
-0.015 -0.01 -0.005 0 time (sec) IA C E 1
AC/DC,Delta Pdc Control Var.
0 2 4 6 8 10 12
-15 -10 -5 0 5x 10
-3 IA C E 2 EHVAC only 50% Reduction Nominal value 50% Increment
0 2 4 6 8 10 12
-0.02 -0.01 0 0.01 IA C E 2
HVDC, DeltaPdc State Var.
0 2 4 6 8 10 12
-10 -5 0 5x 10
-3
IA
C
E
2
HVDC,Delta Pdc Control Var.
0 2 4 6 8 10 12
-0.02 -0.01 0 0.01 time (sec) IA C E 2
AC/DC, DeltaPdc State Var.
0 2 4 6 8 10 12
-6 -4 -2 0 2x 10
-3 time (sec) IA C E 2
AC/DC, DeltaPdc Control Var.
0 2 4 6 8 10 12
-0.03 -0.02 -0.01 0 ∆ f 1 EHVAC only 50% Reduction Nominal value 50% Increment
0 2 4 6 8 10 12
-15 -10 -5 0
5x 10
-3
∆
f
1
HVDC,Delta Pdc State Var.
0 2 4 6 8 10 12
-0.03 -0.02 -0.01 0 ∆ f 1
HVDC,Delta Pdc Control Var.
0 2 4 6 8 10 12
-0.02 -0.015 -0.01 -0.005 0 time (sec) ∆ f 1
AC/DC, DeltaPdc State Var.
0 2 4 6 8 10 12
-0.03 -0.02 -0.01 0 time (sec) ∆ f 1
AC/DC, DeltaPdc Control Var.
0 2 4 6 8 10 12
-0.04 -0.03 -0.02 -0.01 0 ∆ f 2 EHVAC only 50% Reduction Nominal value 50% Increment
0 2 4 6 8 10 12
-0.06 -0.04 -0.02 0 0.02 ∆ f 2
HVDC, Delta Pdc State Var.
0 2 4 6 8 10 12
-0.02 -0.01 0 0.01 ∆ f 2
HVDC,Delta Pdc Control Var.
0 2 4 6 8 10 12
-0.04 -0.02 0 0.02 time (sec) ∆ f 2
AC/DC,Delta Pdc State Var.
0 2 4 6 8 10 12
-0.03 -0.02 -0.01 0 0.01 time (sec) ∆ f 2
AC/DC,Delta Pdc Control Var.
0 2 4 6 8 10 12
-6 -4 -2 0 2 4x 10
-3 ∆ P ti e EHVAC only 50% Reduction Nominal value 50% Increment
0 2 4 6 8 10 12
-5 0 5 10 15 20x 10
-3 tige (sec) ∆ P ti e
EHVAC/DC,Delta Pdc State Var.
0 2 4 6 8 10 12
-10 -8 -6 -4 -2 0 2x 10
-3
∆
P
d
c
HVDC,Delta Pdc State Var.
50% Reduction Nominal value 50% Increment
0 2 4 6 8 10 12
-0.02 -0.015 -0.01 -0.005 0 time (sec) ∆ P d c
EHVAC/DC,Delta Pdc State Var.
0 2 4 6 8 10 12
-15 -10 -5 0
5x 10
-3 IA C E 1 EHVAC only 50% Reduction Nominal value 50% Increment
0 2 4 6 8 10 12
-15 -10 -5 0
5x 10
-3
IA
C
E
1
HVDC,Delta Pdc State Var.
0 2 4 6 8 10 12
-0.015 -0.01 -0.005 0 IA C E 1
HVDC, DeltaPdc Control Var.
0 2 4 6 8 10 12
-15 -10 -5 0 5x 10⁻³
time (sec)
IA
C
E
1
AC/DC,Delta Pdc State Var.
0 2 4 6 8 10 12
-15 -10 -5 0
5x 10
-3 time (sec) IA C E 1
Copyright © 2011-15. Vandana Publications. All Rights Reserved. In case of B (above fig), 50% increment in its
nominal value, the magnitudes of first peak, oscillatory modes around steady state error & settling time has been reduced marginally resulting system dynamic performance improves for all cases. While 50% decrement in its nominal value degrade the system dynamic performance in all aspects of response qualities.
(7) Variations in T12 (EHVAC link synchronizing
coefficient):
0 2 4 6 8 10 12
-0.02 -0.01 0 0.01
IA
C
E
2
EHVAC only
50% Reduction Nominal value 50% Increment
0 2 4 6 8 10 12
-0.02 -0.01 0 0.01
IA
C
E
2
HVDC,Delta Pdc State Var.
0 2 4 6 8 10 12
-10 -5 0 5x 10
-3
IA
C
E
2
HVDC, DeltaPdc Control Var.
0 2 4 6 8 10 12
-0.02 -0.01 0 0.01
time (sec)
IA
C
E
2
AC/DC,Delta Pdc State Var.
0 2 4 6 8 10 12
-6 -4 -2 0x 10
-3
time (sec)
IA
C
E
2
AC/DC,Delta Pdc Control Var.
0 2 4 6 8 10 12
-0.03 -0.02 -0.01 0
∆
f
1
EHVAC only
50% Reduction
Nominal value 50% Increment
0 2 4 6 8 10 12
-0.02 -0.015 -0.01 -0.005 0
time (sec)
∆
f
1
AC/DC,Delta Pdc State Var.
0 2 4 6 8 10 12
-0.03 -0.02 -0.01 0
time (sec)
∆
f
1
AC/DC,Delta Pdc Control Var.
0 2 4 6 8 10 12 -0.04
-0.03 -0.02 -0.01 0
∆
f
2
EHVAC only
50% Reduction Nominal value 50% Increment
0 2 4 6 8 10 12 -0.04
-0.02 0 0.02
time (sec)
∆
f
2
AC/DC,Delta Pdc State Var.
0 2 4 6 8 10 12 -0.02
-0.015 -0.01 -0.005 0
time (sec)
∆
f
2
AC/DC,Delta Pdc Control Var.
0 2 4 6 8 10 12
-8 -6 -4 -2 0 2
4x 10
-3
∆
P
ti
e
EHVAC only
50% Reduction Nominal value 50% Increment
0 2 4 6 8 10 12
-5 0 5 10 15
20x 10
-3
time (sec)
∆
P
ti
e
EHVAC/DC,Delta Pdc State Var.
0 2 4 6 8 10 12
-0.016 -0.014 -0.012 -0.01 -0.008 -0.006 -0.004 -0.002 0
time (sec)
∆
P
d
c
EHVAC/DC,Delta Pdc State Var.
Copyright © 2011-15. Vandana Publications. All Rights Reserved. In case of EHVAC link synchronizing coefficient
(T12) (above fig), 50% decrement in its nominal value
improves the dynamic performance for ∆f1 (AC/DC ∆Pdc
as state variable), ∆Ptie (EHVAC only, EHVAC/DC ∆Pdc
as state variable), ∆Pdc (EHVAC/DC ∆Pdc as state
variable),IACE1 & IACE2(EHVAC only).
(8) Variations inKdc (HVDC link gain constant):
0 2 4 6 8 10 12
-0.015 -0.01 -0.005 0
IA
C
E
1
EHVAC only
50% Reduction Nominal value 50% Increment
0 2 4 6 8 10 12
-0.015 -0.01 -0.005 0
time (sec)
IA
C
E
1
AC/DC,Delta Pdc State Var.
0 2 4 6 8 10 12
-15 -10 -5 0
5x 10
-3
time (sec)
IA
C
E
1
AC/DC, Delta Pdc Control Var.
0 2 4 6 8 10 12
-15 -10 -5 0
5x 10
-3
IA
C
E
2
EHVAC only
50% Reduction Nominal value 50% Increment
0 2 4 6 8 10 12
-0.02 -0.01 0 0.01
time (sec)
IA
C
E
2
AC/DC,Delta Pdc State Var.
0 2 4 6 8 10 12
-6 -4 -2 0
2x 10
-3
time (sec)
IA
C
E
2
AC/DC,Delta Pdc Control Var.
0 2 4 6 8 10 12
-20 -15 -10 -5 0 5x 10
-3
∆
f
1
HVDC,Delta Pdc State Var.
50% Reduction Nominal value 50% Increment
0 2 4 6 8 10 12
-0.02 -0.015 -0.01 -0.005 0
time (sec)
∆
f
1
AC/DC,Delta Pdc State Var.
0 2 4 6 8 10 12
-0.04 -0.035 -0.03 -0.025 -0.02 -0.015 -0.01 -0.005 0
∆
f
2
HVDC,Delta Pdc State Var.
50% Reduction Nominal value 50% Increment
0 2 4 6 8 10 12
-0.035 -0.03 -0.025 -0.02 -0.015 -0.01 -0.005 0
time (sec)
∆
f
2
Copyright © 2011-15. Vandana Publications. All Rights Reserved.
In case of Kdc (above fig), 50% increment in its nominal value improves the dynamic performance For
∆f1(HVDC, AC/DC as state variable).But 50% decrement
in its nominal value improves the dynamic performance
for ∆Ptie, ∆Pdc(HVDC, EHVAC/DC ∆Pdc as state
variable), where as 50% increment in its nominal value degrade the system dynamic performance for the same(i.e.
∆Ptie, ∆Pdc(HVDC, EHVAC/DC ∆Pdc as state variable)).
There is no considerable effect on dynamic performance
for ∆f2, IACE1 & IACE2, 50% variations in its nominal
value.
0 2 4 6 8 10 12
-5 0 5 10 15 20x 10
-3
time (sec)
∆
P
ti
e
EHVAC/DC,Delta Pdc State Var.
50% Reduction Nominal value 50% Increment
0 2 4 6 8 10 12
-12 -10 -8 -6 -4 -2 0
2x 10
-3
∆
P
d
c
HVDC,Delta Pdc State Var.
50% Reduction Nominal value 50% Increment
0 2 4 6 8 10 12
-0.02 -0.015 -0.01 -0.005 0
time (sec)
∆
P
d
c
EHVAC/DC,Delta Pdc State Var.
0 2 4 6 8 10 12
-14 -12 -10 -8 -6 -4 -2 0 2x 10
-3
IA
C
E
1
HVDC, DeltaPdc State Var.
50% Reduction Nominal value 50% Increment
0 2 4 6 8 10 12
-14 -12 -10 -8 -6 -4 -2 0 2x 10
-3
time (sec)
IA
C
E
1
AC/DC,Delta Pdc State Var.
0 2 4 6 8 10 12
-0.02 -0.015 -0.01 -0.005 0 0.005 0.01
IA
C
E
2
HVDC,Delta Pdc State Var.
50% Reduction Nominal value 50% Increment
0 2 4 6 8 10 12
-0.015 -0.01 -0.005 0 0.005 0.01
time (sec)
IA
C
E
2
Copyright © 2011-15. Vandana Publications. All Rights Reserved.
(9) Variations inTdc (HVDC link time constant):
0 2 4 6 8 10 12
-15 -10 -5 0 5x 10
-3
∆
f
1
HVDC,Delta Pdc State Var.
50% Reduction Nominal value 50% Increment
0 2 4 6 8 10 12
-0.015 -0.01 -0.005 0
time (sec)
∆
f
1
AC/DC,Delta Pdc State Var.
0 2 4 6 8 10 12
-0.04 -0.035 -0.03 -0.025 -0.02 -0.015 -0.01 -0.005 0
∆
f
2
HVDC,Delta Pdc State Var.
50% Reduction Nominal value 50% Increment
0 2 4 6 8 10 12
-0.035 -0.03 -0.025 -0.02 -0.015 -0.01 -0.005 0
time (sec)
∆
f
2
AC/DC,Delta Pdc State Var.
0 2 4 6 8 10 12
-5 0 5 10 15
20x 10
-3
time (sec)
∆
P
ti
e
EHVAC/DC,Delta Pdc State Var.
50% Reduction Nominal value 50% Increment
0 2 4 6 8 10 12
-10 -8 -6 -4 -2 0 2x 10
-3
∆
P
d
c
HVDC,Delta Pdc State Var.
50% Reduction Nominal value 50% Increment
0 2 4 6 8 10 12
-0.015 -0.01 -0.005 0
time (sec)
∆
P
d
c
EHVAC/DC,Delta Pdc State Var.
0 2 4 6 8 10 12
-14 -12 -10 -8 -6 -4 -2 0 2x 10
-3
IA
C
E
1
HVDC,Delta Pdc State Var.
50% Reduction Nominal value 50% Increment
0 2 4 6 8 10 12
-0.014 -0.012 -0.01 -0.008 -0.006 -0.004 -0.002 0
time (sec)
IA
C
E
1
AC/DC,Delta Pdc State Var.
0 2 4 6 8 10 12
-0.02 -0.015 -0.01 -0.005 0 0.005 0.01
IA
C
E
2
HVDC,Delta Pdc State Var.
50% Reduction Nominal value 50% Increment
0 2 4 6 8 10 12
-0.02 -0.015 -0.01 -0.005 0 0.005 0.01
time (sec)
IA
C
E
2
Copyright © 2011-15. Vandana Publications. All Rights Reserved. There is no considerable effect is observed in the
system dynamic performance, In case of 50% variation in Tdc (above fig) for all cases.
(10) Variations in Kr (Reheat coefficient of the
turbine):
0 2 4 6 8 10 12
-0.03 -0.02 -0.01 0
∆
f
1
EHVAC only
50% Reduction Nominal value 50% Increment
0 2 4 6 8 10 12
-15 -10 -5 0 5x 10
-3
∆
f
1
HVDC,Delta Pdc State Var.
0 2 4 6 8 10 12
-0.03 -0.02 -0.01 0
∆
f
1
HVDC,Delta Pdc Control Var.
0 2 4 6 8 10 12
-0.02 -0.015 -0.01 -0.005 0
time (sec)
∆
f
1
AC/DC, DeltaPdc State Var.
0 2 4 6 8 10 12
-0.03 -0.02 -0.01 0
time (sec)
∆
f
1
AC/DC,Delta Pdc Control Var.
0 2 4 6 8 10 12
-0.04 -0.03 -0.02 -0.01 0
∆
f
2
EHVAC only
50% Reduction Nominal value 50% Increment
0 2 4 6 8 10 12
-0.06 -0.04 -0.02 0
∆
f
2
HVDC,Delta Pdc State Var.
0 2 4 6 8 10 12
-0.02 -0.01 0 0.01
∆
f
2
HVDC,Delta Pdc Control Var.
0 2 4 6 8 10 12
-0.04 -0.03 -0.02 -0.01 0
time (sec)
∆
f
2
AC/DC,Delta Pdc State Var.
0 2 4 6 8 10 12
-0.03 -0.02 -0.01 0
time (sec)
∆
f
2
Copyright © 2011-15. Vandana Publications. All Rights Reserved.
Above Fig shows that the magnitudes of first peak, oscillatory modes around steady state error &settling time has been reduced marginally for all the system interconnection combinations, in case of 50% increment in nominal value of Kr.
0 2 4 6 8 10 12
-8 -6 -4 -2 0 2 4x 10
-3
∆
P
ti
e
EHVAC only
50% Reduction Nominal value 50% Increment
0 2 4 6 8 10 12
-5 0 5 10 15 20x 10
-3
time (sec)
∆
P
ti
e
EHVAC/DC,Delta Pdc State Var.
0 2 4 6 8 10 12
-10 -8 -6 -4 -2 0 2x 10
-3
∆
P
d
c
HVDC, Delta Pdc State Var.
50% Reduction Nominal value 50% Increment
0 2 4 6 8 10 12
-0.016 -0.014 -0.012 -0.01 -0.008 -0.006 -0.004 -0.002 0
time (sec)
∆
P
d
c
EHVAC/DC,Delta Pdc State Var.
0 2 4 6 8 10 12
-0.02 -0.015 -0.01 -0.005 0
IA
C
E
1
EHVAC only
50% Reduction Nominal value 50% Increment
0 2 4 6 8 10 12
-15 -10 -5 0 5x 10
-3
IA
C
E
1
HVDC,Delta Pdc State Var.
0 2 4 6 8 10 12
-0.015 -0.01 -0.005 0
IA
C
E
1
HVDC,Delta Pdc Control Var.
0 2 4 6 8 10 12
-15 -10 -5 0 5x 10
-3
time (sec)
IA
C
E
1
AC/DC, Delta Pdc State Var.
0 2 4 6 8 10 12
-0.015 -0.01 -0.005 0
time (sec)
IA
C
E
1
AC/DC,Delta Pdc Control Var.
0 2 4 6 8 10 12
-0.02 -0.01 0 0.01
IA
C
E
2
EHVAC only
50% Reduction Nominal value 50% Increment
0 2 4 6 8 10 12
-0.02 -0.01 0 0.01
IA
C
E
2
HVDC,Delta Pdc State Var.
0 2 4 6 8 10 12
-10 -5 0 5x 10
-3
IA
C
E
2
HVDC,Delta Pdc Control Var.
0 2 4 6 8 10 12
-0.02 -0.01 0 0.01
time (sec)
IA
C
E
2
AC/DC,Delta Pdc State Var.
0 2 4 6 8 10 12
-8 -6 -4 -2 0x 10
-3
time (sec)
IA
C
E
2
Copyright © 2011-15. Vandana Publications. All Rights Reserved.
(11) Variations inTr (Time constant of the reheater):
We observed that responses obtained subjected to the variation in Tr (Fig. P=32 to 34), In case of 50% increment in nominal value, we get improved dynamic performance. But, in case of 50% decrement in nominal value, there is no considerable effect in the dynamic performance.
VI.
CONCLUSION
From the investigations carried out for an interconnected hydro-thermal power systems with HVDC link & parallel EHVAC/DC link , the variation in nominal value of system parameters reveal that the system dynamic performance is more sensitive to the variations in Tg, Tt ,B , T12 ,Kdc ,Kr, Tr parameters , while less sensitive to the variations in T1,T2,T3,Tw,R & Tdc
parameters. (i) The performance of plot ∆f1 improves, by
50% increment in nominal values of parameters Tg, B, Kdc, Kr, Tr and 50% decrement in nominal values of parameters Tt, T12. While there is no considerable affect
on ± 50% variation inT1, T2, T3, Tw, R and Tdc.(ii) The
performance of plot ∆f2 improves, by 50% increment in
nominal values of parameters Tg, B, Kr, Tr and 50% decrement in nominal values of parameters Tt, T12, Kdc, Tdc. While there is no considerable affect on ± 50%
variation inT1, T2, T3, Tw, and R.(iii) The performance of
plot ∆Ptie improves, by 50% increment in nominal values
of parameters Tg, Tw B, Kr, Tr and 50% decrement in nominal values of parameters Tt, T1, T2, T3, R, T12, and
0 2 4 6 8 10 12
-0.03 -0.02 -0.01 0 ∆ f 1 EHVAC only 50% Reduction Nominal value 50% Increment
0 2 4 6 8 10 12
-15 -10 -5 0 5x 10
-3
∆
f
1
HVDC, DeltaPdc State Var.
0 2 4 6 8 10 12
-0.03 -0.02 -0.01 0 ∆ f 1
HVDC,Delta Pdc Control Var.
0 2 4 6 8 10 12
-0.015 -0.01 -0.005 0 time (sec) ∆ f 1
AC/DC,Delta Pdc State Var.
0 2 4 6 8 10 12
-0.03 -0.02 -0.01 0 time (sec) ∆ f 1
AC/DC,Delta Pdc Control Var.
0 2 4 6 8 10 12
-0.04 -0.03 -0.02 -0.01 0 ∆ f 2 EHVAC only 50% Reduction Nominal value 50% Increment
0 2 4 6 8 10 12
-0.04 -0.03 -0.02 -0.01 0 ∆ f 2
HVDC,Delta Pdc State Var.
0 2 4 6 8 10 12
-15 -10 -5 0 5x 10
-3
∆
f
2
HVDC,Delta Pdc Control Var.
0 2 4 6 8 10 12
-0.04 -0.03 -0.02 -0.01 0 time (sec) ∆ f 2
AC/DC, DeltaPdc State Var.
0 2 4 6 8 10 12
-0.02 -0.015 -0.01 -0.005 0 time (sec) ∆ f 2
AC/DC, DeltaPdc Control Var.
0 2 4 6 8 10 12
-6 -4 -2 0 2 4x 10
-3 ∆ P ti e EHVAC only 50% Reduction Nominal value 50% Increment
0 2 4 6 8 10 12
-5 0 5 10 15 20x 10
-3 time (sec) ∆ P ti e
EHVAC/DC,Delta Pdc State Var.
0 2 4 6 8 10 12
-10 -8 -6 -4 -2 0 2x 10
-3
∆
P
d
c
HVDC,Delta Pdc State Var.
50% Reduction Nominal value 50% Increment
0 2 4 6 8 10 12
-0.015 -0.01 -0.005 0 time (sec) ∆ P d c
EHVAC/DC, DeltaPdc State Var.
0 2 4 6 8 10 12
-0.015 -0.01 -0.005 0 IA C E 1 EHVAC only 50% Reduction Nominal value 50% Increment
0 2 4 6 8 10 12
-15 -10 -5 0 5x 10
-3
IA
C
E
1
HVDC,Delta Pdc State Var.
0 2 4 6 8 10 12
-0.015 -0.01 -0.005 0 IA C E 1
HVDC,Delta Pdc Control Var.
0 2 4 6 8 10 12
-0.015 -0.01 -0.005 0 time (sec) IA C E 1
AC/DC, DeltaPdc State Var.
0 2 4 6 8 10 12
-0.015 -0.01 -0.005 0 time (sec) IA C E 1
AC/DC,Delta Pdc Control Var.
0 2 4 6 8 10 12
-15 -10 -5 0 5x 10
-3 IA C E 2 EHVAC only 50% Reduction Nominal value 50% Increment
0 2 4 6 8 10 12
-15 -10 -5 0 5x 10
-3
IA
C
E
2
HVDC,Delta Pdc State Var.
0 2 4 6 8 10 12
-10 -5 0 5x 10
-3
IA
C
E
2
HVDC, DeltaPdc Control Var.
0 2 4 6 8 10 12
-0.02 -0.01 0 0.01 time (sec) IA C E 2
AC/DC, DeltaPdc State Var.
0 2 4 6 8 10 12
-6 -4 -2 0x 10
-3 time (sec) IA C E 2
Copyright © 2011-15. Vandana Publications. All Rights Reserved. Kdc. While there is no considerable affect on ± 50%
variation in Tdc.(iv) The performance of plot ∆Pdc
improves, by 50% increment in nominal values of parameters Tg, Tw B, Kr, Tr and 50% decrement in nominal values of parameters Tt, T1, T2, T3, R, T12, and Kdc. While there is no considerable affect on ± 50%
variation in Tdc.(v) The performance of plot IACE1
improves, by 50% increment in nominal values of parameters Tg, B, Kr, Tr and 50% decrement in nominal values of parameters Tt, . While there is no considerable affect on ± 50% variation in T1, T2, T3, Tw, R, T12, Kdc
and Tdc.(vi) The performance of plot IACE2 improves, by
50% increment in nominal values of parameters Tg, B, Kr, Tr and 50% decrement in nominal values of parameters Tt, T1, T2, T3, R, T12. While there is no considerable affect on ± 50% variation in Tw, Kdc and Tdc.
REFERENCES
[1] FOSHA, C.E., and ELGERD, 0.I.: ‘The megawatt-frequency control problem: a new approach via optimal
control theory’, IEEE Trans., PAS-89, 1970,pp.563-577.
[2] ELGERD, 0.I., ‘Electric energy systems theory: an
introduction’ (New York, McGraw-Hill, 1971), p. 54 [3] ‘Dynamic models for steam and hydro turbines in
power system Studies’, IEEE Trans., 1973, PAS-92, pp.
1904- 1915.
[4] M Calovic, linear regulator design for a load and frequency control, Committee IEEE Power Engineering society , pp. 2271-2285.
[5] M.L. Kothari, Prof. J. Nanda, Application of optimal control Strategy to Automatic generation control of a
hydrothermal system IEE PROCEEDINGS, Vol. 135, Pt.
D, No. 4, July 1988 pp268-274.
[6] Prabhat Kumar, K E Hole and R P Aggarwal,” Design of suboptimal AGC Regulator for Hydro-Thermal Power System”. IE (I) Journal.pt EL6,June 1983 ,pp 304-309. [7] Ibraheem, P Kumar,”Study of Dynamic Performance of Power Systems With Asynchronous Tie-lines Considering Parameter Uncertainties”. IE (I) Journal. EL Vol 85, June 2004 pp.35-42.
[8] Ibraheem , P Kumar and S Ahmad,” Dynamic Performance Enhancement of Hydro-Power Systems with Asynchronous Tie-lines”. IE (I) Journal Vol 85, June 2004 pp. 23-34.
Appendix A; Data: For Reheat Thermal Plant ;Pr1 =
2000 MW; H1 = 5 sec; D1 = 0.00833 p.u. MW/Hz; M1=0.167pu MW/Hz; R1 = 2.4 Hz p.u.MW; B1 = 0.425
p.u.MW/Hz; Tg1 = 0.08 sec; Tt1 = 0.3 sec; a12 = -1; ∆Pd1
= 0.01; ∆Pd2 = 0.00; Kr1 = 0.5; Tr1 = 10 sec; For Hydro
plant;Pr2=2000 MW; H2=5 sec; D2=.00833 p.u.MW/HZ;
M2=0.167pu MW/Hz; R2=2.4 Hz p.u.MW; B2 = 0.425
p.u.MW/Hz;T1=.0513sec;T2=5 sec;T3=48.7 Sec; Tw=1.0sec;
For AC& DC Link; Pmax = 200 MW (10% of Rated
Power);2*pi*T12=0.545; a = δ1- δ2 = 30°,Kdc = 1.0; Tdc