MURDOCH RESEARCH REPOSITORY
http://dx.doi.org/10.1109/NNSP.1994.366022
Lim, G., Alder, M., deSilva, C.J.S. and Attikiouzel, Y. (1994)
Moving object classification in a domestic environment using
quadratic neural networks. In: Proceedings of the 1994 IEEE
Workshop Neural Networks for Signal Processing [1994] IV, 6 -
8 September, Ermioni, Greece, pp. 375-383.
http://researchrepository.murdoch.edu.au/19382/
Copyright © 1994 IEEE
Personal use of this material is permitted. However, permission to reprint/republish
this material for advertising or promotional purposes or for creating new collective
Moving Object Classification
in
a
Domestic
Environment
using
Quadratic Neural Networks
Gek
Lim, Michael Alder, Christopher
J.S.
desilva
and Yianni Attikiouzel
Centre for Intelligent Information Processing Systems The University of Western Australia
Nedlands W.A. 6009, AUSTRALIA Tel: +61-9-3801763, Fax: +61-9-3801011 email: [gek, mike, Chris, yianN]Oee.uwa.edu
Abstract-In this paper, we present a moving object recognition system.
A
description is given of the whole system from the image acquisition through the preprocessing and feature extraction stagesto the classification of objects. We use Quadratic Neural Networks (QNN) to model the input data and then extract features from the model which are translation and rotation invariant. We have ap- plied the idea to a practical problem of classifying moving objects in a domestic environment such as a moving heads, curtains blown by the wind and external events such as moving tree branches. Reasonable results are obtained using only the spatial information.
INTRODUCTION
In this paper, we present a moving object recognition system for a domes- tic environment. In section 2, we briefly describe the system and introduce new techniques for building the system using Quadratic Neural Networks
(QNN).
We show that a QNN is not only powerful as a classifier [l], it isalso capable of other functions such as data modelling. Section 3 discusses the idea of a quadratic neuron and how it can be used in data modelling. A practical case study of a moving object recognition system is presented in Section 4 using QNN and finally conclusions are drawn in Section 5.
A
MOVING OBJECT RECOGNITION SYSTEMexample, practical problems such as a surveillance system or missile target tracking system. Such constraints help to simplify the problem by reducing the number of different clasees of objects to the minimum and specify the type of objects of interest, allowing the elimination of uninteresting objects at an early stage. This also helps to define the input data more clearly.
A moving object recognition system consists of four main p r o e i n g stages: image acquisition, preprocessing, feature extraction and classification. Since we are only concerned with recognising objects from a 2-D image, especially video images, the acqu@ition stage involvea capturing images from a
CCD-
camera via a frame grabber board.The preprocessing has to first detect the moving objects. There are a number of ways to do this, but the simplest is to take two consecutive frames and applying differencing to the pixels. Pixels with significant differences are set .to 1 (white), otherwise 0 (black) using the following function :
1, if (zf
-
2:)>
70, otherwise
Yi =
where
zf is the intensity of the ith pixel of image 1,
z: is the intensity of the ith pixel of image 2,
yi is the intensity of the ith pixel of the difference image,
T is the threshold.
This gives rise to a difference image.showing the moving parts of the objects in white.
Different values of T will produce different difference images. A low value
of T will capture most of the moving parts but it also produces a rather
‘noisy’ image.
On
the other hand, a high value of T will cause a reduction ofinformation and only capture a small proportion of the moving parts which may not be sufficient for classification purposes.
It makes sense to chose a lower r value, and preserve the information about the moving parts, because a high r value might lose that information completely. To remove noise from the difference image, we identify and delete small isolated regions. We trace the border of each region and generate chaincode descriptions of the borders. Regions whose borders are less than a predetermined length are deleted from the difference image. The chaincode descriptions of larger regions are retained for further analysis.
The border description is then used to extract features for the classification stage. The aim is to capture the characteristics of the objects of each class so that it can be distinguished easily from the others. In the best case, the classes will be linearly separable in the feature space and give rise to successful recognition.
There is frequently a problem of lack of invariance, that is, the ‘same’ object may appear rotated, scaled, shifted, or in a different colour. There are
two approaches to dealing with this situation. The first is to choose features which are invariant under the transformations, and the second is to rely on
the classifier to ‘learn’ the invariance. We have chosen to follow the former approach. We use a
QNN
to model the input data and extract features from the model, representing it as a point in the feature space,RN.
At this stage, the object is represented by a point in
RN
and is ready for classification. As the invariant properties of the object have been repre sented, simple classification techniques are sufficient to produce a reasonable recognition rate.QUADRATIC NEURAL NETWORKS
A quadratic neuron in a
QNN
is represented by a second order discrimi- nant curve a(z - P ) ~+
26(2-
p)(y-
g)+
c(y-
q)’=
1, where(z,ar)T
E
R’,@ , P . ) ~ E
R2
is the centre,a, b, c E
R
satisfy a>
0, c>
0 and ac-
b’>
0.Alternatively, the discriminant curve may be written
(x
-
m)TQ(x-
m) = 1where
x = (z,y)=
E
R’,
m
=
( p , q)T ER’
is the mean,Q
=(
ing a quadratic form.
)
is a positive definite symmetric matrix, represent-This discriminant curve is an ellipse with centre (p, = m. This deter- mines a gaussian distribution
x-mpo(x-m) At?- a
x-mFocx-ml
where A is a constant chosen 80 that &lAe-L a = 1. If we
slice through the quadratic form at height one, we get an ellipse, {z : (x
-
m)TQ(x-
m) = l}, where x, mE
R2.
So, a quadratic neuron is represented graphically by an ellipse inR2.
All of this generalises naturally toRN.
This differs from the traditional use of a quadratic discriminant function that simply enclosee points of one category, or the extension which usea the Mahalanobis distance as a classifier. We do not follow the tradition whereby
A quadratic neuron, that is, models a probability density function locally and responds to a particular set of points in
RN.
For example, given a data set of points in R', we can compute the mean, m, and covariance matrix, C, of the set of points and this gives rise to a gaussian distribution withQ
= C-l. In our neuron model, the reeponse of the neuron may be treated asthe log likelihood of the set evaluated by the associated gaussian distribution. Although our commitment to gaussian distributions is not absolute, they allow us to relate neural models to conventional statistical models to some degree.
Response of the neuron modelling the set of points in
R2
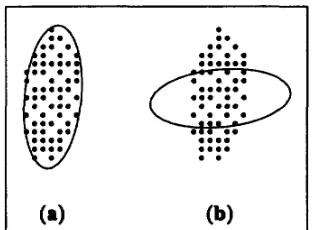
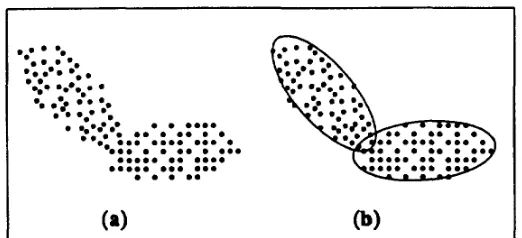
shown in Figure 1 (a) will be high where& the response for Figure 1 (b) will be low aa it is apoor fit to the data. Given another set of points as shown in Figure 2(a), in order to achieve the maximum likelihood of the distribution, more than one ellipse (or neuron) is required, Figure 2(b). In this case, we have a mixture of gaussian distributions.
.
..
..
0 .
.
0 .
. .
...e..
...
0..
. .
Figure 1: Response of neurons (a) High response, (b) Low response
CASE
STUDY
We are interested in building a moving object recognition system that can classify objects in a domestic environment. What one finds in this case is moving human heads, curtains blown by the wind and external events seen through windows such as moving tree branches.
Input Acquietion
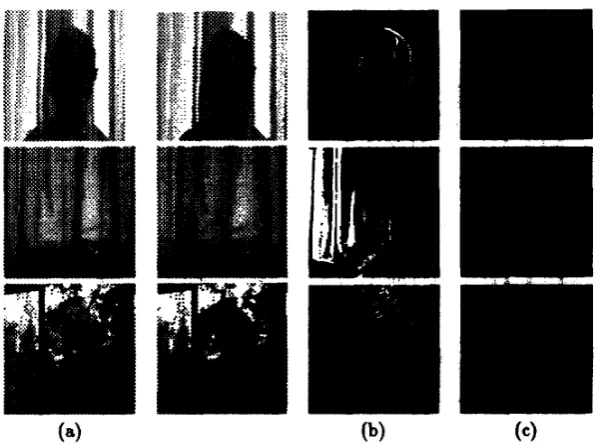
Images are collected using a CCD-camera and a frame grabber board. The resolution of the images is 256x256 pixels with 128 grey-levels. Figure
3(a) shows two consecutive frames of the three different classes of object.
Figure 2: Data Modelling (c) Two clusters of points, (d) Gaussian Mixture Modelling
Preprocessing Stage
First, we detect the motion of the objects by differencing two consecutive frames. The moving parts are shown in white, Figure 3(b).
Next, we apply a border tracing algorithm [2] to find the starting point and the chaincode of all the isolated regions. We remove regions with 'short' chaincode; the border image is shown in Figure 3(c).
Feature Extract ion
We use a QNN to model the border image of the objects. We fit ellipses along the border by taking C consecutive elements of the chaincode for some suitable C, and compute the mean and covariance matrix for the set. C must be chosen so that the quadratic forms are not degenerate, but not so large that the structure is distorted.
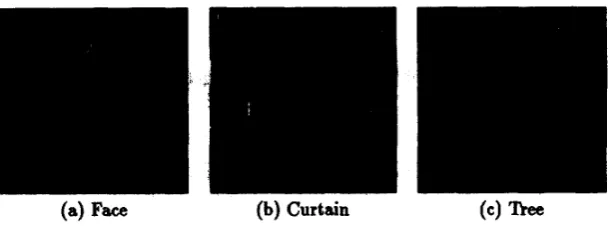
The resulting image shows the border of the moving parts represented by sequences of ellipses, Figure 4. The effect of this is to smooth the noisy boundary contour and compress the representation of the objects. More importantly, the structural information of the objects is not distorted and the ellipse representation can easily be made translation and rotation invariant.
We have assumed that the moving object recognition system knows ex-
actly what it is looking for. In this case, we are looking for a head, curtain or tree. It will be observed that the characteristic of the curtain is that it is made up of mainly vertical edges with some random 'noise', whereas a head composed of more or less curved edges. The tree basically has no structure and has a high entropy. This term makes sense if we regard each ellipse as
a predictor of the orientations of its neighbours: recall that the chaincode establishes an ordering on the quadratic forms.
Figure 3: Examples of the three different objects: Faces, Curtains, Tree
Branches; (a) Original image, (b) Difference image, (c) Border of the differ- ence image, (d) Border of the difference image with ellipses along it.
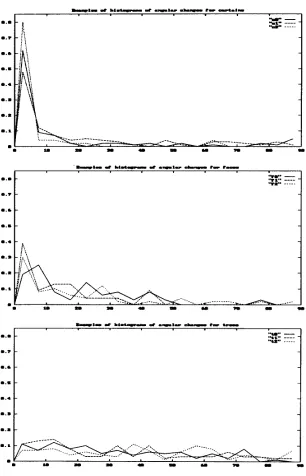
for all three objects. The fact that there is a high frequency of small angular change in the curtain histogram reflects that it is made up mainly of vertical edges. The flat distribution of the tree histogram justified our claim that the tree has a complex structure with irregularly placed ellipses. The head is somewhere in between because it has curved edgea which are still highly regular, and which leads to a slightly bigger angular change in the mean.
CLASSIFICATION
We classify a new object by computing its histogram and comparing it with the mean histograms for each of the three object cl-. There are several possible ways of meaeuring a distance between histograms; we have a preference for information theoretic methods and thedore use the KullBack- Leibler distance for the classification. Thus we compute the KullBack-Leibler distance of a new histogram from the average distribution for each class using
Figure 4: Fitting ellipses along the border of the difference image
where P ( z i ) is the average model for class i, and Q(zi) is the new distribution, to be classified.
Classification is done by finding the minimum KL distance between the new histogram and the category means. A small constant value is added to each bin in the histogram to avoid the problems of zero probability events.
RESULTS
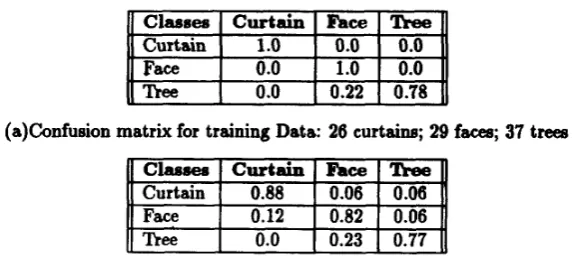
Using the Kullback-Leibler measure of discrepancy between histograms, the classification rate for the training set is 92% and the testing set is 82%,
Table 1. Histograms were formed based on the angular change between consecutive ellipsea from the ellipse sequences. We compute the mean distri- bution for the curtain, head and tree classes from 26, 29 and 37 histograms respectively. Table l(a) shows the confusion matrix of the results of the histogram classification. Some of the data was obtained by taking a sequence of time slices of the same scene, others from different scenes.
CONCLUSION
We have shown that using a
Q N N
to model objects with a set of ellipses, we can easily extract features of the objects that preserve the translation and rotation invariance properties. Reasonable results have been obtained using only the spatial information. By this we mean that if we restrict ourselves to consecutive framea only, we still obtain a reasonably high level of correct classification given the inherent complexity of the problem: real images ob-Curtain 1
.o
0.0 0.0FaCe 0.0 1.0 0.0
Face n e e
(a)Confusion matrix for training Data: 26 curtains; 29 faees; 37 trees
n
cbSecr
1
Curt-I
ace
I
~ r e eI
. _ _
0.12
I
0.82 0.06 0.0 I 0.23 0.771
Curtain 1 0.88 I 0.06I
0.06!
(b)Confusion matrix for testing Data: 17 curtains; 17 faces; 13 trees
Table 1: Classification results using Kullback-Leibler distance between his- tograms of angular change
would be simple to use temporal information to improve the results further.
REFERENCES
[l] Lim, S.G., Alder, M.D. and Hadingham, P., Quadratic Neural Nets Pattern Recognition Letters 13
(May
1992) pp325-329.[2] Haig, T.D., Attikiouzel,
Y.
and Alder,M.D.
Border Following: New Defi- nition Gives Improved Border IEE Proc-I, Vol. 139, No.2, pp. 206-211, April1992.
I m
m.m m.7 m . . m.s m.4 m.* m.2 I-
U n m Y m I I