618
Copyright © 2011-15. Vandana Publications. All Rights Reserved.
Volume-5, Issue-2, April-2015
International Journal of Engineering and Management Research
Page Number: 618-630
A Comparative Study of Financial Performance of Select Corporate in
Indian Paper Industry
K. Kumar1, R. Sriram2, R. Ramya3 1
Consultant – HRD, Coimbatore, INDIA 2
Teaching Assistant, Great Lakes Institute of Management, Chennai, INDIA 3
MBA Alumnus 2012-14, Coimbatore Institute of Management and Technology, Coimbatore, INDIA
ABSTRACT
The growth of Indian paper industry has been consistent over the past several years, right from the time it was started. Firms both public and private have been investing in newer methods and technologies for producing papers and have also able to gain reasonable returns of their investments. This is inclusive of using cleaner and greener methods that does not harm the environment. This paper aims to bring out the financial performance of select companies within the industry and analyze them using an application based method named “Numerical Taxonomy” that ranks the selected organisations based on specific criteria. In this paper, we have used critical financial ratios as a specific criterion for the analysis.
I.
INTRODUCTION
The Indian paper industry is expected to grow positively in future at 6 – 8 percent. The anticipated reasons for such growth can be attributed to the evolving changes and the increasing interests shown by local and national government in allocating higher spending for education, in levels of literacy, the growth of print media, the growth in consumption levels on the social front and in combating increasing costs of inputs such as wood, chemicals and coal on the producer side. It is always difficult to pass the increasing costs from rising competitive pressure of imports to the consumers (ICRA Report 2013).
Different research studies made in the past on financial performances covering organisations in / sectors of Textiles, Manufacturing, Engineering, Financial Services, Telecommunication and Paper cite increasing trends of Total investments (YoY), and increasing current asset resulting out of high purchases in inventories
(Cherian Joseph 1998) as reason for varied performances of organisations. Few other studies reveal a satisfactory performance upon liquidity and profitability (R. Swami Nathan 1998), a satisfactory performance on Solvency
(Hema Priya 1998), progressive and continuous growth on fixed deposits (Prashanta Athma 2000), an unsatisfactory management of working capital (Anisha Sam K A 2003), Underperformance assessed in current and quick ratios (Santhosh. K 2004), Sound and Strong Liquidity & Profitability position elicited (Sabapriya Ray 2011). Research studies conducted in social sciences also reveal use of social factors as quantitative parameters to measure performances across different countries comparing different countries on various parameters have adopted a different method of analyzing data to predict outcomes (UNESCO Report, May 1972).
The growth of paper, assessed during the last five years (2008-13) is driven by flexibility in pricing and improvements in demand-supply dynamics without having lost on profitability. Moreover, high cost of depreciation and interest on cost of debt has supported the industry to make way for creation of profits and to pay out debts. This paper presents in brief an analysis of financial performance, different from other methods adopted by usual financial analysts (through ratios) with select premier organisations drawn from the industry.
II.
RESEARCH METHODOLOGY
619
Copyright © 2011-15. Vandana Publications. All Rights Reserved.
(JK) and Seshasayee Paper Board (SPB) have been taken for the study.
2. The financial statements of the past 7 year’s vis-à-vis 2005-06 to 2011-12 have been taken for the purpose of study.
3. The key financial ratios have been calculated from the financial statements and have been used as a tool for measurement of company’s performance.
4. The popular statistical tool named “Numerical Taxonomy”, which is a ranking method based on specific criteria on the key ratios is used in this study.
5. The application of Numerical Taxonomy has primarily been conducted in scientific experiments of studies based in researching micro-organisms. Another research study of UNESCO has performed the same with social factors as assessing parameters between different countries. In this research study, we have attempted the same method using financial ratios as parameters. The Numerical Taxonomy is further explained below.
A Step-wise method for Application of Numerical Taxonomy:
1. Compute the Averages with key financial ratios for all the companies taken up for the study.
2. Place the summary of averages taken for all the companies in one group. Calculate a Mean (µ) and a Standard Deviation ( ) for all the ratios.
3. The method of Taxonomy is further proceeded by the following steps:
a. A Standardised Matrix is created by the following formulae:
Where, is the standardized value for each ratio for all years of the selected companies, a is the value of each ratio and and are the mean and standard deviation as calculated above.
b. Calculate the Distances taking the minimum and maximum values from the standardized values ( ) and subtracting them from the minimum or maximum values taken for the entire ratios depending upon their level of influence in the company. A matrix developed from this distances are known as “Distance Matrix”
c. The values in the Distance matrix are squared to find the ideal distances.
d. The resultant matrix table found out of the squared values is called as the “Ideal Values” or “Ideal Matrix”. This is the deviation that the company has incurred compared to the benchmarked trends.
e. A sum of the squares ( ) and square root of the sum
( ) row-wise (for all companies) and column wise (for all ratios) from “Ideal Values” are to be calculated from the Ideal Matrix. The “x” denotes each of the ideal values from the Ideal Matrix.
f. An average mean (µ), standard deviation ( ) and three standard deviations are developed out of the row-wise (for all companies) sum of squares and square root of sum and written down separately.
g. The average mean and three standard deviations of the row-wise sum and square root of sum are added up together (to cover 99.99 percent in a normal curve). h. The row-wise square root of sum values are taken separately to calculate the performance index values for each company.
i. The performance index is calculated based on the following formulae:
Where, is the value of square root of sum of
individual companies and is the addition of mean and 3 standard deviations.
j The values are arranged in ascending order and are ranked based on their order.
III.
ANALYSIS AND
INTERPRETATION
3.1.1 Debt Equity Ratio
620
Copyright © 2011-15. Vandana Publications. All Rights Reserved.
3.1.2. Current RatioThe Current Ratio for TNPL is almost the lowest for the year ended 2011-12 with 0.67. Comparatively, the same ratio for the other companies have also reduced considerably following the similar lines of strategy adopted for managing working capital. The reduced ratios do not affect the organisation in either way as TNPL has been able to create profits (refer profitability) through waste reuse and recycle strategies to sustain in the business environment. Moreover, it has also invested in creation of cement plant as a horizontal integration.
3.1.3 Quick Ratio
The Quick Ratio or the Liquid Ratio of TNPL is unstable with different values for different periods. The Liquid ratio for the TNPL was 1.19 (2005-06) and in the next year this has reduced to 0.81 and to 0.78 in 2007-08. This fallout of the ratio is primarily attributed to the global financial crisis of 2008. Profiting from paper in 2010-11, TNPL is able to invest them in their new venture into
cements. The result of the siphoning has reduced its current ratio to 0.43 (2011-12) from 1.25 (2010-11). For BILT, JK and SPB, these companies were able to pile up funds during 2007-08 and 2008-09 for future needs. This is evident with the ratio of the organisation showing the highest during the period.
3.1.4 Fixed Assets Turnover Ratio
621
Copyright © 2011-15. Vandana Publications. All Rights Reserved.
3.1.5 Inventory Turnover RatioThe Inventory Turnover ratios for the observed companies (TNPL and BILT) are between 5 and 6 for the periods 2005-11 respectively. JK and SPB are observed to have a much better presentation of ratios between 7 and 12. It is due to the fact that the total capital outlay and investments is quite low for these companies compared to TNPL and BILT. For the year 2011-12, there has been a significant decrease in this ratio since there has been an increase in the value of inventory or an accumulation of raw material and closing stock for the period 2011-12 per se by nearly Rs.12, 000 for TNPL. SPB and JK have considerably managed to keep the ratios to approximately 6.5 to 7 in total. Interesting information to note is about a decrease in Sales (by value terms) for BILT during 2011-12 comparing 2010-11 period.
3.1.6 Debtors Turnover Ratio
The Debtors Turnover Ratio for selected paper companies brings out significant facts on the debt policy of the organisation. Companies such as TNPL and BILT has allowed credit to be a part of the policy and given preference to creation of interest on debt as a revenue model. For companies such as JK and SPB being private, has created sales out of cash has a high turnover ratio.
3.2. Numerical Taxonomy
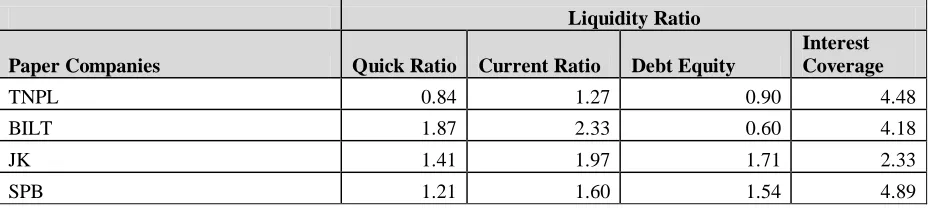
Table 3.2.1: Table showing the Summary of Average Mean (µ) of all ratios for Selected Companies by Category
Liquidity Ratio
Paper Companies Quick Ratio Current Ratio Debt Equity
Interest Coverage
TNPL 0.84 1.27 0.90 4.48
BILT 1.87 2.33 0.60 4.18
JK 1.41 1.97 1.71 2.33
622
Copyright © 2011-15. Vandana Publications. All Rights Reserved.
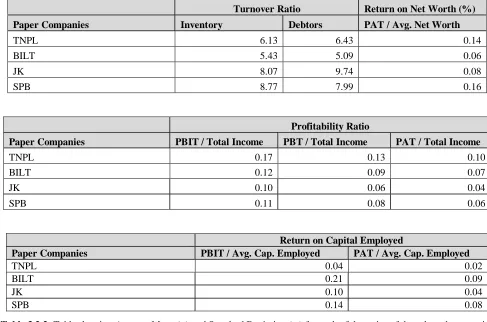
Turnover Ratio Return on Net Worth (%)
Paper Companies Inventory Debtors PAT / Avg. Net Worth
TNPL 6.13 6.43 0.14
BILT 5.43 5.09 0.06
JK 8.07 9.74 0.08
SPB 8.77 7.99 0.16
Profitability Ratio
Paper Companies PBIT / Total Income PBT / Total Income PAT / Total Income
TNPL 0.17 0.13 0.10
BILT 0.12 0.09 0.07
JK 0.10 0.06 0.04
SPB 0.11 0.08 0.06
Return on Capital Employed
Paper Companies PBIT / Avg. Cap. Employed PAT / Avg. Cap. Employed
TNPL 0.04 0.02
BILT 0.21 0.09
JK 0.10 0.04
SPB 0.14 0.08
Table 3.2.2: Table showing Average Mean (µ) and Standard Deviation ( ) for each of the ratios of the selected companies
Liquidity Ratios
Companies Quick Ratio Current Ratio Debt-Equity Interest Coverage
TNPL 0.84 1.27 0.90 4.48
BILT 1.87 2.33 0.60 4.18
JK 1.41 1.97 1.71 2.33
SPB 1.21 1.60 1.54 4.89
Mean (µ) 1.33 1.79 1.19 3.97
Standard Deviation ( ) 0.43 0.46 0.53 1.13
Companies Turnover Ratios Return on Net Worth (%) Inventory Debtors PAT/Avg.Net Worth
TNPL 6.13 6.43 0.14
BILT 5.43 5.09 0.06
JK 8.07 9.74 0.08
SPB 8.77 7.99 0.16
Mean (µ) 7.10 7.31 0.11
623
Copyright © 2011-15. Vandana Publications. All Rights Reserved.
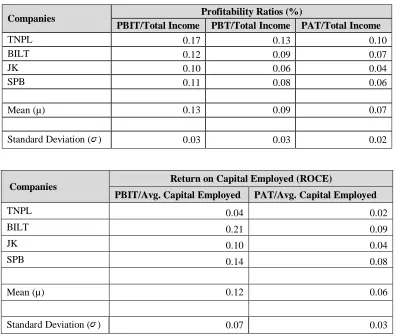
Companies Profitability Ratios (%)PBIT/Total Income PBT/Total Income PAT/Total Income
TNPL 0.17 0.13 0.10
BILT 0.12 0.09 0.07
JK 0.10 0.06 0.04
SPB 0.11 0.08 0.06
Mean (µ) 0.13 0.09 0.07
Standard Deviation ( ) 0.03 0.03 0.02
Companies Return on Capital Employed (ROCE)
PBIT/Avg. Capital Employed PAT/Avg. Capital Employed
TNPL 0.04 0.02
BILT 0.21 0.09
JK 0.10 0.04
SPB 0.14 0.08
Mean (µ) 0.12 0.06
Standard Deviation ( ) 0.07 0.03
Table 3.2.3: Table showing the Standardized Matrix Values for all Ratios for Selected Companies
Liquidity Ratio
Companies Quick Ratio Current Ratio Debt-Equity Ratio Interest Coverage Ratio
TNPL -1.15 -1.14 -0.55 0.45
BILT 1.26 1.17 -1.12 0.19
JK 0.17 0.38 1.00 -1.45
SPB -0.28 -0.42 0.67 0.81
Companies Turnover Ratio Return on Net Worth (%) Inventory Debtors PAT/Avg.Net Worth
TNPL -0.62 -0.44 0.68
BILT -1.06 -1.11 -1.09
JK 0.62 1.21 -0.59
SPB 1.06 0.34 1.00
Companies Profitability Ratio (%)
PBIT/Total Income PBT/Total Income PAT/Total Income
TNPL 1.46 1.35 1.23
624
Copyright © 2011-15. Vandana Publications. All Rights Reserved.
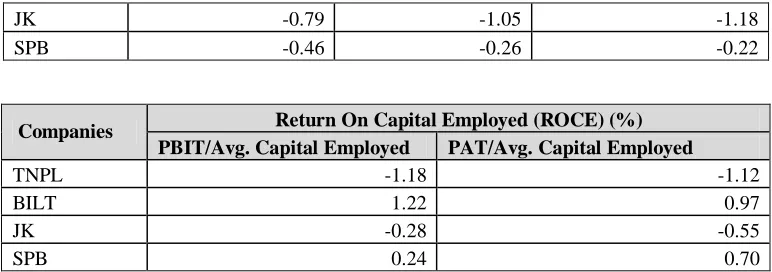
JK -0.79 -1.05 -1.18
SPB -0.46 -0.26 -0.22
Companies Return On Capital Employed (ROCE) (%) PBIT/Avg. Capital Employed PAT/Avg. Capital Employed
TNPL -1.18 -1.12
BILT 1.22 0.97
JK -0.28 -0.55
SPB 0.24 0.70
Table 3.2.4: Table showing selection of ideal ratios for selected companies (highlighted values highest or lowest depending upon their influence in performance)
Selection of Ideal Ratios for Each Company Liquidity Ratios
Companies Quick Ratio Current Ratio Debt-Equity Ratio Interest Coverage Ratio Values Taken Highest Highest Lowest Highest
TNPL -1.15 -1.14 -0.55 0.45
BILT 1.26 1.17 -1.12 0.19
JK 0.17 0.38 1.00 -1.45
SPB -0.28 -0.42 0.67 0.81
Companies Turnover Ratios Return on Net Worth (%) Inventory Debtors PAT/Avg.Net Worth Values Taken Highest Highest Highest
TNPL -0.62 -0.44 0.68
BILT -1.06 -1.11 -1.09
JK 0.62 1.21 -0.59
SPB 1.06 0.34 1.00
Companies Profitability Ratios (%)
PBIT/Total Income PBT/Total Income PAT/Total Income Values Taken Highest Highest Highest
TNPL 1.46 1.35 1.23
BILT -0.21 -0.04 0.17
JK -0.79 -1.05 -1.18
SPB -0.46 -0.26 -0.22
Companies Return On Capital Employed (ROCE)
625
Copyright © 2011-15. Vandana Publications. All Rights Reserved.
TNPL -1.18 -1.12
BILT 1.22 0.97
JK -0.28 -0.55
SPB 0.24 0.70
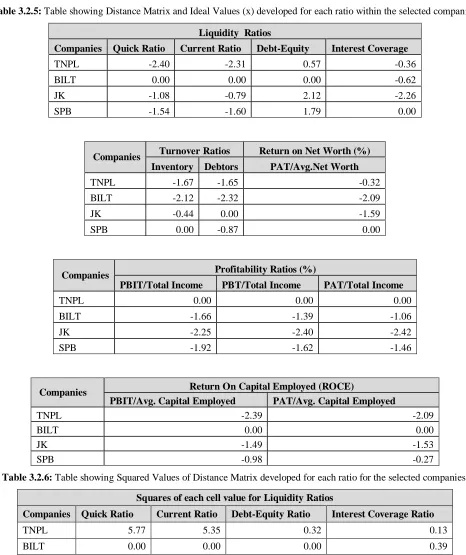
Table 3.2.5: Table showing Distance Matrix and Ideal Values (x) developed for each ratio within the selected companies.
Liquidity Ratios
Companies Quick Ratio Current Ratio Debt-Equity Interest Coverage
TNPL -2.40 -2.31 0.57 -0.36
BILT 0.00 0.00 0.00 -0.62
JK -1.08 -0.79 2.12 -2.26
SPB -1.54 -1.60 1.79 0.00
Companies Turnover Ratios Return on Net Worth (%) Inventory Debtors PAT/Avg.Net Worth
TNPL -1.67 -1.65 -0.32
BILT -2.12 -2.32 -2.09
JK -0.44 0.00 -1.59
SPB 0.00 -0.87 0.00
Companies Profitability Ratios (%)
PBIT/Total Income PBT/Total Income PAT/Total Income
TNPL 0.00 0.00 0.00
BILT -1.66 -1.39 -1.06
JK -2.25 -2.40 -2.42
SPB -1.92 -1.62 -1.46
Companies Return On Capital Employed (ROCE)
PBIT/Avg. Capital Employed PAT/Avg. Capital Employed
TNPL -2.39 -2.09
BILT 0.00 0.00
JK -1.49 -1.53
SPB -0.98 -0.27
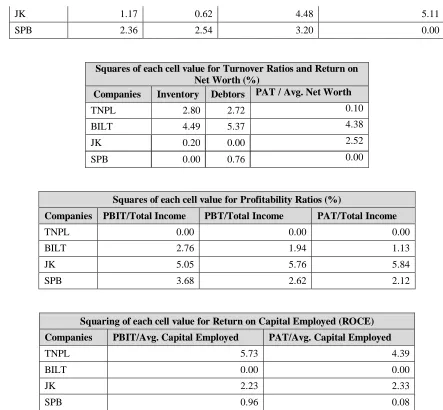
Table 3.2.6: Table showing Squared Values of Distance Matrix developed for each ratio for the selected companies.
Squares of each cell value for Liquidity Ratios
Companies Quick Ratio Current Ratio Debt-Equity Ratio Interest Coverage Ratio
TNPL 5.77 5.35 0.32 0.13
626
Copyright © 2011-15. Vandana Publications. All Rights Reserved.
JK 1.17 0.62 4.48 5.11
SPB 2.36 2.54 3.20 0.00
Squares of each cell value for Turnover Ratios and Return on Net Worth (%)
Companies Inventory Debtors PAT / Avg. Net Worth
TNPL 2.80 2.72 0.10
BILT 4.49 5.37 4.38
JK 0.20 0.00 2.52
SPB 0.00 0.76 0.00
Squares of each cell value for Profitability Ratios (%)
Companies PBIT/Total Income PBT/Total Income PAT/Total Income
TNPL 0.00 0.00 0.00
BILT 2.76 1.94 1.13
JK 5.05 5.76 5.84
SPB 3.68 2.62 2.12
Squaring of each cell value for Return on Capital Employed (ROCE) Companies PBIT/Avg. Capital Employed PAT/Avg. Capital Employed
TNPL 5.73 4.39
BILT 0.00 0.00
JK 2.23 2.33
SPB 0.96 0.08
Table 3.2.7: Table showing development of Sum of Squares ( ) and Square root of Sum ( ) for each selected company.
Sum of Squares and Square root of Sum for Liquidity ratios of selected companies Comp Quick Ratio Current Ratio Debt-Equity Ratio Interest Coverage
Ratio ( ) ( )
TNPL 5.77 5.35 0.32 0.13 11.57 3.40
BILT 0.00 0.00 0.00 0.39 0.39 0.62
JK 1.17 0.62 4.48 5.11 11.39 3.38
SPB 2.36 2.54 3.20 0.00 8.11 2.85
( ) 9.31 8.52 8.00
627
Copyright © 2011-15. Vandana Publications. All Rights Reserved.
Sum of Squares and Square root of Sum forTurnover ratios of selected companies
Companies Inventory Debtors ( ) ( )
TNPL 2.80 2.72 5.53 2.35
BILT 4.49 5.37 9.86 3.14
JK 0.20 0.00 0.20 0.44
SPB 0.00 0.76 0.76 0.87
( ) 7.49 8.85
( ) 2.74 2.97
Sum of Squares and Square root of Sum for Profitability ratios (%) of selected companies
Comp PBIT/Total Income PBT/Total Income PAT/Total Income ( ) ( )
TNPL 0.00 0.00 0.00 0.00 0.00
BILT 2.76 1.94 1.13 5.84 2.42
JK 5.05 5.76 5.84 16.65 4.08
SPB 3.68 2.62 2.12 8.41 2.90
( ) 11.49 10.32 9.10
( ) 3.39 3.21 3.02
Sum of Squares and Square root of Sum for Return on Net Worth (%) ratio of selected companies
Companies PAT/Avg.Net Worth ( ) ( )
TNPL 0.10 0.10 0.32
BILT 4.38 4.38 2.09
JK 2.52 2.52 1.59
SPB 0.00 0.00 0.00
( ) 7.00
( ) 2.65
Sum of Squares and Square root of Sum for Return on Capital Employed (%) ratio of selected companies
Companies PBIT/Avg. Capital Employed PAT/Avg. Capital Employed ( ) ( )
TNPL 5.73 4.39 10.12 3.18
BILT 0.00 0.00 0.00 0.00
JK 2.23 2.33 4.56 2.14
SPB 0.96 0.08 1.04 1.02
( ) 8.92 6.80
628
Copyright © 2011-15. Vandana Publications. All Rights Reserved.
Table 3.2.8: Table showing row-wise Sum of Squares ( ), Square of Root of Sum ( ), Average Mean (µ), Standard Deviation ( ) and 3 Standard Deviation (3 ), Mean + 3 Standard Deviation (µ + 3 ) for all companies.
Liquidity Turnover
Companies ( ) ( ) ( ) ( )
TNPL 11.57 3.40 5.53 2.35
BILT 0.39 0.62 9.86 3.14
JK 11.39 3.38 0.20 0.44
SPB 8.11 2.85 0.76 0.87
Avg. Mean (µ) 7.87 2.56 4.08 1.70
S. D. ( ) 5.23 1.32 4.53 1.26
3 S. D. (3 ) (99.99%) 15.69 3.95 13.59 3.78
Mean+ 3 SD (µ + 3 ) 23.56 6.51 17.68 5.48
Profit Return on Net Worth
Companies
( ) ( ) ( ) ( )
TNPL 0.00 0.00 0.10 0.32
BILT 5.84 2.42 4.38 2.09
JK 16.65 4.08 2.52 1.59
SPB 8.41 2.90 0.00 0.00
Avg. Mean (µ) 7.73 2.35 1.75 1.00
S. D. ( ) 6.91 1.72 2.10 1.00
3 S. D. (3 ) (99.99%) 20.74 5.15 6.31 3.00
Mean+ 3 SD (µ + 3 ) 28.47 7.49 8.06 4.00
Return on Capital Employed
Companies ( ) ( )
TNPL 10.12 3.18
BILT 0.00 0.00
JK 4.56 2.14
SPB 1.04 1.02
Avg. Mean (µ) 3.93 1.58
S. D. ( ) 4.57 1.38
3 S. D. (3 ) (99.99%) 13.70 4.13
Mean+ 3SD(µ+3 ) 17.63 5.71
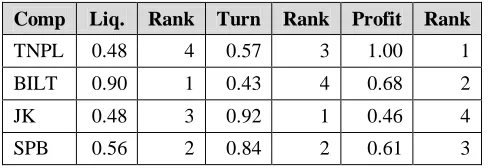
Table 3.2.9: Table showing Performance Index of selected companies
Comp Liq. Rank Turn Rank Profit Rank
TNPL 0.48 4 0.57 3 1.00 1
BILT 0.90 1 0.43 4 0.68 2
JK 0.48 3 0.92 1 0.46 4
629
Copyright © 2011-15. Vandana Publications. All Rights Reserved.
CompaniesReturn on Net Worth
(RONW)
Rank Return on Capital
Employed (ROCE) Rank
TNPL 0.92 2 0.44 4
BILT 0.48 4 1.00 1
JK 0.60 3 0.63 3
SPB 1.00 1 0.82 2
IV.
FINDINGS OF THE STUDY
1. The Debt Equity Ratio of the organisations studied show that the ratio of debt capital of TNPL is on an increasing trend until 2011-12 and then slides down below 1.00. For the other organisations, it has been found that the ratio of debt capital vs. shareholder funds looks fluctuating year on year from 2005-06 till 2013-14. However, the ratio of debt capital of the selected paper companies has been competitive for the selected years. The debt portion of the private organisations such as BILT, JK and SPB is quite higher due to being a private enterprise whereas TNPL is a government organisation. 2. The Current Ratio of organisations studied,
indicate varied differences in ratios among all organisations primarily due to differences in the value and availability of operating cash. However, the ratios have been reducing to normalize and have similar values by 2012-13 and 2013-14 respectively due to increase in short term borrowings. for these selected companies during 2013-14 the ratios tend to fall in line with each other having similar values indicating a stringent effort of g capital requir. that the amount of current assets of the organisation is reducing year on year for few companies and fluctuating for other companies. It is evident that the organisations of similar nature are having continuous changes in the structure of working capital need year on year.
3. The Quick Ratio of TNPL and other similar organisations indicate that the companies have been working closely to stabilize this ratio in competition with one another. TNPL, with its investments in new ventures utilized the cash balances for new venture. For other organisations, the cash balances have almost been found showing an inconsistent trend ue to the reasons of Global Melt Down where these companies would have used the existing pile up of cash balances for sustainability of businesses.
4. The yield ratio of Fixed Assets to the Annual Sales is much more for other organisations except TNPL where continuous investments are found in foreign machineries for industrial development and future focus. For TNPL the net yield in the investments have not increased their Annual Sales.
5. The decrease in the Inventory Ratio for TNPL is attributed to the increase in the value of inventory or accumulation of raw material and closing stock for the period 2011-12. The other similar organisations have considerably managed to keep the ratios to a consistent value.
6. The accumulated values in terms of the debtors for JK and SPB are converted in cash at a much higher rate than TNPL and BILT. The performance of JK and SPB is better than those of TNPL and BILT.
7. TNPL has been working very closely towards building sales and also increasing or deferring the payables which signals the increased values. For other organisations, the sales value has increased on an average of 20 percent per year that has resulted in maintaining a consistent ratio.
8. Ballarpur Industries Limited (BILT) takes the first position in terms of Liquidity Ratios, followed by Seshasayee Paper Board (SPB), JK Papers Limited (JK) and Tamil Nadu News Print Limited (TNPL) respectively.
9. JK Papers Limited (JK) takes the first position in terms of Turnover Ratios, followed by Seshasayee Paper Board (SPB), Tamil Nadu News Print Limited (TNPL) and Ballarpur Industries Limited (BILT).
10. Seshasayee Paper Board (SPB) takes the first position in terms of Profitability followed by Tamil Nadu News Print Limited (TNPL), Ballarpur Industries Limited (BILT) and JK Papers Limited (JK) respectively.
630
Copyright © 2011-15. Vandana Publications. All Rights Reserved.
12. Tamil Nadu News Print Limited (TNPL) takes the first position in terms of Return on Capital Employed, followed by Seshasayee Paper Board (SPB), JK Papers (JK) and Ballarpur Industries Limited (BILT).
V.
CONCLUSION
TNPL stands as a popular organisation with several values generated with great experience and focus. However comparing the competitive environment in which TNPL presently operates and with policy decisions continuously changing with certain changes in governments, an organisation’s investment and focus towards people and its resources are necessary to be a premier in their respective industries regardless of their economic capabilities. The project study at TNPL has provided me an extended knowledge of the impact of financial analysis and its interpretations about the business scenario. The project study has helped me to understand not only about TNPL as an organisation but also the operatives of the other similar and competitive organisation.
REFERENCES
[1] Dr. N.P. Srinivasan and Dr. M. Sakthivel Murugan “Accounting for Management’’, Revised Edition on 2013, S. Chand & Company Ltd, New Delhi.
[2] M. Y. Khan and P. K. Jain, (2001), “Financial Management”, 6th Edition, (Tata McGraw Hill Publishing Company Limited), New Delhi.
[3] I.M. Pandey, (2003) “Financial Management”, 8th Edition, (Vikas Publishing House Private Limited), New Delhi.
[4] Dr. S. N. Maheshwari, (2003), “Financial Management”, 6th Edition, Sultan Chand & Sons Publishing Company Limited, New Delhi.
[5] Nitin Balwani , Accounting & Finance for Managers, 1st
[13] Sabapriya Ray, Dissertation Report 2011, “A Study on Financial Performance of Indian Paper and Paper Product Companies from 2000-01 to 2008-09”. Edition 2000, (AMEXCEL Publishers Private Limited), New Delhi.
[6] R. Ananthi and R. Sriram, Journal of Contemporary research in Management “PSG Institute of Management” Jan-March 2012 issue, ISSN: 0973-9785.
[7] Cherian Joseph, Dissertation Report 1998, “A Study on Financial Performance of Textile Industry in India from 1978-88”, Coimbatore.
[8] R. Swami Nathan, Dissertation Report 1998, “A Study on Financial Performance of Lakshmi Mills Company Limited, Coimbatore”.
[9] Hema Priya, Dissertation Report 1998, “A Study on Financial Performance of M/s. Veejay Lakshmi Engineering Company”.
[10] Prashanta Athma, Doctoral Dissertation 2000, “A Study on Performance of Public Sector Banks – A Case Study of State Bank of Hyderabad”, University of Hyderabad.
[11] Anisha Sam K, Dissertation Report 2003, “A Study on Financial Performance of Steel Industry in Kerala from 1997-98 to 2001-02”.