ISSN: 2252-8938, DOI: 10.11591/ijai.v9.i3.pp507-519 507
Fault-type coverage based ant colony optimization algorithm
for attaining smaller test suite
Bharathi M1, Sangeetha V21Department of Computer Science, Periyar University College, Pennagaram, Tamilnadu, India 2Department of Computer Science, Periyar University College, Pappireddipatty, Tamilnadu, India
Article Info ABSTRACT
Article history: Received Feb 3, 2020 Revised Apr 8, 2020 Accepted May 22, 2020
In this paper, we proposed Fault-Type Coverage Based Ant Colony Optimization (FTCBACO) technique for test suite optimization. An algorithm starts with initialization of FTCBACO factors using test cases in test suite. Then, assign separate ant to each test case called vertex. Each ant chooses best vertices to attain food source called objective of the problem by means of updating of pheromone trails and higher probability trails. This procedure is repeated up to the ant reaches food source. In FTCBACO algorithm, minimal number of test cases with less execution time chosen by an ant to cover all faults type (objective) are taken as optimal solution. We measured the performance of FTCBACO against Greedy approach and Additional Greedy Approach in terms of fault type coverage, test suite size and execution time. However, the heuristic Greedy approach and Additional Greedy approach required more execution time and maximum test suite size to provide the best resolution for test suite optimization problem. Statistical investigations are performed to finalize the performance significance of FTCBACO with other approaches that concludes FTCBACO technique enriches the reduction rate of test suite and minimizes execution time of reducing test cases efficiently.
Keywords:
Additional greedy approach Ant colony optimization Fault-type coverage Greedy approach Test suite optimization
This is an open access article under the CC BY-SA license.
Corresponding Author: Bharathi M,
Department of Computer Science,
Periyar University College of Arts and Science, Pennagaram, Dharmapuri, Tamilnadu, India. Email: [email protected]
1. INTRODUCTION
The Software revises numerous times during its development phase and later. Revision of software application program is required when new attributes and functionalities are introduced [1]. After renovation, software testing is essential to test the software application program to assure that the system is functioning properly with recent modifications. Software testing is the most significant role of an effective software product. Software testing is the procedure of executing the software program for discovering faults which cause software failure. Combinatorial testing (CT) is an effective software testing technique used to identify the faults during pair of feature combinations of Software Program Applications (SPA). Quality of software program is achieved by means of right and proper test suite. CT is essential for effective test suite generation. Main objective of software testing is to generate a group of tiniest test cases which comprises higher faults in least time. Hence, quality of software program is measured in terms of software metrics like maximum faults coverage, minimum test suite size and minimum computational time. Computation time of huge test suites is supposed as a bottleneck while building huge software. Therefore test suite size optimization is essential to
reduce the computational cost. Test suite size optimization is classified into minimization of test suite size, selection of test case, prioritization of test case [2]. Test suite size minimization is the method of choosing test cases that fulfills specified constraints. Additionally, test suite optimization plays essential role to reduce he testing cost of SPA without corrupting their quality factors. So, this investigation work aims test suite optimization proficiently for increasing the ability of SPA.
We have recognized 2 various heuristic algorithms called Greedy Strategy based algorithm [3] and Additional Greedy Strategy based algorithm [4] for conducting this research as baseline algorithms. In Greedy approach [3], test cases are arranged in descending order based on their fault coverage ability and begins with test cases that cover highest quantity of faults till either all the faults are covered or test adequacy condition is encountered. Additional Greedy approach [4] differs from the greedy approach while choosing test cases for addition in the minimized test suite. Initially, it selects the test case which includes the highest amount of faults. Then it selects the test case which includes the highest number of still unobserved faults by the minimized test suite. Same process repeated till all the faults are observed. But we observed that both baseline algorithms are required more execution time to optimize the test suite.
To overcome the above cited issues in test suite optimization problem using Greedy and additional greedy approach, Fault-Type Coverage Based Ant Colony Optimization (FTCBACO) algorithm Technique is built. FTCBACO algorithm is designed based on maximum faults-type coverage analysis and produce an efficient optimum resolution. The major contributions of FTCBACO technique is expressed as follows, To enhance the ability of test suite reduction for software testing.
To increase the test suite reduction rate and to decrease the execution time for software testing compared with Greedy and Additional Greedy approaches.
To optimize test cases in test suite in terms of maximum faults type coverage and minimum execution time.
We have presented 3 research questions for more clarification about the performance of proposed FTCBACO algorithm.
RQ1: Is there any dissimilarity in their capability of detecting faults of various heuristic approaches? RQ2: Does heuristic methods differ from each other in their ability of optimized test suite size? RQ3: How do variance present in execution time of various heuristic approaches?
The investigation work of this paper is outlined as follows. Section 2 reviews the related works. In Section 3, we explain implementation process of FTCBACO for test suite optimization problem with an illustrative example. Section 4 reports results analysis and discussions. In section 5, we conclude this paper.
2. RELATED WORKS
Chen and Lau [5] presented GRE methodology for minimization. This methodology is based on 3 methods-Essential method, 1-to-1 redundant method, Greedy method. In this methodology, initially important test cases are nominated and inserted into set, after that 1-to-1 repeated test cases are eliminated continually. Now greedy methodology is used on the pending test cases till all the necessities are fulfilled. GRE assured to create optimal sets. Khalilian and Parsa [6] projected Bi-criteria test suite reduction with cluster analysis of execution profiles. They merged distribution-based technique with coverage-based technique to build full coverage reduced test suites. Coverage based techniques used for test case selection which contains faults. Distribution based techniques used for clustering the test cases. These two techniques combined to form a reduced set with full coverage. Finally they generated reduced test suites with a lesser amount of fault identification capability. Tallam and Gupta [7] proposed inspired greedy algorithm for test suite reduction which is based on the relation between test cases and testing requirements. For reduction, test cases are assumed as objects and requirements as their attributes. Context table (test suite) was built based on association among object and attributes. Aim of proposed algorithm is to reduce context table size. For reducing objects and attributes, Object reduction rules and attribute reduction rules are utilized. Context table size was reduced using object reductions, attribute reduction and owner reduction. The size of context table was slightly reduced by eliminating duplicate objects. Finally size of context table was minimized. Yoo and Harman [8] proposed using hybrid algorithm for Pareto efficient multi-objective test suite minimization. They merged the greedy approach with the genetic algorithm to offer Pareto fronts with high quality. Testing results prepared by their method were more proficient. Chen, Zhang and Xu [9] recommended degraded ILP Approach for Test Suite Reduction. In this approach, lower bound of minimum test suite was produced and was searched feasible solution nearby lower bound. If representative set size matches with lower bound at that point representative set considered as finest result, if representative set size is nearer to lower bound at that moment representative set judged as good result, and if representative set size is distant from lower bound then Integer Linear Programming or any other expensive method was
required for improving representative set. They concluded DILP approach provided better results than traditional approaches. Harris and Raju [10] have proposed a greedy approach for coverage-based test suite reduction. They obtained reduced test suite size based on code coverage criteria. Then they compared its performance results with bi-objective greedy techniques as well as HGS. Chen and Lau [11] offered divide-and-conquer approach for test suite reduction. They focused on dividing approaches that are whole with respect towards the least and optimal representative sets. Divide-and-conquer approach fundamentally split the original problem into smaller sub problems, discover optimal results for the sub problems, and build a result for the original problem from result of the sub problems. They obtained needed subset and repeated subset relating to needed test cases and repeated test cases separately. Needed subset holds needed test case. A repeated subset whose fulfilled requirements can be fulfilled by other test cases. Finally, representative set comprised needed subset and rejected repeated subset. Galeebathullah and Indumathi [12] proposed a novel approach for controlling a size of a test Suite. Greedy approach and set theory were used to produce reduced sets. They have used intersection function to find the unsatisfied unique elements. Then the intersection between one elements to other elements of branch coverage criteria was found using set theory for the set of test cases. Initially, they have calculated intersection between the elements. If any intersection elements take place then the test case is included into reduced test suite. This procedure was continued till whole requirements are fulfilled. Finally reduced test suites have similar size compared to other approaches. You and Lu [13] recommended Genetic Algorithm for the Time-Aware Regression Testing Reduction Problem. Time criteria were added with the genetic algorithm. Main objective of recommended technique is to reduce the computational time. At the end, all the redundant test cases were removed and also reduced computational time. Chen et al. [14] have proposed test case prioritization technique using clustering approach based on random sequence for object-oriented software. Khan and Nadeem [15] suggested Test Filter for reduction of test cases. Based on statement coverage criteria, weights given to each test case. Total existences of each test case denoted as weight. They nominated non-redundant test cases with respect to their weights. Initially, test case with higher weight are selected. Then test cases with lower weight are selected till all the necessities are fulfilled. Selected test cases are included into reduced test suite set. Finally TestFilter technique offered reduction in test suite size and computational cost. Zhao and Luo [16] proposed an algorithm for Reducing Test Suites based on Interface Parameters. In this algorithm, interface parameters and bipartite graph were used to eliminate duplicate test cases. Based on relationship between interface parameters this technique was worked. This approach reduced the size and redundancy of test suite. However coverage size was same. Most important drawback of this procedure was a graph could not be complete bipartite graph. Miller and Spooner [17] have applied numerical maximization methods to make test data using floating point data. They have attained enormous reduction in computational cost and also storage space. Harrold et al. [18] have recommended HGS algorithm. From the original test suite, HGS algorithm determined reduced representative test suite. At the end, HGS algorithm provided the equal original coverage and removed duplicate test cases. Rothermel and Harrold [19] suggested a safe, efficient regression test selection technique. In this approach, they have used control flow graph. This approach was obtained in generic nature. So, it was used to examine the software which were written in various languages. Xu, Miao and Gao [20] proposed test suite reduction using weighted set covering techniques. In this technique, weighted greedy algorithm was used for test suite reduction. Initially they have determined that whether any test case fulfills all the requirements or not. If fulfilled, test case selected otherwise frequently 1-to-1 redundant test cases were eliminate and test suite updated. They have selected necessary test cases and included into reduced set. Priorities are given to test cases which have uncovered requirements and sorted. Based on decreasing priority order, test cases have chosen till all the requirements are fulfilled. Finally this technique produced optimized test suite size with minimum testing cost. Harrold and Soffa [21] proposed an incremental approach to unit testing during maintenance. In this approach, they have considered testing effort during software maintenance. Lin and Huang [22] have proposed an analysis of test suite reduction with enhanced tie-breaking techniques. They Combined HGS and GRE approaches to find higher reduced test suite size based on capability of faults detection. Jeffrey and Gupta [23] have projected test suite reduction with selective redundancy. This proposed technique was used to cut the fault identification cost by removing duplicate test cases. They have found redundant test cases using branch coverage data. This technique provided slightly reduced test suite size with better fault identification effective. Boussai et al. [24] have discussed various metaheuristic optimization techniques. Dokeroglu et al. [25] argued new generation metaheuristic algorithms. Ilango et al. [26] have presented Optimization using Artificial Bee Colony based clustering approach for big data. Vimal et al. [27] proposed Energy enhancement using Multiobjective Ant colony optimization with Double Q learning algorithm for IoT based cognitive radio networks.
3. FAULT-TYPE COVERAGE BASED ANT COLONY OPTIMIZATION (FTCBACO)
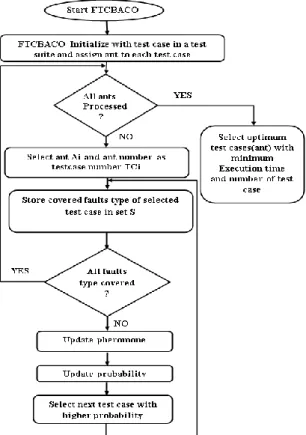
Fault-Type Coverage Based Ant Colony Optimization (FTCBACO) Technique is planned to solve the issues in Greedy approach and Additional Greedy approach for test suite reduction problem. FTCBACO designed based on metaheuristic Ant Colony Optimization (ACO) Algorithm for achieving test suite reduction rate in high-level, minimization of execution time and maximum faults type coverage to improve the efficiency of RT. Swarm intelligence (SI) techniques are used for resolving computational problems. ACO is intended from SI techniques. The ACO algorithm is constructed using graphs for finding an optimal path depending up on the ants behavior. With the help of Pheromone (chemical substances) omitted by an ant, ant selects path from its colony to food source and return to colony. Foragers track the path to reach food source by observing pheromone trail of other ants. As a result, an optimal path found from their colony to food source. Based on the concept of ACO algorithm, FTCBACO algorithm designed to find optimum test cases in a test suite in terms of maximization of test suite reduction with minimum execution time for achieving all faults type. In FTCBACO algorithm, ant considers test case as vertex and probability of test case as weight of an edge. Ant chooses a test case with higher probability value (edge) as best test case to obtain all faults type as food source (objective). The real impact of each ant is to obtain all faults type of a problem. The probability value of edges is calculated using the pheromone value of test case deposited on path. Also FTCBACO algorithm is required three control parameters α, β and ρ to optimize the problem. The values of α, β parameter defines the relationship between pheromone value and heuristic value. The parameter ρ represents evaporation rate and its value must be defined the range between 0 and 1. Optimal combination of α, β, ρ helps to evaluate the proposed FTCBACO algorithm effectively. Combinatorial testing plays a key role to search a best combination of α, β, ρ values. The values of α, β, ρ are determined based on the problem during implementation phase. The data flow diagram of Fault-Type Coverage Based Ant Colony Optimization (FTCBACO) algorithm is presented in Figure 1.
Figure 1. Flowchart of fault-type coverage based ant colony optimization (FTCBACO) algorithm
Figure 1 demonstrates the overall process of proposed FTCBACO algorithm to solve test case reduction for regression testing. Initialize FTCBACO algorithm with test case in a test suite and assign ant Ai to test case TCi where i=1,..,n. Select ant Ai and its corresponding Test case TCi is stored in set MTS of Ai and covered faults type into set FTCi. To check whether all faults type is covered by selected ant or not. If set
FTCj where j=1,2,…nof ant Ai contains all faults type then move to next ant. Otherwise update pheromone of ant Ai using equation (2) or (3) based on constraints, probability of ant Ai using (4) and select next test case with higher probability. The similar process will be repeated until all ants covered all faults type. Now we obtained test case path with all faults type covered for all ants. Afterwards, we compared execution time of all the ants and finest ant is elected with minimum execution time and smaller number of test case in test case path.
3.1. Procedure of FTCBACO
The procedure of FTCBACO algorithm is presented down, Algorithm 1: Fault-Type Coverage Based Ant Colony Optimization
Terms used: T-Test Suite , A1,A2,..,An - Set of Ants in T, TC1,TC2,…,TCn - Set of test cases in T, FT1,FT2,…,FTn -Set of faults type
covered by each test case in T, MTSi - Minimized Test Suite of Ant Ai, FTCi - Set of faults type covered by test cases in MTSi,
TFCi – Total faults type covered by MTSi, TFT – Total faults type in T, LTP-length of test case path, PT-Pheromone trail of each test
case, P-Probability of test case.
Input: Group of test cases (TC1,TC2,…,TCn) , faults type covered (FTC) by each test case, total faults type covered(TFC) of each test
case in a test suite T.
Output: Optimized test cases which covered all faults type in minimum execution time. 1. Begin
2. Derive set of faults type and total faults type covered by each test case in T.
3. Set TCx ← Ax where x=1,2,…n.
4. Initialize PTx ← 1.0, MTSx ← ф, FTCx ← ф, TFCx ← ф
5. Define objective function F(x)=TFT given to a problem 6. Initialize i ← 1,k← i
7. for each Ai in T do
8. Set MTSi ← TCk, FTCi ← {faults type covered by TCk},
TFCi ← total faults type covered by TCk , LTP ← 1
9. Test case in MTSi marked as visited (*).
10. Initialize r ← i
11. If ( TFCi == TFT ) Then
12. Goto step 34
13. Else
14. While ( TFCi!= TFT)
15. Initialize j ← 1
16. For each TCj in T do
17. If( r== j) then
18. update pheromone PTj using equation (1)
19. update probability Pj using equation (3)
20. Set j ← j + 1
21. Else
22. update pheromone PTj using equation (2)
23. update probability Pj using equation (3)
24. Set j ← j + 1
25. End if
26. End for
27. Find unvisited test case t with maximum P of T,
28. Set TFCi ←TFCi + number of new fault types covered by test case t
29. Set MTSi ← MTSi∪ {t}
30. Set FTCi ← FTCi ∪ { fault types covered by test case t }
31. Set LTPi ← LTPi+1
32. End While
33. End if 34. Set i ← i + 1 35. Set k← i 36. End for
37. Select ant with minimum of execution time and minimum length test case path 38. Consider Test cases in selected test case path of an ant as optimium test cases in T. 39. End
3.2. Functions of FTCBACO
FTCBACO has two major functions for selecting next test case to achieve an objective function of the problem.
Update pheromone
Upadate probability 3.2.1. Update pheromone
If the ant number is same as selected test case number then the pheromone of test case is evaluated using (1). Otherwise evaluated using (2).
pheromone[i] = (1 − ρ) ∗ pheromone[i] + (covered faults[i]
total faults ) (1)
pheromone[i] = (1 − ρ) ∗ pheromone[i] (2)
From (1) and (2), pheromone [i] represents amount of pheromone on test case and ρ represents pheromone evaporation rate and covered faults [i]
total faults represents amount of pheromone deposited. 3.2.2. Update probability
The probability of test case is updated using equation (3) and the test case of highest probability is selected as next test case visited by the ant.
probability[i] = [
covered faults[i] total faults ]
α
∗ [pheromone[i]]β
∑ [[covered faults[i]
total faults ] α
∗ [pheromone[i]]β ] n
i=1
(3)
3.3. Demonstrative with example
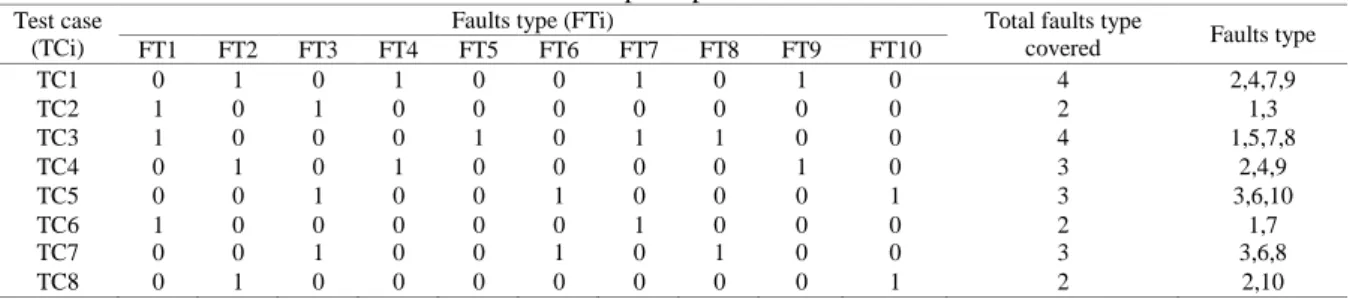
An example is demonstrated to exhibit the functioning of FTCBACO algorithm in regard to existing Greedy approach and Additional Greedy approach. In this example, we considered a sample input fault matrix with 8 test cases (rows) and 10 faults type (column) are shown in Table 1. Fault matrix can be encoded using binary values either 0 or 1, where 1 represents a fault type FTi covered by its associated test case TCi and 0 represents that a fault type is not covered. Hence, number of faults type covered by associated test case can be determined using sample input fault matrix. Then, the ranges of control parameters α, β are assumed between 0 and 10 and ρ between 0 and 1. Now mixture of parameters α, β, ρ yielded 179 combinations and we proceeded the algorithm 10 times for every combinations. Finally we identified optimal combination of parameters value are α=2, β=1, ρ=0.4 for improving performance of the algorithm. Then the proposed FTCBACO algorithm is executed along with the existing Greedy and Additional greedy approach based on the sample input fault matrix illustrated in Table 1.
Table 1. Sample input fault matrix
Test case (TCi)
Faults type (FTi) Total faults type
covered Faults type
FT1 FT2 FT3 FT4 FT5 FT6 FT7 FT8 FT9 FT10
TC1 0 1 0 1 0 0 1 0 1 0 4 2,4,7,9
TC2 1 0 1 0 0 0 0 0 0 0 2 1,3
TC3 1 0 0 0 1 0 1 1 0 0 4 1,5,7,8
TC4 0 1 0 1 0 0 0 0 1 0 3 2,4,9
TC5 0 0 1 0 0 1 0 0 0 1 3 3,6,10
TC6 1 0 0 0 0 0 1 0 0 0 2 1,7
TC7 0 0 1 0 0 1 0 1 0 0 3 3,6,8
TC8 0 1 0 0 0 0 0 0 0 1 2 2,10
3.4. Process of test case path selection
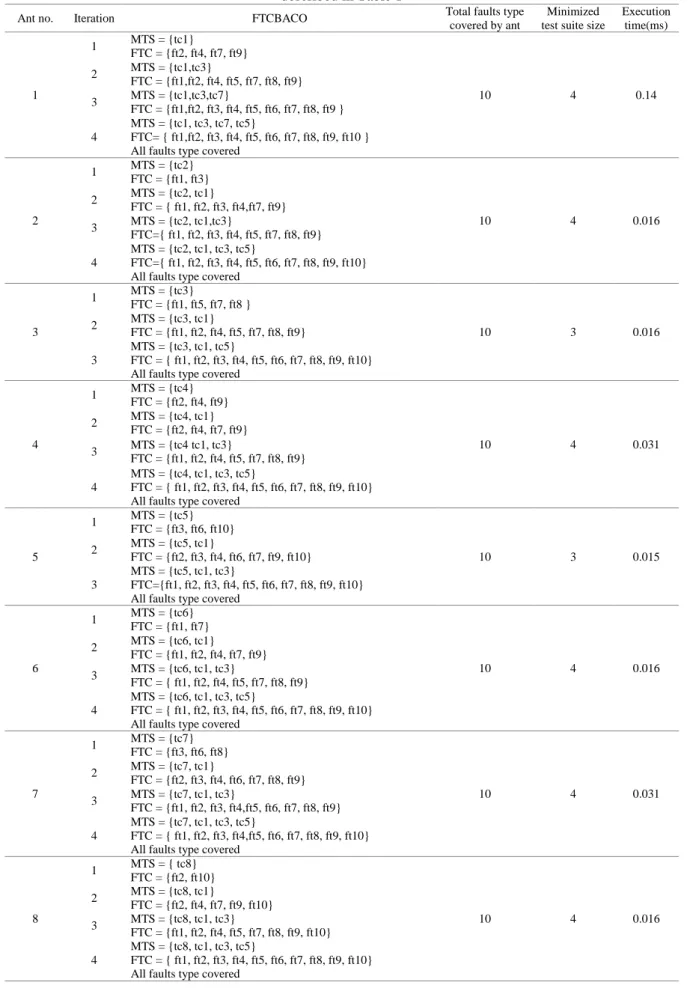
Table 2 represents initial pheromone distribution of each test case and its probability. Tables 3 to 10 proves step by step implementation of proposed FTCBACO algorithm with sample inputs, process of test case path selection of each ant and optimized test path of a test case in a test suite. Outcome shows the ability of FTCBACO algorithm technique. Amongst 8 input test cases, the recommended FTCBACO algorithm suggested only 3 test cases to attain the objective of a problem. Table 2 Shows Initial pheromone distribution and probability of sample input test suite. Table 3 shows outcomes of ant 1. In Table 3, the set MTS refers minimized test suite which holds resultant test case, FTC refers covered faults type which holds faults type covered by test case in MTS, TFC refers Total number of faults type covered by test case in MTS. Likewise all the ants processed.
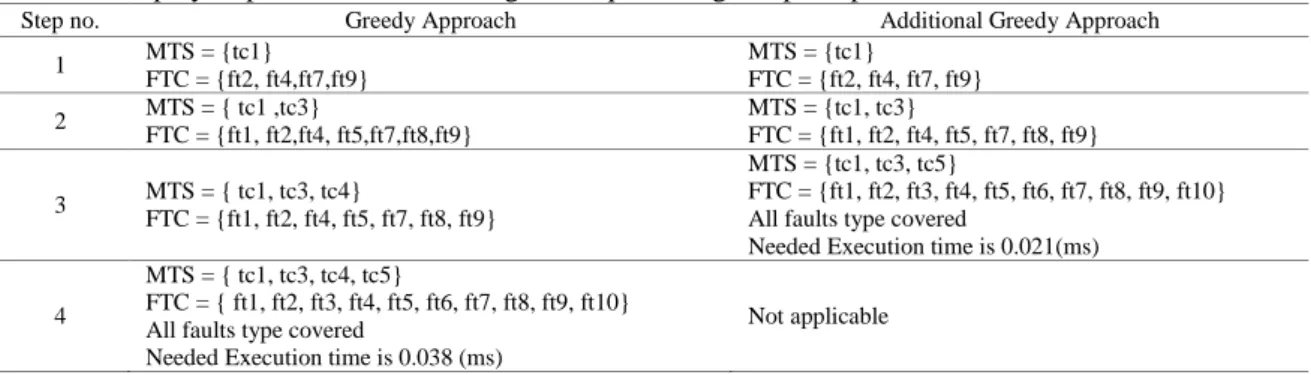
Step-by-step execution outcomes of each existing algorithm as presented in Table 4 and
also proposed FTCBACO technique as exhibited in Table 5. In both Tables 4 and 5, MTS denotes
minimized test suite which is generated by selection of best suitable test case for each algorithm
and FTC denotes the amount of faults type involved by nominated test cases in the minimized test
suite MTS.
Table 2. Initial pheromone distribution and probability of each test case
Testcase (TCi) Pheromone[i] ∑ pheromone[i]
n
i=1
probability[i] = pheromone[i] ∑n pheromone[i]
i=1
TC1 1 8 0.125
TC2 1 8 0.125
TC3 1 8 0.125
TC4 1 8 0.125
TC5 1 8 0.125
TC6 1 8 0.125
TC7 1 8 0.125
TC8 1 8 0.125
Table 3. Outcomes of ant 1 Ant 1
TCi Pheromone[i] EV = [coveredfaults[i]
total faults ] ∝
[pheromone[i]] β EV*[pheromone[i]] β Probability[i]
Iteration 1
Initially Set MTS ={1} FTC ={2,4,7,9} TFC= 4
TC1 1.0 0.16 1.0 0.16 0.3265(AV)
TC2 0.6 0.04 0.6 0.04 0.049
TC3 0.6 0.16 0.6 0.16 0.1959(*)
TC4 0.6 0.09 0.6 0.09 0.1102
TC5 0.6 0.09 0.6 0.09 0.1102
TC6 0.6 0.04 0.6 0.04 0.049
TC7 0.6 0.09 0.6 0.09 0.1102
TC8 0.6 0.04 0.6 0.04 0.049
TC1 already visited marked as AV. So select next higher probability marked as (*). MTS={1,3} FTC={1,2,4,5,7,8,9} TFC = 7
Iteration 2
TC1 0.6 0.16 0.6 0.096 0.1132(AV)
TC2 0.36 0.04 0.36 0.0144 0.017
TC3 0.76 0.16 0.76 0.1216 0.1434(AV)
TC4 0.36 0.09 0.36 0.0324 0.0382
TC5 0.36 0.09 0.36 0.0324 0.0382
TC6 0.36 0.04 0.36 0.0144 0.017
TC7 0.36 0.09 0.36 0.0324 0.0382(*)
TC8 0.36 0.04 0.36 0.0144 0.017
MTS ={1,3,7} FTC ={1,2,3,4,5,6,7,8,9} TFC = 9
Iteration 3
TC1 0.36 0.16 0.36 0.0576 0.0529(AV)
TC2 0.216 0.04 0.216 0.0086 0.0079
TC3 0.456 0.16 0.456 0.073 0.067(AV)
TC4 0.216 0.09 0.216 0.0194 0.0178
TC5 0.216 0.09 0.216 0.0194 0.0178(*)
TC6 0.216 0.04 0.216 0.0086 0.0079
TC7 0.516 0.09 0.516 0.0464 0.0426(AV)
TC8 0.216 0.04 0.216 0.0086 0.0079
MTS ={1,3,7,5} CFT={1,2,3,4,5,6,7,8,9,10} FTC = 10 Ant 1 reached 10 faults type. So Ant 1 complete its process.
Table 4. Step by step execution of existing techniques using sample input fault matrix described in Table 1
Step no. Greedy Approach Additional Greedy Approach
1 MTS = {tc1}
FTC = {ft2, ft4,ft7,ft9}
MTS = {tc1}
FTC = {ft2, ft4, ft7, ft9}
2 MTS = { tc1 ,tc3}
FTC = {ft1, ft2,ft4, ft5,ft7,ft8,ft9}
MTS = {tc1, tc3}
FTC = {ft1, ft2, ft4, ft5, ft7, ft8, ft9}
3 MTS = { tc1, tc3, tc4}
FTC = {ft1, ft2, ft4, ft5, ft7, ft8, ft9}
MTS = {tc1, tc3, tc5}
FTC = {ft1, ft2, ft3, ft4, ft5, ft6, ft7, ft8, ft9, ft10} All faults type covered
Needed Execution time is 0.021(ms) 4
MTS = { tc1, tc3, tc4, tc5}
FTC = { ft1, ft2, ft3, ft4, ft5, ft6, ft7, ft8, ft9, ft10} All faults type covered
Needed Execution time is 0.038 (ms)
Table 5. Step by step execution of proposed FTCBACO technique using sample input fault matrix described in Table 1
Ant no. Iteration FTCBACO Total faults type
covered by ant
Minimized test suite size
Execution time(ms)
1
1 MTS = {tc1}
FTC = {ft2, ft4, ft7, ft9}
10 4 0.14
2 MTS = {tc1,tc3}
FTC = {ft1,ft2, ft4, ft5, ft7, ft8, ft9} 3 MTS = {tc1,tc3,tc7} FTC = {ft1,ft2, ft3, ft4, ft5, ft6, ft7, ft8, ft9 } 4
MTS = {tc1, tc3, tc7, tc5}
FTC= { ft1,ft2, ft3, ft4, ft5, ft6, ft7, ft8, ft9, ft10 } All faults type covered
2
1 MTS = {tc2}
FTC = {ft1, ft3}
10 4 0.016
2 MTS = {tc2, tc1} FTC = { ft1, ft2, ft3, ft4,ft7, ft9} 3 MTS = {tc2, tc1,tc3} FTC={ ft1, ft2, ft3, ft4, ft5, ft7, ft8, ft9} 4
MTS = {tc2, tc1, tc3, tc5}
FTC={ ft1, ft2, ft3, ft4, ft5, ft6, ft7, ft8, ft9, ft10} All faults type covered
3
1 MTS = {tc3}
FTC = {ft1, ft5, ft7, ft8 }
10 3 0.016
2 MTS = {tc3, tc1}
FTC = {ft1, ft2, ft4, ft5, ft7, ft8, ft9} 3
MTS = {tc3, tc1, tc5}
FTC = { ft1, ft2, ft3, ft4, ft5, ft6, ft7, ft8, ft9, ft10} All faults type covered
4
1 MTS = {tc4}
FTC = {ft2, ft4, ft9}
10 4 0.031
2 MTS = {tc4, tc1}
FTC = {ft2, ft4, ft7, ft9}
3 MTS = {tc4 tc1, tc3}
FTC = {ft1, ft2, ft4, ft5, ft7, ft8, ft9} 4
MTS = {tc4, tc1, tc3, tc5}
FTC = { ft1, ft2, ft3, ft4, ft5, ft6, ft7, ft8, ft9, ft10} All faults type covered
5
1 MTS = {tc5}
FTC = {ft3, ft6, ft10}
10 3 0.015
2 MTS = {tc5, tc1}
FTC = {ft2, ft3, ft4, ft6, ft7, ft9, ft10} 3
MTS = {tc5, tc1, tc3}
FTC={ft1, ft2, ft3, ft4, ft5, ft6, ft7, ft8, ft9, ft10} All faults type covered
6
1 MTS = {tc6}
FTC = {ft1, ft7}
10 4 0.016
2 MTS = {tc6, tc1}
FTC = {ft1, ft2, ft4, ft7, ft9}
3 MTS = {tc6, tc1, tc3}
FTC = { ft1, ft2, ft4, ft5, ft7, ft8, ft9} 4
MTS = {tc6, tc1, tc3, tc5}
FTC = { ft1, ft2, ft3, ft4, ft5, ft6, ft7, ft8, ft9, ft10} All faults type covered
7
1 MTS = {tc7}
FTC = {ft3, ft6, ft8}
10 4 0.031
2 MTS = {tc7, tc1}
FTC = {ft2, ft3, ft4, ft6, ft7, ft8, ft9}
3 MTS = {tc7, tc1, tc3}
FTC = {ft1, ft2, ft3, ft4,ft5, ft6, ft7, ft8, ft9} 4
MTS = {tc7, tc1, tc3, tc5}
FTC = { ft1, ft2, ft3, ft4,ft5, ft6, ft7, ft8, ft9, ft10} All faults type covered
8
1 MTS = { tc8}
FTC = {ft2, ft10}
10 4 0.016
2 MTS = {tc8, tc1}
FTC = {ft2, ft4, ft7, ft9, ft10}
3 MTS = {tc8, tc1, tc3}
FTC = {ft1, ft2, ft4, ft5, ft7, ft8, ft9, ft10} 4
MTS = {tc8, tc1, tc3, tc5}
FTC = { ft1, ft2, ft3, ft4, ft5, ft6, ft7, ft8, ft9, ft10} All faults type covered
Table 4 shows that an existing Greedy approach needed 4 test cases and 0.038(ms) computational time to cover all faults type and Additional greedy approach offered 3 test cases and 0.021(ms) to report all faults type. But only 3 test cases and 0.015(ms) computational time are essential to cover all faults type through proposed FTCBACO as shown in Table 5 and therefore FTCBACO is better than both existing techniques. After the execution of both existing and proposed algorithms with test fault matrix, the function factors are acquired in terms of number of faults type covered, execution time, minimized test suite size as shown in Table 6. In both existing techniques, execution time considered as time taken for finding minimized test suite. But in Proposed algorithm, each ant obtained execution time for finding minimized test suite size. Among the execution time of all the ants, FTCBACO considered execution time for the best ant which has generated minimum test suite size with minimum execution time. And also Table 6 shows percentage of test suite reduction rate. Test suite reduction rate is computed using (4).
Test suite reduction rate(%) = Total test suite size−optimal test suite size
Total test suite size ∗ 100 (4) The results of Table 6 proved that proposed FTCBACO algorithm required minimum execution time to produce maximum test suite reduction rate. Hence we conclude that proposed FTCBACO algorithm outperforms both existing techniques in terms of execution time needed for finding reduced test suite and percentage of test suite reduction rate.
Table 6. Execution results of three approaches on fault matrix test
Algorithm Total faults
type assumed
Total fault types covered
Preferred test suite
size
Minimized Test suite
size
Minimized test suite
Test suite reduction rate (%)
Execution time (ms) Greedy
Approach 10 10 8 4 MTS = { tc1, tc3, tc4, tc5} 50 0.038
Additional
Greedy 10 10 8 3 MTS = {tc1, tc3, tc5} 62.5 0.021
FTCBACO 10 10 8 3 MTS = {tc5,tc1,tc3} 62.5 0.015
4. EVALUATION OF RESULTS AND DISCUSSION
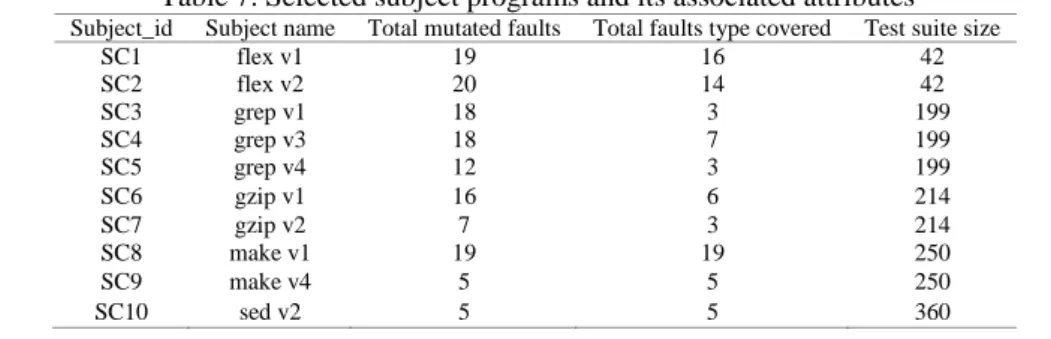
Numerous experiments have been conducted for determining the efficiency of the proposed FTCBACO algorithm. In order to analyze the performance of function factors, both proposed and existing algorithms have implemented in Java Language by means of similar experimental environment. Fault metrics of various 10 subject programs (benchmark dataset) have retrieved from Software-artifact Infrastructure Repository (SIR) as shown in Table 7 and used for conducting experiments. Table 7 shows subject name, total number of mutated faults presented, number of faults type covered and test suite size of each subjects. Also unique subject id have been assigned to each subject program version. In the experiment, we used 2 independent variables and 3 dependent variables. Selection of algorithms (Greedy, Additional greedy and FTCBACO) and 10 subject programs (flex v1, flex v2, grep v1, grep v3, grep v4, gzip v1, gpiz v2, make v1, make v4, sed v2) are considered as 2 independent variables. Various combination of independent variables have been used for conducting the computational model.Three dependent variables (faults type coverage, optimized test suite size and execution time) are identified from the mixture of every independent Fault type variable. Total number of test cases in the minimized test suite should be considered as optimum test suite size. Proposed FTCBACO algorithm and Existing techniques have designed based on stochastic nature. Hence, each selected algorithm have executed 10 times respectively for each subject program to gather the outcomes in the similar environment. Table 8 shows the mean values of function factors for every algorithm in regard to the subject programs as shown in Table 7.
Table 7. Selected subject programs and its associated attributes
Subject_id Subject name Total mutated faults Total faults type covered Test suite size
SC1 flex v1 19 16 42
SC2 flex v2 20 14 42
SC3 grep v1 18 3 199
SC4 grep v3 18 7 199
SC5 grep v4 12 3 199
SC6 gzip v1 16 6 214
SC7 gzip v2 7 3 214
SC8 make v1 19 19 250
SC9 make v4 5 5 250
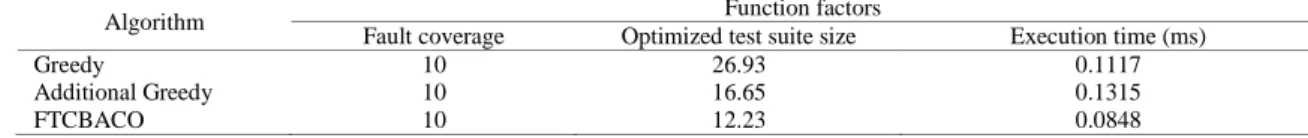
Table 8 Mean values of function factors
Algorithm Function factors
Fault coverage Optimized test suite size Execution time (ms)
Greedy 10 26.93 0.1117
Additional Greedy 10 16.65 0.1315
FTCBACO 10 12.23 0.0848
From the outcomes stated in Table 8, we state that the proposed FTCBACO algorithm required minimum mean value of execution time (0.0848 ms) and optimized test suite size (12.23). So, we conclude that performance of proposed FTCBACO is better than both existing techniques.
4.1. Statistical investigations
Statistical investigations have conducted to obtain an accurate conclusion regarding the efficiency of the proposed FTCBACO. Therefore 3 research questions and their related hypothesis have built and shown in Table 9. H0 denotes assumption of null hypothesis whereas Ha indicates assumption of alternative hypothesis.
Table 9. Assumption of hypothesis related with research problems
RQ1 H0: There is no significant variance among algorithms in the capability of fault type coverage
Ha : There is significant variance among algorithms in the capability of fault type coverage
RQ2 HH0: There is no significant variance among algorithms in order to find optimized test suite size
a : There is significant variance among algorithms in order to find optimized test suite size
RQ3 H0: There is no significant variance among algorithms in the execution time to find optimized test suite
Ha: There is significant variance among algorithms in the execution time to find optimized test suite
Solution to RQ1:
Table 10 presents the mean values of faults type coverage for every algorithm with respect to subject programs. An outcome shows that each algorithm has presented uniform result on fault type coverage relating to subject programs. From the data shown in Table 10, we can state that all selected algorithm is able to achieve 100% faults type coverage. So, each algorithm has equal mean value of faults type coverage in regard to subject programs. Therefore, we agreed H0 and finally come to the statement that there is no significant variance in the fault type coverage capability of each algorithm.
Table 10. Mean values of fault type coverage
Algorithm Subject code
SC1 SC2 SC3 SC4 SC5 SC6 SC7 SC8 SC9 SC10
Greedy 16 14 3 7 3 6 3 19 5 5
Additional Greedy 16 14 3 7 3 6 3 19 5 5
FTCBACO 16 14 3 7 3 6 3 19 5 5
Solution to RQ2:
Proposed FTCBACO algorithm and Existing techniques have designed based on stochastic nature. Hence, each algorithm executed 10 times (total run =10) respectively for each subject program and collected the optimized test suite size of each run for every algorithm. Mean value of optimized test suite size for every algorithm is calculated in regard to subjects programs and are shown in Table 11. From the results illustrated in Table 11, we proved that proposed FTCBACO algorithm required minimum mean value of test suite size to cover all the faults type compared with other algorithms techniques. And from the results reported in Table 12, we concluded that proposed FTCBACO algorithm provided maximum test suite reduction rate compared to other techniques. It is evident from the results of Table 11 and 12 we identified that there is a significant variance among the algorithms in terms of optimized test suite size.
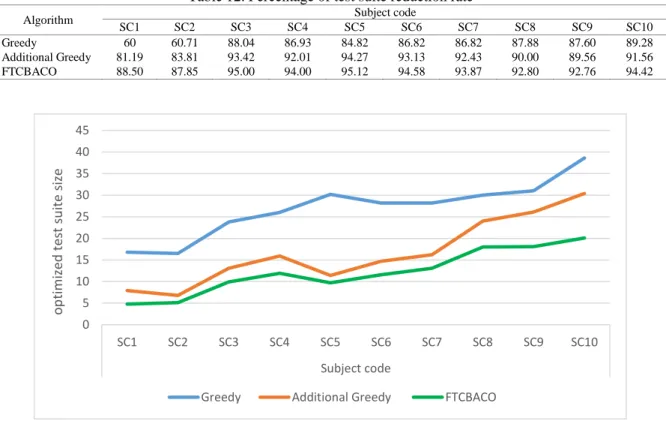
Figure 2 shows the performance analysis of mean values of optimum test suite size against various subject programs using three methods specifically existing Greedy approach, Additional Greedy approach and proposed FTCBACO Technique. As in Figure 2, the proposed FTCBACO Technique offers minimum mean value of optimum test suite size for software testing as compared to an existing Greedy and Additional Greedy approaches. So, the test suite reduction rate using proposed FTCBACO Technique is also higher.
Therefore, we discard null hypothesis H0 and agree Ha that there is a significant variance among the algorithms to find the optimum test suite size.
Table 11. Mean values of optimized test suite size
Algorithm Subject code
SC1 SC2 SC3 SC4 SC5 SC6 SC7 SC8 SC9 SC10
Greedy 16.8 16.5 23.8 26 30.2 28.2 28.2 30.0 31.0 38.6
Additional Greedy 7.9 6.8 13.1 15.9 11.4 14.7 16.2 24 26.1 30.4
FTCBACO 4.8 5.1 9.9 11.9 9.7 11.6 13.1 18 18.1 20.1
Table 12. Percentage of test suite reduction rate
Algorithm Subject code
SC1 SC2 SC3 SC4 SC5 SC6 SC7 SC8 SC9 SC10
Greedy 60 60.71 88.04 86.93 84.82 86.82 86.82 87.88 87.60 89.28
Additional Greedy 81.19 83.81 93.42 92.01 94.27 93.13 92.43 90.00 89.56 91.56
FTCBACO 88.50 87.85 95.00 94.00 95.12 94.58 93.87 92.80 92.76 94.42
Figure 2 . Efficiency of mean values of optimum test Suite size against subject programs
Solution to RQ3:
Each algorithm executed 10 times (total run =10) respectively for each subject program and collected the execution time of each run for every algorithm. Mean value of execution time for every algorithm is calculated in regard to subjects programs. Table 13 shows the mean values of execution time for every algorithm. From the results shown in Table 13, we proved that proposed FTCBACO algorithm required minimum mean value of execution time to find optimized test suite size for covering all the faults type compared with other algorithms techniques. It is evident from the results of Table 13 we identified that there is a significant variance among the algorithms in terms of execution time to find optimized test suite.
Figure 3 shows the performance analysis of mean values of execution time against various subject programs using three methods specifically existing Greedy approach, Additional Greedy approach and proposed FTCBACO Technique. As shown in Figure 3, the proposed FTCBACO Technique offers minimum mean value of execution time as compared to an existing Greedy and Additional Greedy approaches. Hence, we discard null hypothesis H0 and agree Ha that there is a significant variance among the algorithms in terms of execution time to find the optimum test suite.
0 5 10 15 20 25 30 35 40 45
SC1 SC2 SC3 SC4 SC5 SC6 SC7 SC8 SC9 SC10
Subject code
o
p
timi
zed
t
es
t
su
ite
size
Table 13. Mean values of execution time
Algorithm Subject code
SC1 SC2 SC3 SC4 SC5 SC6 SC7 SC8 SC9 SC10
Greedy 0.086 0.081 0.093 0.089 0.096 0.114 0.101 0.116 0.109 0.232
Additional Greedy 0.078 0.077 0.086 0.091 0.099 0.134 0.178 0.107 0.201 0.264
FTCBACO 0.037 0.042 0.057 0.073 0.068 0.098 0.099 0.095 0.100 0.179
Figure 3. Efficiency of mean values of execution time against subject programs
5. CONCLUSION
Ant Colony Optimization algorithm is an extraordinary technique to find the best test cases in a test suite. In this investigation work, proposed FTCBACO algorithm is designed, implemented using JAVA language in an efficient manner and also the results of proposed algorithm is compared with an existing Greedy approach and Additional Greedy approach. In existing technique, additional execution time needed to optimize the test suite and also it produced least test suite reduction rate. But, Proposed FTCBACO Algorithm optimizes the test suite highly. From the comparative result analysis of existing and proposed techniques, we stated that there is no difference among algorithms under study with respect to fault type coverage capability. But proposed algorithm required minimum execution time to produce maximum test suite reduction rate. In future, my research work would consider this kind of experimentations with complicated programs on huger test suite sizes and complex fault intensities.
REFERENCES
[1] A. C. Kumari, K. Srinivas and M. P. Gupta, "Multi-objective test suite minimisation using Quantum-inspired Multi-objective Differential Evolution Algorithm," 2012 IEEE International Conference on Computational Intelligence and Computing Research, Coimbatore, 2012, pp. 1-7, doi: 10.1109/ICCIC.2012.6510272.
[2] Yoo S, Harman M, “Using hybrid algorithm for pareto efficient multi-objective test suite minimization”, Journal of Systems and Software, Vol.83, No.4, pp.689-701, 2010.
[3] Li, Zheng, Mark Harman and Robert Mark Hierons,” Search Algorithms for Regression Test Case Prioritization”, IEEE Transactions on Software Engineering, Vol.33, No.4, pp. 225-237, 2007.
[4] W. E. Wong, J. R. Horgan, S. London and H. Agrawal, "A study of effective regression testing in practice," Proceeding The Eighth International Symposium on Software Reliability Engineering, USA, 1997, pp.264-274. [5] T.Y. Chen, M.F. Lau, “A new heuristic for test suite reduction”, Information and Software Technology, Vol.40,
No.5-6, 1998, pp: 347-354.
[6] Khalilian A., Parsa S., “Bi-criteria Test Suite Reduction by Cluster Analysis of Execution Profiles”, In: Szmuc T., Szpyrka M., Zendulka J. (eds) Advances in Software Engineering Techniques. CEE-SET 2009. Lecture Notes in Computer Science, Vol 7054, pp. 243-256, 2012.
[7] Sriraman Tallam, Neelam Gupta, “A Concept Analysis Inspired Greedy Algorithm for Test Suite minimization”, ACM SIGSOFT Software Engineering Notes, Vol.31, No.1, pp. 35-42, 2006.
[8] Yoo S, Harman M, “Using hybrid algorithm for pareto efficient multi-objective test suite minimization”, Journal of Systems and Software, Vol.83, No.4, pp.689-701, 2010.
0 0,05 0,1 0,15 0,2 0,25 0,3
SC1 SC2 SC3 SC4 SC5 SC6 SC7 SC8 SC9 SC10
Subject code
m
e
an
val
ue
s
of
ex
e
cut
ion
ti
m
e
[9] Zhenyu Chen, Xiaofang Zhang, Baowen Xu, “A degraded ILP approach for test suite reduction”, Proceedings of the Twentieth International Conference on Software Engineering & Knowledge Engineering (SEKE'2008), San Francisco, CA, USA, July 1-3,pp. 494-499, 2008.
[10] P. Harris and N. Raju, “A greedy approach for coverage-based Test Suite reduction”, The International Arab Journal of Information Technology, Vol. 12, No.1, pp. 17-23.
[11] T.Y. Chen, M.F. Lau, “On the divide-and-conquer approach towards test suite reduction”, Information Sciences— Informatics and Computer Science, Intelligent Systems, Applications: An International Journal, Vol. 152, No.1, pp. 89-119, 2003.
[12] B.Galeebathullah, C.P.Indumath, “A Novel Approach for Controlling a Size of a Test Suite with Simple Technique, International Journal on Computer Science and Engineering, Vol. 02, No. 03, pp. 614-618, 2010.
[13] L. You and Y. Lu, “A genetic algorithm for the time-aware regression testing reduction problem," 2012 8th International Conference on Natural Computation, Chongqing, pp. 596-599, 2012.
[14] Chen J, Zhu L, Chen TY et al , “Test case prioritization for object-oriented software: an adaptive random sequence approach based on clustering”, Journal of Systems and Software, Vol.135, pp:107-125, 2018.
[15] S. Khan, A. Nadeem and A. Awais, “TestFilter: A Statement-Coverage Based Test Case Reduction Technique,” 2006 IEEE International Multitopic Conference, Islamabad, pp. 275-280, 2006.
[16] L. Zhao and W. Luo, "An Algorithm for Reducing Test Suite Based on Interface Parameters," 2010 International Conference on Computational Intelligence and Software Engineering, Wuhan, pp. 1-4, 2010.
[17] W. Miller and D. L. Spooner, "Automatic Generation of Floating-Point Test Data," in IEEE Transactions on Software Engineering, Vol. SE-2, No. 3, 1976, pp. 223-226, doi: 10.1109/TSE.1976.233818.
[18] Harrold MJ, Gupta R, Soffa ML,”A methodology for controlling the size of a test suite”, ACM Transactions on Software Engineering and Methodology (TOSEM), Vol.2, No.3, pp. 270-285, 1993.
[19] Rothermel G, Harrold MJ,” A safe, efficient regression test selection technique”, ACM Transactions on Software Engineering and Methodology (TOSEM), Vol.6, No.2, pp.173-210, 1997.
[20] S. Xu, H. Miao and H. Gao, "Test Suite Reduction Using Weighted Set Covering Techniques," 2012 13th ACIS International Conference on Software Engineering, Artificial Intelligence, Networking and Parallel/Distributed Computing, Kyoto, pp. 307-312, 2012, doi: 10.1109/SNPD.2012.87.
[21] M. J. Harrold and M. L. Souffa, “An incremental approach to unit testing during maintenance,” Proceedings. Conference on Software Maintenance.Scottsdale, AZ, USA, pp. 362-367,1988.
[22] Jun-Wei Lin, Chin-Yu Huang, “Analysis of test suite reduction with enhanced tie-breaking techniques”, Information and Software Technology, Vol.51, No.4, pp.679-690, 2009.
[23] D. Jeffrey and Neelam Gupta, "Test suite reduction with selective redundancy," 21st IEEE International Conference on Software Maintenance (ICSM'05), Budapest, Hungary, 2005, pp. 549-558.
[24] BoussaïD, I., Lepagnot, J., & Siarry, P., “A survey on optimization metaheuristics”, Information sciences, Vol. 237, pp. 82-117, 2013.
[25] T. Dokeroglu, E. Sevinc, T. Kucukyilmaz, and A. Cosar, “A survey on new generation metaheuristic algorithms,” Computers & Industrial Engineering, Vol. 137, p. 106040, 2019.
[26] Ilango, S.S., Vimal, S., Kaliappan, M. et al., “Optimization using Artificial Bee Colony based clustering approach for big data”, Cluster Computing, pp. 1-9, 2018.
[27] S Vimal, M Khari, RG Crespo, L.Kalaivani, Nilanjan Dey ,M. Kaliappan, “Energy enhancement using Multiobjective Ant colony optimization with Double Q learning algorithm for IoT based cognitive radio networks”, Computer Communications, Vol 154, No.15, pp. 481-490, 2020.