Sharif University of Technology
Scientia IranicaTransactions A: Civil Engineering www.scientiairanica.com
The eect of fuzzy controller on damage of steel
structure considering structural uncertainties
A. Baghban, A. Karamodin
and H. Haji Kazemi
Department of Civil Engineering, Ferdowsi University of Mashhad, P.O. Box 9177948944-1111, Iran. Received 6 April 2014; received in revised form 14 August 2015; accepted 6 October 2015
KEYWORDS Fragility curves; Fuzzy Logic Controller (FLC);
Active controller; Semi active controller; Structural
uncertainty.
Abstract. In this study, the eect of active and semi-active Fuzzy Logic Controllers (FLC) on the damage imposed on steel structures, considering structural uncertainties, are investigated. Two FLCs are designed for controlling the actuators and controllable viscous dampers as active and semi-active devices, respectively. Fragility curves are used to show the probability of damage imposed on uncontrolled and controlled structures. They are developed in consideration with three performance levels specied in FEMA 356, including Immediate Occupancy (IO), Life Safety (LS), and Collapse Prevention (CP). Considering deterministic and probabilistic parameters for the structure, fragility curves are generated separately to investigate the eect of structural uncertainties on the damage. To simulate the structure including the probabilistic parameters, Latin hypercube sampling is employed. Eectiveness of the controllers is illustrated and veried using the simulated response of a 3-story nonlinear benchmark building excited by several ground motions. To compare the performance of fuzzy controllers, fragility curves are also generated for the structure controlled by LQG and clipped-optimal controllers. Results show that FLCs can reduce the probability of damage signicantly. Moreover, it is observed that the uncertainty in mass and yield strength has the greatest eect on the maximum drift of structure.
© 2016 Sharif University of Technology. All rights reserved.
1. Introduction
In a structural engineering design, mitigation of struc-tural damage and human loss is of a major consider-ation. Structural control has shown its eectiveness in attaining this purpose by dierent control strategies such as passive, active, and semi-active strategies. The passive control system is a system that does not require any external power source, and control forces are developed in response to the motion of the structure. Since control forces depend on the response of the
*. Corresponding author. Tel: +98 5138806053; Fax: +98 38807184
E-mail addresses: [email protected] (A. Baghban); [email protected] (A. Karamodin); [email protected] (H. Haji Kazemi)
structure, suitable control forces might not be produced under excitations. The active control system involves sensors to measure building responses and actuators to apply control forces to the building in a prescribed manner. In this system, since the external source supplies the control forces, improper performance of the controller can increase structural energy. The semi-active control system is a system that needs small external power source to alter control device properties. This method combines the reliability associated with passive control and the adaptability associated with active control systems.
Generally, there are dierent uncertainties when designing a structure. Construction errors, variability of the material properties, assumed loading distribu-tion, and uncertainties related to the control system are examples of these uncertainties. One challenge
In recent years, there has been a growing eort toward utilization of FLC [1-3]. The main advantages of this controller are as follows: (1) It is able to handle the non-linear behavior of the structures; (2) It is able to tolerate the uncertainties; (3) It is one of the few mathematical model-free approaches for structural control; and (4) It can be adapted by modifying its rules or membership functions.
One method in the estimation of seismic damage of structures is the so-called fragility curves. Fragility curves show the probability of structural damages as a function of ground motion indices, such as Peak Ground Acceleration (PGA), Spectral accelera-tion (Sa), Spectral displacement (Sd), and so forth. Dierent methods have been used to develop fragility curves. Based on the sources of the data, these methods may be sub-divided into four categories as Empiri-cal, Judgmental, AnalytiEmpiri-cal, and Hybrid vulnerability methods [4]. In the absence of adequate empirical data, analytical methods have usually been used to develop fragility curves. In these methods, the structural demands and/or capacities used to evaluate the failure probability are estimated through such methods as elastic spectral, nonlinear static, and nonlinear time history analyses [5].
Fragility curves have been developed for dierent controlled structures. Guneyisi and Altay [6] used uid viscous dampers to retrot a high-rise reinforced concrete building. They found that the dampers can be very eective in reducing seismic structural response. Taylor [7] developed fragility curves for passive and active controlled structures. He used uid viscous dampers as passive and actuators as active devices. H2/LQG control law was employed to design the active control system. He observed that both passive and active systems can reduce the probability of damage compared to the uncontrolled structure. Wong and Harris [8] used a tuned mass damper to improve fragility curves for a six-story steel frame. They observed that the tuned mass damper can be eective at low levels of earthquake shaking, while being less eective during moderate to strong earthquakes. Perotti et al. [9] generated fragility curves for a base-isolated Nuclear Power Plants building. Siqueira et al. [10] developed fragility curves for bridges retrotted with seismic-isolator devices. They found that the seismic isolation is eective signicantly in reducing the probability of damage to columns and foundations. Aguirre and Almazan [11] used energy dissipation devices as seismic protection systems in order to enhance structural performance. Structural
on a steel structure is investigated. Actuators and controllable viscous dampers are used as active and semi-active devices, respectively. A Genetic Algorithm (GA) is employed to nd the optimum fuzzy controller rules, as well as adjusting the membership functions to minimize the damage of structure. Here, fragility curves are developed to show the probability of damage of structure. The representative structure employed in this study is the SAC 3-story nonlinear benchmark building designed for Los Angeles, California area. To investigate the robustness of the fuzzy controllers to uncertainties, structural uncertainties are considered using Latin hypercube sampling. Since there are a variety of uncertainties in the structural properties, to determine the variables that have the most ef-fect, a sensitivity analysis is used through the First-Order Second Moment (FOSM) method. To evalu-ate the eect of fuzzy controller on fragility curves, results are compared to LQG and clipped-optimal controllers.
2. Structural description
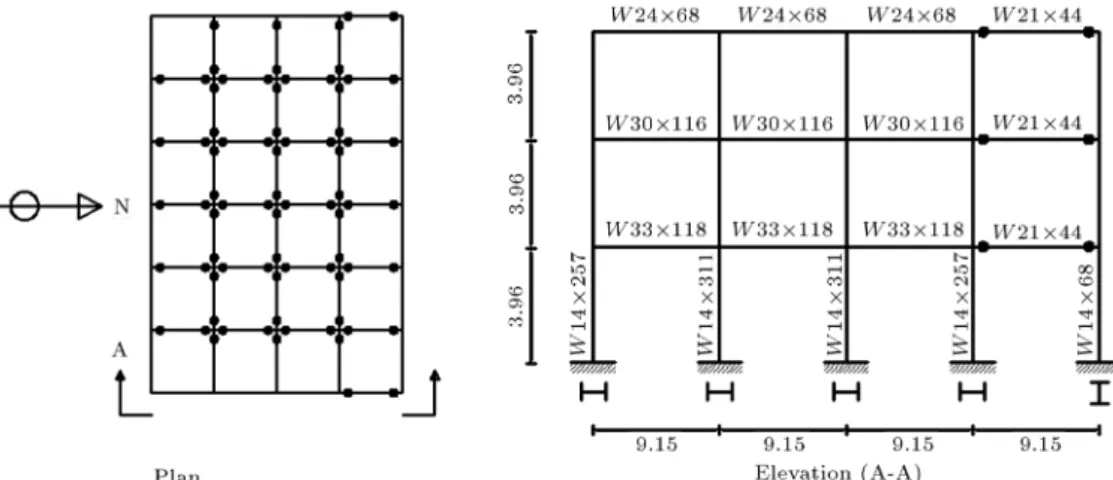
The 3-story nonlinear benchmark building used for this study was dened by Ohtori et al. [12], as shown in Figure 1. The structure is 36.58 m by 54.87 m in plan and 11.89 m in elevation. The bays are 9.15 m on center in both directions with four bays in the North-South (N-S) direction and six bays in the East-West (E-W). The building's lateral load-resisting system is comprised of steel perimeter Moment-Resisting Frames (MRFs) with simple framing between the two furthest south E-W frames. The interior bays of the structure contain simple framing with composite oors. The oor system is assumed to be rigid in the horizontal plane. Since the building is quite regular in plan and elevation, only half of the building is considered for further analysis. The MRF to be analyzed is one of the two in the North-South direction and was assigned half the seismic mass of the whole structure. The rst, second, and third periods of the frame are 1.01, 0.33, and 0.17 s, respectively.
During large seismic events, structural members can yield, resulting in nonlinear response behavior that may be signicantly dierent from a linear approxima-tion. To represent the nonlinear behavior, a bilinear hysteresis model is used to model the plastic hinges. These plastic hinges, which are assumed to occur at the end of moment-resisting beams and columns, introduce a material nonlinear behavior of the structures. For more details, please refer to Ohtori et al. [12].
Figure 1. Plan and elevation of 3-story nonlinear benchmark building.
3. Ground motion records
In fragility analysis, selecting a representative set of earthquakes with variable seismic input is an important step. Somerville et al. [13] generated three sets of 20 ground motions for the SAC project to represent the ground motions having probabilities to exceed 50% in 50 years (corresponding to a return period of 72 years), 10% in 50 years (corresponding to a return period of 474 years), and 2% in 50 years (corresponding to a return period of 2475 years) in Los Angeles region. These sets of ground motions are referred to as the 50 in 50 Set, 10 in 50 Set, and 2 in 50 Set, respectively. The acceleration histories have been scaled so as to conform roughly to the 1997 NEHRP design spectrum for rm soil for the specied return periods. The time histories for both the 50 in 50 Set and the 10 in 50 Set are all derived from the actual recordings of crustal-earthquakes on sti soils. For the 2 in 50 Set, ve of the time histories are from recorded near-fault events, and the other ve were synthetically generated. The synthetic time histories were generated using dierent methods for short-period and long-period portions of the spectral acceleration curve. The results from these two methods were then merged near a period of 1 sec (the rst mode of the structure) [14]. Since Bazzuro and Cornell [15] suggested that ve to seven input motions are sucient for representing the hazard, in this study, only two sets of ground motions (2 in 50 set and 10 in 50 set), including 40 earthquakes, are used as a seismic input.
4. Parameters for fragility estimation
Seismic fragility denes the probability of exceeding some limit state over a range of seismic inputs, as shown in the following equation:
Fragility = P [D CjS] ; (1) where D is seismic demand, C is capacity limits, and S
is seismic intensity. Therefore, estimates of the seismic demand and capacity limits are required for fragility analysis.
4.1. Demand model
For a realistic model of a system, the nonlinear behav-ior must be considered in fragility analysis. To nd the relationship between seismic demand and earthquake intensity, usually a power-law function is assumed (e.g., [5,7]):
D = aSb; (2)
where a and b are unknown regression coecients determined by a logarithmic transformation of Eq. (2) to a linear form:
ln(D) = ln(a) + b ln(S): (3) Using a nonlinear time history analysis and a linear regression through Eq. (3), a and b can be determined. 4.2. Limit state capacities
Denition of limit states has a direct eect on the fragility curves [16]. These values are usually dened based on the experimental data, expert judgment, analytical methods, or combinations thereof. In FEMA 356 [17], three limit states are dened based on inter-story drift. They are Immediate Occupancy (IO), Life Safety (LS), and Collapse Prevention (CP). Structures at IO should have only minor damage, and the build-ing should be safe to occupy after the earthquake. Structures at LS may sustain signicant damage, but still provide an appreciable margin against collapse. Finally, the structures at CP are expected to support gravity loads, but with a little margin against collapse. FEMA species 0.7%, 2.5%, and 5% for the maximum inter-story drift ratio of steel moment frames associated with IO, LS, and CP limit states, respectively. Several researches have adopted these limits for generating fragility curves (e.g., [7,18]).
5. Fragility analysis
When the limit state capacity is assumed to be a deterministic response, the fragility can be calculated as [7]:
P (D djS = s) = 1
ln d
DjS
DjS
; (4)
where () is the standard normal cumulative distri-bution function, d is the limit state capacity, and and are the parameters of the lognormal distribution determined through Eq. (2).
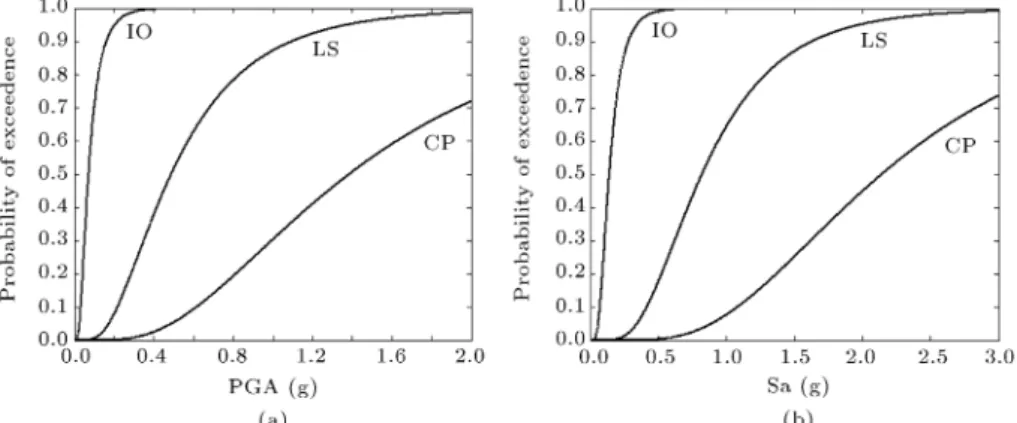
Figure 2 shows the fragility curves for the repre-sentative structure under two sets of ground motions considering FEMA limits.
6. Probabilistic modeling
Obviously, dierent uncertainties in fragility analysis can aect the results. In this paper, the eects of structural uncertainties on the fragility curves of controlled and uncontrolled structures are considered. 6.1. Random and deterministic variables There are many parameters that can be treated as random variables. Table 1 shows the statistical data for some selected variables. To realize the parameters
there is the disadvantage of using very large samples to achieve the required accuracy. Therefore, here, FOSM method is selected to verify the eect of uncertainty in dierent variables on the response of structure. In this method, we can obtain mean and standard deviation of structural response by assuming the means and standard deviations of the random variables. Assume that the random variable X has mean x and variance
2
x. Estimating the mean and variance of function Y =
g(x) by Eqs. (5) and (6) is called FOSM method [19]:
y g(x); (5)
2
Y
dg dx
2 0
2
x: (6)
In Eq. (6), 2
Y represents the sensitivity of function
Y to random variable X and ()0 denotes a function
evaluated at x0. To calculate
dg dx
0for x0= x, nite
dierence method can be used as below: dg
dx =
g(x+ x) g(x x)
2x : (7)
In the current study, sensitivity of the maximum drift of structure to the random variables is investigated.
Figure 2. Fragility curves for uncontrolled structure. Table 1. Statistical data for structural variables.
Variables Mean Cov (%) Probability
distribution
Beam yield strength 339 MPa 10 Lognormal
Column yield strength 397 MPa 10 Lognormal
Seismic mass m1= m2= 4:78e5; m3= 5:2e5 kg 10 Normal
Damping coecient 2% 40 Lognormal
Table 2. Standard deviation of maximum drift of stories. Random
variables
Standard deviation (Y) Beam & column yield strength 0.0016
Seismic mass 0.0028
Damping coecient 0.0013
Elastic modulus 0.0007
Drift response is selected because, in fragility analysis, the maximum drift of structure is used as a damage criterion. The variances of the maximum drift of structure due to the uncertainty in variables in Table 1 are shown in Table 2. These values are the average variances of the maximum drift for 40 ground acceler-ation. As seen in this table, uncertainty in mass and yield strength has the greatest eect on the maximum drift of structure. Therefore, only these variables are assumed to be random variables, and the others are assumed to be deterministic variables for simplicity. 6.2. Treatment of uncertainty in structural
properties
Dierent techniques may be used for the reliability analysis. Simulation techniques, as one possible way, have the advantage of being relatively straightforward. The basic idea behind simulation is to numerically sim-ulate some phenomena, and then observe the number of times some events of interest occur [20]. Several simulation methods were proposed in the literature to generate values as the random variables, e.g. Monte Carlo, Latin Hypercube Sampling (LHS), and Rosen-blueth's 2k+1 point. Among these simulation methods, Monte Carlo simulation is the most widely used [16]. Although Monte Carlo simulation is a very powerful technique, it requires the problem to be analyzed a hundred or a thousand times. This disadvantage be-comes particularly important in nonlinear time history analysis in which the time needed to analyze a single trail may be very long.
The Latin hypercube sampling is one technique for reducing the number of simulations needed to obtain reasonable results [20]. In this method, the range of possible values of each random input variable is divided into n non-overlapping intervals on the basis of equal probability. A value from each interval is randomly selected as a representative value. The representative values for each random variable are then combined, so that each representative value is considered once in the simulation process. In this way, all possible values of the random variables are represented in the simulation.
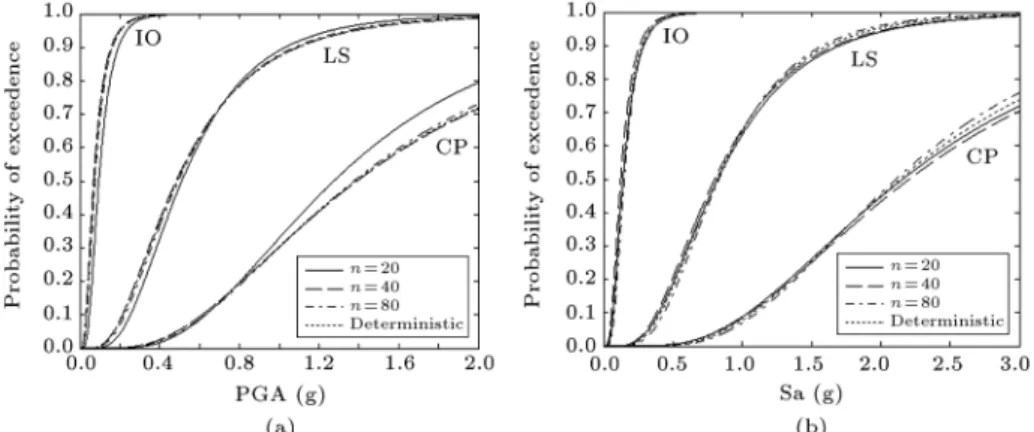
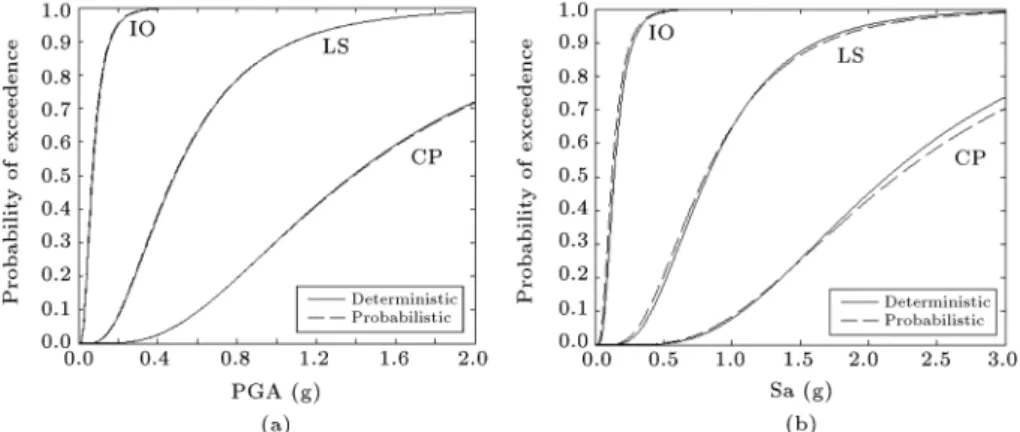
To divide the random variables, yield strength and seismic mass, into n intervals, the value of n should be determined. Considering a big value for n can lead to a more accurate result, but needs more analysis. Here, n is selected 20, 40, and 80, and then 20, 40, and 80 structures having dierent materials are generated, respectively. Using earthquakes explained in Section 3, fragility curves for these structures are obtained. Figure 3 shows that there is no signicant dierence between dierent ns, especially for small PGA and Sa. Therefore, in this research, 40 intervals are admitted for generating fragility curves in prob-abilistic analysis. Fragility curves for deterministic structure are also plotted in Figure 3 for comparison. Results indicate that considering uncertainty in struc-tural properties for uncontrolled structure does not have a meaningful eect on fragility curves, particularly for small intensity. This is similar to the result obtained for the reinforced concrete structure studied by Kwon and Elnashai [4].
7. Control of structure
To control the representative structure, FLC should be designed. For designing an FLC, two main parts must be determined: (1) structure (input and output variables, the number and type of Membership Func-tions (MFs), the type of inference mechanism,
opera-Figure 3. Comparing fragility curves for uncontrolled structure using deterministic and probabilistic parameters (n = 20, 40, and 80).
an optimal system. Often, a system is modied iteratively, while being tried to obtain optimality.
Here, the active and semi-active controllers are designed using two input variables including velocity and acceleration of each story of the building and one output variable. In the active system, output is the control force of each actuator; in semi-active system, output is the damping coecient of each controllable viscous damper. The fuzzy variables used to dene the fuzzy space are described in Table 3. The membership functions chosen for input and output variables are triangular shaped for their simplicity. Numerical inputs are normalized in the range [-1,1] for fuzzication. The point-valued MAX-MIN fuzzy inference method is chosen to combine the fuzzy IF-THEN rules in the fuzzy rule base with a mapping,
Table 3. Fuzzy variables. Variable Denition
PL Positive and Large PM Positive and Medium
PS Positive and Small
ZO Zero
NS Negative and Small NL Negative and Large
NL ZO PS PS NONE NL
NS ZO NS NS NS NL
ZO NL PS ZO NL NS
PS NL ZO ZO ZO NONE
PL NONE NS NS NL ZO
from a fuzzy input set to a fuzzy output set. Fuzzy linguistic output inferred by fuzzy rules is converted into its corresponding crisp value in the range [-1,1] for active and [0,1] for semi-active systems by the means of centroid method.
To nd the optimum fuzzy control rules and adjust the membership functions to minimize the maximum value of the story drift, a GA is employed. Figure 4 shows the optimum inputs and outputs; Table 4 shows the optimum fuzzy rules found by the selected GA for active system.
Fragility curves for uncontrolled, active fuzzy logic controlled, and active LQG controlled structures, considering deterministic parameters, are shown in Figure 5. As it is obvious, both controllers can reduce the probability of damage signicantly. Moreover, results show that FLC improve fragility curves better than LQG controller, especially when PGA is used as a seismic intensity.
Fragility curves for structures without controller
Figure 4. Membership functions for inputs and outputs (active system).
Figure 6. Comparing fragility curves for uncontrolled structure using deterministic and probabilistic parameters.
Figure 7. Comparing fragility curves for active fuzzy controlled structure using deterministic and probabilistic parameters.
Figure 8. Comparing fragility curves for active LQG controlled structure using deterministic and probabilistic parameters.
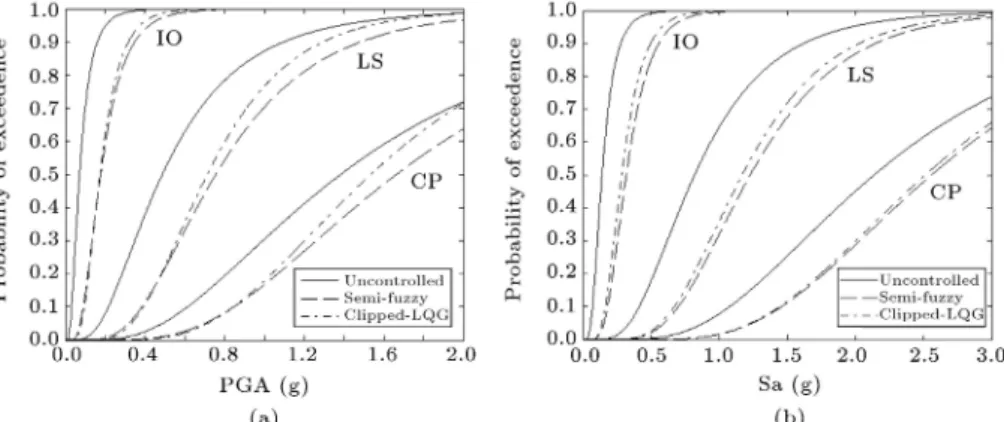
and with active fuzzy and LQG controllers, considering deterministic and probabilistic parameters, are given in Figures 6-8. These gures show that considering uncertainties in active controlled structures almost has no eect on fragility curves. This is similar to the result obtained for the uncontrolled structure. Figure 9 shows fragility curves for controlled struc-ture controlled by semi-active FLC and uncontrolled structure considering deterministic parameters. These curves show that semi-active fuzzy logic controller can signicantly reduce the probability of damage. In addition, fragility curves for controlled structure, using
semi-active clipped optimal controller with a LQG optimal controller, are also plotted in this gure to evaluate the performance of FLC. The result shows that FLC improves fragility curves better than LQG controller, especially when PGA is selected as a seismic intensity.
Fragility curves for structures with semi-active fuzzy and clipped-optimal controllers, considering de-terministic and probabilistic parameters, are shown in Figures 10 and 11. The comparison of these gures with Figures 6-8 indicates that the semi-active clipped-optimal controlled structure, similar to uncontrolled
Figure 9. Comparing fragility curves for dierent semi-active controllers.
Figure 10. Comparing fragility curves for semi-active fuzzy controlled structure using deterministic and probabilistic parameters.
Figure 11. Comparing fragility curves for semi-active clipped-optimal controlled structure using deterministic and probabilistic parameters.
and active controlled structure, is not sensitive to struc-tural uncertainties. But, semi-active fuzzy controlled structure to some extent is sensitive, especially to large seismic intensities. This can be due to the fact that in semi-active fuzzy controller, damping coecient is de-termined through the controller; but in others, control force is determined through the controllers. Obviously, control force and damping coecient can have dierent levels of sensitivity to structural uncertainties. So, the performance of semi-active FLC can be dierent compared to the performance of the others.
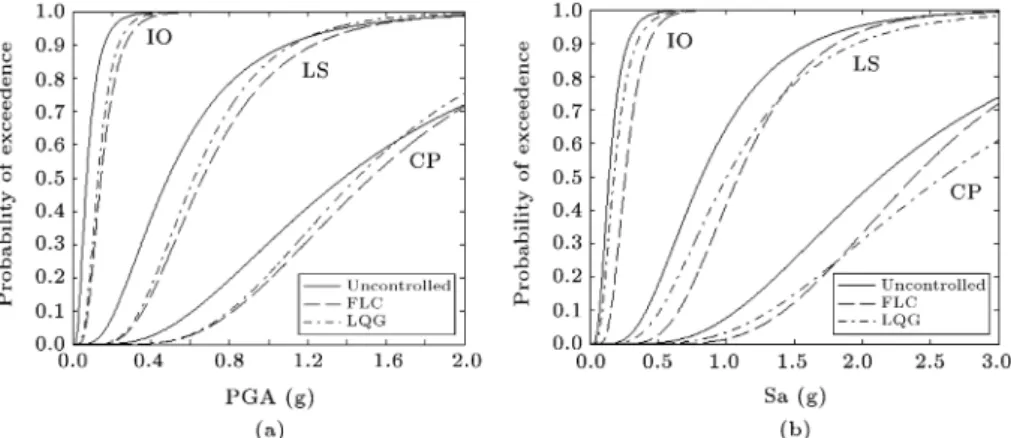
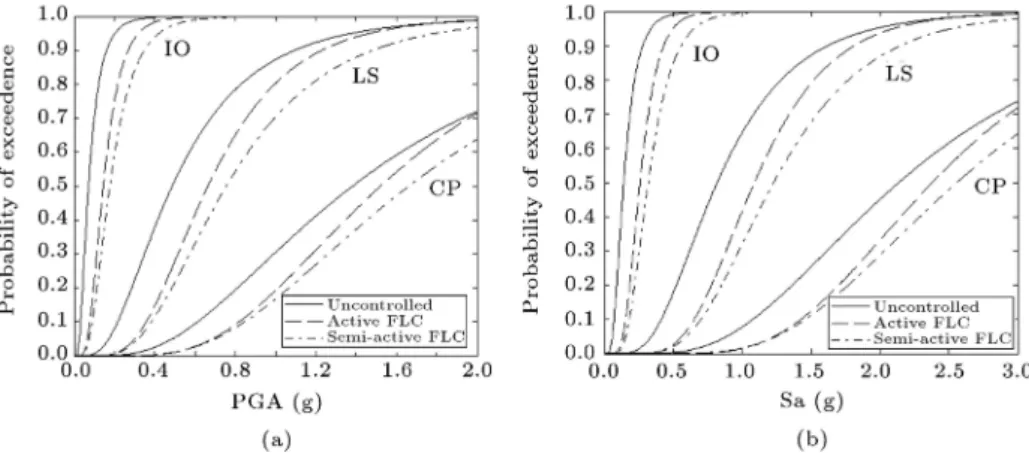
Figure 12 shows fragility curves for uncontrolled, semi-active, and active FLC. This gure indicates that semi-active FLC can reduce the probability of damage even better than active FLC.
8. Conclusion
To investigate the eectiveness of fuzzy controller on seismic damage of buildings, fragility curves were generated for uncontrolled and controlled structures of three-story benchmark building. Two fuzzy controllers
Figure 12. Comparing fragility curves for uncontrolled, active, and semi-active controlled structures using deterministic parameters.
were designed as active and semi-active controllers to control actuators and viscous dampers, respectively. The eect of structural uncertainties on the damage was investigated through considering the probabilistic variables. To realize the parameters that have the most eect, First-Order Second Moment (FOSM) method was employed. Plus, to simulate the structure includ-ing uncertainties, Latin hypercube samplinclud-ing method was employed. Performance of active and semi-active fuzzy controllers were compared with the LQG and clipped-optimal controllers.
Probabilistic analysis using FOSM method showed that the uncertainty in mass and yield strength has more eect on the maximum drift of structure than damping coecient and elastic modulus.
Fragility curves showed that although both active fuzzy and LQG controllers can decrease the probability of damage meaningfully, in low intensities of seismic input, LQG controller may increase it in high inten-sities. Moreover, it is found that the performance of fuzzy controller was to some extent better than LQG controller. It is also observed that the eectiveness of both controllers were not sensitive to uncertainty in structural parameters.
Comparing semi-active fuzzy and clipped-optimal controlled structures with the uncontrolled structure showed that both controllers were completely success-ful. They decreased the probability of damage for all intensities of seismic input signicantly. Although the performance of semi-active fuzzy controller was better than that of Clipped-optimal controller, it is more sensitive to uncertainty in structural parameters. References
1. Marinaki, M., Marinakis, Y. and Stavroulakis, G.E. \Fuzzy control optimized by a multi-objective dier-ential evolution algorithm for vibration suppression of smart structures", Computers & Structures, 147, pp. 126-137 (2015).
2. Park, K.-S. and Ok, S.-Y. \Modal-space reference-model-tracking fuzzy control of earthquake excited structures", Journal of Sound and Vibration, 334, pp. 136-150 (2015).
3. Karamodin, A., Irani, F. and Baghban, A. \Eec-tiveness of a fuzzy controller on the damage index of nonlinear benchmark buildings", Scientia Iranica A, 19(1), pp. 1-10 (2012).
4. Kwon, O.-S. and Elnashai, A. \The eect of material and ground motion uncertainty on the seismic vulnera-bility curves of RC structure", Engineering Structures, 28, pp. 289-303 (2006).
5. Padgett, J.E. and DesRoches, R. \Methodology for the development of analytical fragility curves for retrotted bridges", Earthquake Engng. Struct. Dyn., 37, pp. 1157-1174 (2008).
6. Guneyisi, E.M. and Altay, G. \Seismic fragility assess-ment of eectiveness of viscous dampers in R/C build-ings under scenario earthquakes", Structural Safety, 30, pp. 461-480 (2008).
7. Taylor, E. \The development of fragility relationship for controlled structures", Masters Thesis, Washington University, St. Louis, Missouri (2007).
8. Wong, K.K.F. and Harris, J.L. \Seismic damage and fragility analysis of structures with tuned mass dampers based on plastic energy", Struct. Design Tall Spec. Build., 21, pp. 296-310 (2012).
9. Perotti, F., Domaneschi, M. and Grandis, S.D. \The numerical computation of seismic fragility of base-isolated nuclear power plants buildings", Nuclear En-gineering and Design, 262, pp. 189-200 (2013).
10. Siqueira, G.H., Sanda, A.S., Paultre, P. and Padgett, J.E. \Fragility curves for isolated bridges in east-ern Canada using experimental results", Engineering Structures, 74, pp. 311-324 (2014).
11. Aguirre, J.J. and Almazan, J.L. \Damage potential reduction of optimally passive-controlled nonlinear structures", Engineering Structures, 89, pp. 130-146 (2015).
Sun, J. \Development of ground motion time histories for phase II of the FEMA/SAC steel project", SAC Background Document Report No. SAC/BD-97/04 (1997).
14. Barroso, L.R. and Winterstein, S. \Probabilistic seis-mic demand analysis of controlled steel moment-resisting frame structure", Earthquake Engng. Struct. Dyn., 31, pp. 2049-2066 (2002).
15. Bazzuro, P. and Cornell, C.A. \Seismic hazard analysis of nonlinear structures I: methodology", Journal of Structural Engineering (ASCE), 120(11), pp. 3320-3344 (1994).
16. Erberik, M.A. and Elnashai, A.S. \Fragility analysis of at-slab structure", Engineering Structures, 26, pp. 937-948 (2004).
17. FEMA 356, Prestandard and Commentary for the Seismic Rehabilation of Buildings, Federal Emergency Management Agency (2000).
18. Kazantzi, A.K., Righiniotis, T.D. and Chryssan-thopoulos, M.K. \Fragility and hazard analysis of a welded steel moment resisting frame", Journal of Earthquake Engineering, 12, pp. 596-615 (2008).
19. Park, J. and Kim, J. \Fragility analysis of steel moment frames with various seismic connections
sub-Biographies
Amir Baghban is a PhD student in Structural En-gineering in Ferdowsi University of Mashhad (FUM), Iran. He received his MS degree from FUM in 2010. His research interests are structural control and steel structure.
Abbas Karamodin received his BS and MS degrees in Structural Engineering from University of Tehran (UT) in 1986 and his PhD degree in Structural Engineering from Ferdowsi University of Mashhad (FUM) in 2009, with a minor in structural control. Since 1987, he has served in FUM as a faculty member. He has published 3 books in his related eld and many papers in respected journals and conference proceedings. His areas of research are earthquake engineering and structural control.
Hassan Haji Kazemi is a Professor in the De-partment of Civil Engineering, Ferdowsi University of Mashhad, Mashhad, Iran. His main research interests include behavior of concrete structures and tall build-ings.