Stability of Feature Ranking Algorithms on Binary Data
Aqsa Shabbir1, Kashif Javed2, Yasmin Ansari3 and Haroon A Babri21. Department of Electrical Engineering, Lahore College for Women University, Lahore. 2. Department of Electrical Engineering, University of Engineering and Technology, Lahore 3. College of Computer Science and Engineering, Prince Muhammad Bin Fahad University, KSA. Corresponding Author: [email protected]
Abstract
Stability or robustness is a crucial yardstick for analyzing and evaluating feature selection algorithms which have become indispensible due to unprecedented advancements in knowledge data discovery and management. Stability of feature selection algorithms is taken as the insensitivity of the algorithm to perturbations in the training data with reference to the performance of the algorithm with all training data. In this work, we propose an algorithm for evaluating and quantifying the robustness of feature ranking algorithms and test three feature ranking algorithms: relief, diff-criterian and mutual information on four different real life binary data sets from text mining, handwriting recognition, medical diagnoses and medicinal sciences. We then analyze the stability profiles of feature selectors and determine how stability is a desirable characteristic of a feature ranking algorithm. We find that diff-criterian, and mutual information, outperform relief in stability.
1. Introduction
Information technology has made unprecedented advances in the recent times. Data collection and its storage have been facilitated resulting in a manifold increase in the volume and dimensionality of data available for processing. This has necessitated research in this domain, consolidating feature selection as an effective data preprocessing tool, widely, employed for classification tasks in the field of machine learning [1], pattern recognition [2] and data mining[3]. Feature selection has been embarked upon by researchers, due to its potential to improve and economize automatic decision making while bringing about a reduction in dimensionality. Advantages of feature selection techniques when they are employed at the pre processing stage include a reduction in the quantity of data required to achieveimproved predictive accuracy, compact and precise learned knowledge and a markedly reduced execution time, [4].
Feature selection techniques are typically classified into two main categories, which are, feature ranking (FR) and feature subset selection (FSS). Feature ranking algorithms operate by assigning ranks to features by assessing each feature individually according to some criterion. The ranking is then utilized for retaining or discarding the
features. On the other hand, feature subset selection, searches explicitly for the optimal subset by collective evaluation of features in the form of subsets. FR algorithms, when contrasted with FSS algorithms, are simpler and computationally efficient with a linear time complexity, [4]. This superiority over FSS methods has made FR methods quite popular and also, our choice of, feature selection technique for this work.
Besides high accuracy and computational efficiency, stability is a critical parameter for gauging the performance of feature selection techniques. Stability can be defined as the insensitivity of the outcome of the feature selection techniques to fluctuations or differences in the training data with reference to the outcome of the same technique with all training data. This aspect is of immense importance in domains and applications where feature selection is employed as a knowledge discovery tool for identifying distinctive markers to explain the observed behavior. For example, in genomics and microarray analysis, researchers aspire to obtain the smallest set of features that can accurately depict the processes governing different behaviors predominant in microarray samples [5]. A feature selection technique, without causing degradation in the subsequent classification performance, can often select very different feature sets when subjected to fluctuations in the training
data, [6], [7], [8]. This lack of stability in feature selection techniques can diminish the domain specialists’ confidence in empirically validating the selected features.
Investigation of the stability of feature ranking algorithms provides application domain experts with quantified results with regard to the stability of the selected features to fluctuations in the training data. Robustness of feature selection algorithms is a relatively less explored field and almost no experimental results exist for binary data, which is a key motivation for our choice of this work. Furthermore, binary data sets have become pervasive in real-world applications. Modeling systems with binary data is easy, simple and widely employed. [9], [10] and [11].
The rest of the paper is organized as follows: in Section 2, we discuss related work on the stability of feature selection techniques, following which we propose and introduce measures that can be utilized for analyzing the stability of FR algorithms. In section 3, we propose an algorithm for evaluating stability termed as stability evaluation strategy (SES). In section 4, we outlay the experimental setup, data sets used and the FR algorithms that are analyzed in this study. In section 5, we present our findings and establish stability profiles for our FR algorithms. In section 6, we finally conclude.
2. Stability
Theory
2.1 Related Work
A large volume of existing feature selection algorithms calls for evaluation techniques for analyzing them and bringing forth their merits and demerits. In most works, the two criteria that have been explored and established for gauging the performance of feature selection techniques are accuracy and efficiency, [12], [13], [14] and [15]. Recently, researchers have realized that stability is also a crucial performance metric, when evaluating feature selection algorithms.
Kalaous et al.[16] in evaluating stability of algorithms employed tools from statistics, namely, Tanimoto distance between sets, Spearman rank correlation and Pearson correlation coefficient to compute the association between feature preferences expressed in terms of feature subset selection, feature
ranking and feature weight scoring, respectively. They worked with high dimensional data sets, from proteomics, genomics and text mining and exploited various univariate and multivariate feature selection algorithms for their experiments. Their results indicated that none of the feature selection techniques were consistently stable for all datasets. They employed 10 fold stratified cross validation for empirically establishing the stability of their feature selectors. They generated a feature preference for each of the training folds and estimated the final stability by averaging the similarity of each pair of feature preferences. The technique adopted by them, however, disregarded the following: the features preferences produced by the sub sampled training folds may be similar or dissimilar to each other, however they may produce contrasting results when compared with feature preferences generated by the entire training data; also, the larger is the overlap between the training folds, more similar are the feature preferences likely to be as discussed by Alelyani et al. [17].
Somoland Novovicova [18] evaluated the merits and demerits of existing similarity measures and then proposed the framework for new similarity measures which can be applied to feature subset selectors which yield subsets of varying cardinalities. They also proposed a technique based on Shannon Entropy for estimating the similarity of feature subset selectors that yield subsets of varying sizes, [19]. The authors, however, did not propose any algorithm or offer any new methodology for establishing the stability of FSTs. Moreover, they also did not empirically test their measures on any real life data sets.
In the most recent work Han and Yu, presented a theoretical framework for feature selection stability based on a formal bias variance decomposition of feature selection error, [20]. The work highlights the tradeoff between the accuracy and stability of feature selectors and suggests that one does not have to be compromised for attaining the other.
Very recently Alelyani et al. [17] provided a new perspective to the problem of stability assessment for feature selection algorithms. They argue, that if a certain sample of training data, S1, is very similar to another sample of the training data, S2, and the two produce almost identical feature
rankings, when the feature selector is trained on each respectively, we can assert the feature selector is stable. Similarly, if the feature rankings produced by them are very different, we can assert with a certain degree of confidence that the feature selector is unstable. However, if the two samples of training data are very different and the two produce different feature rankings, it would be difficult to draw any conclusion straight away, as even a reasonably stable feature selector may draw up different feature rankings, in such a scenario. They investigated this dilemma, by conducting experiments with 5 different data sets and 5 different well known feature selection algorithms. On the basis on their experimental results, they concluded that less is the variance in the samples of training data, more stable will be a feature selector.
2.2 Stability Measures
We define stability as the robustness of the feature rankings; a FR algorithm produces to variations in the training data set drawn from the same distribution with reference to feature rankings produced on all training data. Let Y ={f1...fN} be
the set of all features of size N. A FR algorithm produces a ranking of all features given as
} ... {r1 rN
r= where 1≤ri≤N.
Determination of stability of feature rankings calls for a similarity measure or alternatively a dissimilarity measure, which can be used to compare and thus quantify the stability prevalent across feature rankings.
Kalaous et al. [16], for computing similarity between rankings r and ri′, use Spearman’s rank correlation coefficient given by:
∑
−−′ − = ′ i i i R n n r r r r S ) 1 ( ) ( 6 1 ) , ( 2 2where
r
iand ri′ are ranks of feature i in rankings r andr
′
respectively. Values yielded by Spearman’s rank correlation range from [−1, 1]. A value of 1 implies that the two rankings are identical or that there is perfect correlation in the two rankings, vice versa a value of -1 indicates that the rankings have exactly inverse order or there is perfect negativecorrelation. A value of 0, on the other hand, suggests that there is no correlation between the two ranks.
Spearman’s rank correlation coefficient provides for a reasonable measure for gauging the variability in the ranks of the given rankings, however, we propose the use of Kendall’s Tau, for establishing the robustness of the selected features. Kendall’s Tau, which represents the difference between the probability that the two rankings are in the same order and the probability that they are out of order has certain attractive qualities over Spearman’s rank correlation [21] as it provides a more concrete intuitive explanation and a better estimate of corresponding population parameter.
With an underlying premise of concordance and discordance amongst features, Kendall’s Tau is defined as: [22]
) 1 ( ) . ( ) . ( 2 1 − − = n n Pairs Discordant of No Pairs Concordant of No r
Notion of concordance entails that if (xj,yj)
are two features, belonging to the jth feature ranking
and (xk,yk) are the same two features, but now
belonging to kth feature ranking, the two features are concordant only if (xj,yj) and (yj <yk) or
)
(xj >xk and yj >yk. Discordance is established when (xj <xk) and yj >yk or xj >xk and
k j y
y < Special situation where, xj =xk or
k j y
y = or both xj =xk and yj =yk, are called “ties” and are specially accounted for. Differing on handling of tied ranks, Kendall’s Tau has two variants: Tau b and Tau c. Our work necessitates the use of Tau b, as it is intended for binary and ordinal data. Tau b can intuitively be expressed as the excess of concordant over discordant pairs as a percentage of concordant, discordant, and approximately one-half of tied pairs. Similarity outcomes generated by Kendall’s Tau, also, lie in the range [-1,1], with a value of 1 signifying perfect correlation and a value of -1 indicating perfect negative correlation between rankings.
Dunne et al. [23] suggest using average normalized Hamming distance for determining the variation in the selected feature subsets. We extend their solution to the feature ranks, where each feature
ranking of N features is regarded as a vector of N dimensions. Hamming distance between these vectors i.e. feature rankings quantify the number of mismatched ranks. It computes the percentage difference in matched and unmatched ranks. It assumes values in the range [0, 1]. With 1 indicating complete mismatch in rankings and 0 indicating complete harmony between two feature rankings. Hamming distance, in contrast with the previous two measures, is a measure of dissimilarity between feature ranks.
Lastly, we propose the cosine similarity between the two N dimensional vectors which in our case are feature rankings of N features,
Similarity r r r r r r ′ ′ ⋅ = = ′ * ) cos( ) , (
θ
where, r and r′ are the two feature rankings under evaluation. Cosine similarity, too, gives output in the range [-1, 1]. For cosine similarities resulting in a 0 value, in can be interpreted that the two rankings, are independent i.e. they do not share any commonality. If the cosine similarity results in output 1 that implies that the angle between them is 0º and the two rankings are completely similar.
3. Stability
Evaluation
Schema
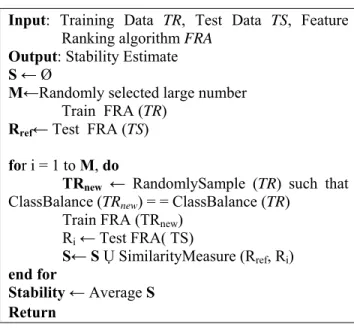
For assessing the stability of FR algorithms, we propose an algorithm, given in Table 1. The proposed algorithm trains the FR algorithm on the entire training data available to obtain the reference ranking. It then conducts random sampling of the training data set while ensuring that the randomly sampled training data set maintains the same balance with respect to class, as the original training data. It follows that, with deploying the above similarity measures for computing the similarity of reference ranking and rankings obtained after training the FR algorithm on sampled training data. Final stability is estimated by averaging the similarities.
4. Experimental
Setup
4.1 Data Set
Experiments were conducted on three different data sets: NOVA, HIVA [24] and LUCAS0 [25].
Table 1 Stability Evaluation Schema (SES)
Input: Training Data TR, Test Data TS, Feature Ranking algorithm FRA
Output: Stability Estimate S ←Ø
M←Randomly selected large number Train FRA (TR)
Rref← Test FRA (TS)
for i = 1 to M, do
TRnew ← RandomlySample (TR) such that
ClassBalance (TRnew) = = ClassBalance (TR) Train FRA (TRnew)
Ri← Test FRA( TS)
S← SỤ SimilarityMeasure (Rref, Ri)
end for
Stability ←Average S Return
NOVA finds its roots in the 20-Newsgroup dataset, [26] and is essentially a text classification dataset. The two classes are: religion and politics, where each text is an email that needs to be classified into one of these categories or classes. Data is sparse binary and comprises of 16,969 features, which represent the vocabulary used for words. NOVA is a partially unbalanced data set with 28.5% instances belonging to the positive class.
HIVA determines the compounds which play an active role against HIV AIDS infection. The two classes are: active and inactive. Data is sparse binary and comprises of 1,617 features, which represent the properties of the molecules of the HIV AIDS opposing compounds. HIVA is a predominantly unbalanced data set with 3.5% instances belonging to the positive class.
LUCAS along with other datasets is used to model the curative, preventive and diagnostic aspects of lung cancer. LUCAS0, a derivative of LUCAS, contains 11 features with 72.15% instances belonging to the positive class.
GINA is utilized for segregating the two digit even numbers from the two digit odd numbers in handwriting recognition tasks. GINA has sparse continuous input variables, which we converted into binary for our experimental purpose, without affecting the inherent sparseness of the dataset.
GINA has 970 features and is a balanced data set with 49.2% instances belonging to the positive class.
For each one of the data sets, the features are pre-identified and marked. Characteristics of the data sets are summarized in Table 2.
4.2 Feature Ranking Algorithms
Feature ranking algorithms are broadly grouped into three categories: correlation based, information theoretic and probabilistic. We selected one algorithm from each category: Relief [27], Mutual Information [28] and Diff-criterian [29]. Relief, motivated by instance based learning, is an FR algorithm, which operates by assigning a relevance weight to each feature. The relevance is assessed in the context of nearest neighbors with a feature that distinguishes well amongst instances from different classes while possessing the same value for instances of the same class receiving a high weight. Relief, despite its limitations; with the most prominent being its inability to deal with redundant features, has found application in many domains and is hugely popular. It’s not only noise tolerant but also has a low execution time.
Diff-criterian is a probabilistic measure and it assigns weights to features by determining their density value in each class. Weight assigned to the
th
i feature, Fiis:
⎟ ⎠ ⎞ ⎜ ⎝ ⎛ − ⎟ ⎠ ⎞ ⎜ ⎝ ⎛ = = = 0 1 1 1 ) ( C F C F
i p i p i
F W
Mutual Information, being a popular information theoretic measure of feature ranking assigns weights based on the information possessed by a feature about the class of the instance. It is estimated by finding the relative entropy or Kullback-
Leibler distance between the joint distribution
) , (F C
p i of two random variables C and Fi and their product distribution p(Fi)p(C) where C
denotes the class and Fi denotes the ith feature. Weights are assigned to a feature based on the mutual information between the feature and the class variable. Features which have greater mutual information will be assigned a higher weight and will thus rank higher in the final feature rankings.
5. Results
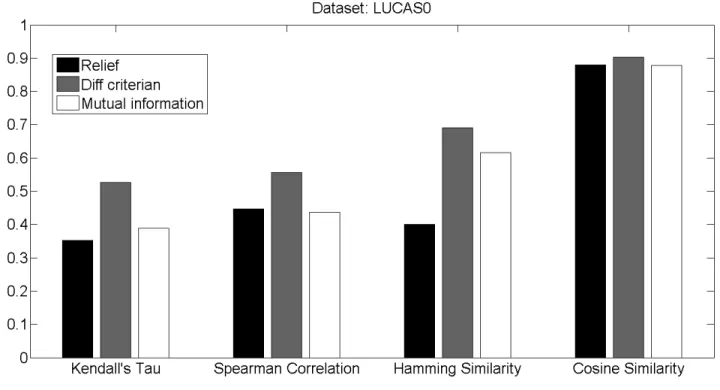
Table II, provides stability results for relief, diff-criterian and mutual information when the Kendall’s Tau (SK), Spearman rank correlation (SS), hamming distance (SH) and cosine similarity (SC) are employed as stability measures. Figure 1, 2, 3 and 4 illustrate the stability profiles of NOVA, HIVA, LUCAS0 and GINA respectively.
SK and SS, both are tools from statistic to measure rank correlations. In practice, SS normally produces a higher value as compared to SK when both are employed in the same situation. However, it’s safe to interpret the lower of the two values i.e. SK and SS, when the two yield different results. This rule has been followed, in the analysis conducted ahead.
HIVA
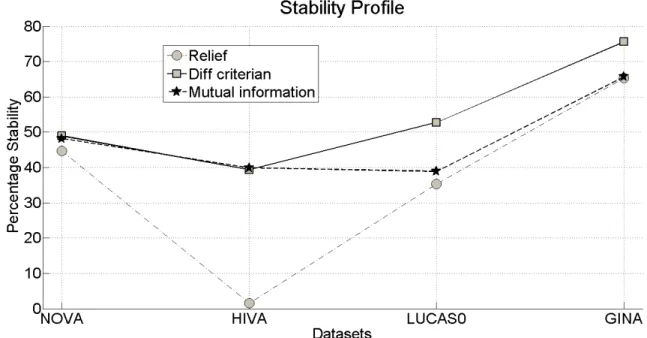
All three feature selection algorithms have been least stable for HIVA data set. Mutual information and diff criterian showed maximal stability for HIVA, with rank correlation coefficients SK and SS indicating a stability of approximately 40%. However, relief performs very poorly with approximately 2% stability. Least stability, shown by HIVA dataset can be attributed to its severely unbalanced nature as the instances belonging to the positive class are a mere 3.5% in contrast to the Table 2 Characteristics of Data Sets
Data Features Train Test Features/ Instances Positive Class Application Domain
NOVA 16,969 1,754 17,537 9.674 28.5% Text Classification
HIVA 1617 4229 38449 0.383 3.5% Drug Discovery for HIV
LUCAS0 11 2000 10000 0.0055 72.15% Lung Cancer
instances belonging to the negative class which comprise a whopping 96.5%. In the experiments conducted, sampling of the training data was balanced with respect to the class variable. If the sampling is done oblivious of the class variable and the balance is not retained, stability results for HIVA data set can be expected to be even lower. In real life scenarios, the latter case is most likely to occur as perturbations in training data are most likely to be a result of unwanted noise, which is random in nature. Relief, where calculation of feature rankings are dependent on the nearest neighbors, is least stable in a scenario where the dataset in unbalanced. As the nearest neighbors are likely to change with sampling of training dataset, algorithms assessment of a features worth, which is based on nearest neighbors, is most likely to fluctuate, resulting in lower stability. This effect will be even more pronounced in a case where the dataset is extremely unbalanced with respect to the class variable, as is the case with HIVA. Diff-criterian which assesses features importance based on the difference of its density in each class is less likely to show instability in the wake of fluctuations in the training data, as feature density is likely to be retained in sampling where
balance with respect to class variable is ensured. Similarly, for mutual information algorithms, sampling of training data is less likely to effect the algorithms’ assessment of a features importance.
NOVA
For NOVA dataset, all three algorithms show almost similar stability with relief, diff-criterian and mutual information, respectively, showing 44.74%, 48.91% and 48.24% stability. Diff-criterian gives the highest stability with relief, demonstrating the lowest stability in this case too. However, unlike HIVA, the gulf between stability provided by mutual information and diff-criterian and the stability demonstrated by relief is not that huge. NOVA unlike HIVA is partially unbalanced with the instances belonging to the positive class comprising 28.5% of total instances.
LUCAS0
For LUCAS0 dataset, diff-criterian once again provides the highest stability of 52.7% followed by mutual information with a stability of 38.91% and relief lagging behind with 35.27% stability.
Table 3 Stability Results
RELIEF
Kendall’s Tau (SK) Spearman Rank Correlation (SS) Hamming Distance (SH) Cosine Similarity (SC)
NOVA 0.45912 0.44746 0.88772 0.8619
HIVA 0.01499 0.022344 0.9839 0.7561
LUCAS0 0.35272 0.44546 0.6 0.87942
GINA 0.6531 0.6644 0.3045 0.9456
DIFF-CRITERIAN
Kendall’s Tau (SK) Spearman Rank Correlation (SS) Hamming Distance (SH) Cosine Similarity (SC)
NOVA 0.48916 0.5029 0.5995 0.8757
HIVA 0.3957 0.39354 0.59554 0.84852
LUCAS0 0.52728 0.55636 0.30908 0.90356
GINA 0.7562 0.7782 0.2345 0.9862
MUTUAL INFORMATION
Kendall’s Tau (SK) Spearman Rank Correlation (SS) Hamming Distance (SH) Cosine Similarity (SC)
NOVA 0.48242 0.49318 0.59962 0.8733
HIVA 0.39962 0.39932 0.59754 0.8499
LUCAS0 0.3891 0.43638 0.3818 0.87746
GINA
Each algorithm provided maximum stability with GINA, which can be attributed to its balanced nature with respect to instances belonging to positive and negative classes. Diff criterian was most stable with approximately 76% stability, followed by mutual information with 67% stability and relief with 65% stability.
Stability, indicated in terms of SK, SS, SH, SC, conform to the discussion above, without any discrepancy in the values of similarity provided by any measure.
In figure 1, 2, 3, 4, and 5, Hamming distance outcomes, which represent dissimilarity, have been converted into similarity values to enable ease of comparison with other similarity measures
Fig.1 Stability Profile for NOVA
Fig. 3 Stability Profile for LUCAS0
In general, diff-criterian is most stable, followed by mutual information whose stability is comparable to that offered by diff criterian. Relief has demonstrated least stability of the three algorithms under investigation. The global stability of each technique is illustrated in figure 5.
6. Conclusions
and
Recommendations
FR algorithms, rather feature selection techniques, in general, distinguish those features that are most suited to the classification process, amongst the pool of largely irrelevant and redundant features, but do not guarantee any degree of classification accuracy as they do not construct or evaluate any classification model. Similarly, stability results, alone cannot provide basis for the selection of an appropriate feature ranking algorithm. Nonetheless, they can influence and assist in the choice of a FR algorithm, when coupled with classification outputs. Stability results play a crucial role in enhancing the confidence of the users and domain experts in the analysis results. We presented four stability measures for gauging the stability of FR algorithms and also proposed a framework based on random sampling for
analyzing stability. We conducted our experiments on four real life binary data sets and evaluated three FR algorithms hailing from correlation based information theoretic and probabilistic feature selection techniques. To the best of our knowledge, this is the first analysis of feature selectors when they are operated on binary data sets.
Future work includes refining and exploring stability measures to provide a better insight into their respective advantages and disadvantages and suitability in a particular context. Extending and exploiting the similarity measures to compare and contrast the feature rankings generated by different FR algorithms.
References
[1] E. Alpaydin, 2010. Introduction to Machine Learning, 2nded. The MIT Press. Cambridge, London, England.
[2] R. O. Duda, P. E. Hart, and D. G. Stork, 2001. Pattern Classification, 2nd ed. Wiley.
[3] Han and M. Kamber, 2006. Data Mining: Concepts and Techniques, 2nd ed. Elsevier.
[4] Guyon, S. Gunn, M. Nikravesh, and L. A. Zadeh. 2006. Feature Extraction: Foundations and Applications. Springer.
[5] S. Loscalzo, L. Yu, and C. Ding. 2009. “Consensus group based stable feature selection,” in Proc. 15th ACM SIGKDD International Conference on Knowledge Discovery and Data Mining (KDD-09), pp. 567–576.
[6] R. Bellman, 1961. “Adaptive Control Processes: A Guided Tour,” Princeton University Press, Princeton, NJ.
[7] S. Raudys and A. Jain, 1991. “Small sample size effects in statistical pattern recognition: recommendations for practitioners,” IEEE Transaction on Pattern Analysis and Machine Intelligence, Vol. 13, No.3, pp.252-264.
[8] R. Kohavi and G. John, 1997. “Wrappers for Feature Selection,” Artificial Intelligence, Elsevier, Vol. 97, No. 1-2, pp. 273–324.
[9] A. Juan and E. Vidal, 2002. “On the use of Bernoulli Mixture Models for Text Classification,” Pattern Recognition, Vol. 35, pp. 2705–2710.
[10] “Annual KDD cup 2001,” 2001. see http://www.sigkdd.org/kddcup/
[11] J. Wilbur, J. Ghosh, C. Nakatsu, S. Brouder, and R. Doerge, 2002. “Variable Selection in High-Dimensional Multivariate Binary Data with Application to the Analysis of Microbial Community DNA Fingerprints,” Biometrics, Vol. 58, pp. 378–386.
[12] H. Liu and L. Yu, 2005. “Toward integrating feature selection algorithms for classification and clustering,” IEEE Transactions on Knowledge and Data Engineering (TKDE), Vol. 17, No. 4, pp. 491–502.
[13] Der-Shung Yang, Larry Rendell, and Gunnar Blix. 1991. “A scheme for feature construction and a comparison of empirical method,” in
Proc. 10th International Joint Conference on Artificial Intelligence, pp. 699–704.
[14] I. Guyon and A. Elisseeff, 2003. “An introduction to variable and feature selection,” Journal of Machine Learning Research, Vol. 3, pp. 1157–1182.
[15] YvanSaeys, IakiInza, and Pedro Larraaga. 2007. “A review of feature selection techniques in bioinformatics,” Bioinformatics, vol. 23, No. 19, pp.2507-2517.
[16] A. Kalousis, J. Prados, and M. Hilario. 2007. “Stability of Feature Selection Algorithms: A Study on High-Dimensional Spaces,” Knowledge and Information Systems, Vol. 12, No. 1, pp. 95-116.
[17] Salem Alelyani, Zheng Zhao and Huan Liu. 2011. “A Dilemma in Assessing Stability of Feature Selection Algorithms,” in Proc. IEEE International Conference on High Performance Computing and Communications, pp.701-707. [18] Petr Somol and Jana Novovicova, 2010.
“Evaluating the stability of feature selectors that optimize feature subset cardinality.” IEEE Transactions on Pattern Analysis and Machine Intelligence, Vol. 32, No. 11.
[19] Jana Novovicova, Petr Somol and Pavel Pudil, 2009. “A New Measure of Feature Selection Algorithms’ Stability,” in Proc. IEEE International Conference on Data Mining Workshops, pp. 382-387.
[20] Yue Han and Lei Yu. 2010. “A variance reduction framework for stable feature selection,” in Proc. IEEE International Conference on Data Mining, pp. 206-215. [21] Jean D. Gibbons. 1993. Non Parametric
Measures of Association, first ed. Sage Publications.
[22] R.B. Nelsen, “Kendall Tau Metric,” Encyclopedia of Mathematics. Available at http://www.encyclopediaofmath.org/index.php ?title=Kendall_tau_metric&oldid=12869
[23] K. Dunne, P. Cunningham, and F. Azuaje, 2002. “Solutions to Instability Problems with Sequential Wrapper-Based Approaches to Feature Selection,” Technical Report TCD-CD-2002-28, Dept. of Computer Science, Trinity College.
[24] “Agnostic Learning vs. Prior Knowledge Challenge by International Joint Conference on Neural Networks (IJCNN),” 2007 see http://www.agnostic.inf.ethz.ch
[25] “Causality Challenge #1: Causation and Prediction,” 2008, see
http://www.causality.inf.ethz.ch/challenge.php [26] The 20 Newsgroups data set, Available at
http://people.csail.mit.edu/jrennie/20Newsgrou ps
[27] K. Kira and L. A. Rendell. 1992. “A Practical Approach to Feature Selection,” in Proceedings of the 9th International Conference on Machine Learning, pp. 249–256.
[28] T. M. Cover and J. A. Thomas. 1991. “Elements of Information Theory,” John Wiley and Sons, INC.
[29] Kashif Javed, Haroon A Babri and Mehreen Saeed. 2012. “Feature Selection based on Class-dependent Densities for High Dimensional Binary Data,” IEEE Transactions on Knowledge and Data Engineering, vol.24, no.3, pp. 465-477.
[30] “CLOP,” available