Sharif University of Technology
Scientia IranicaTransactions A: Civil Engineering www.scientiairanica.com
Estimating daily pan evaporation using data mining
process
O. Terzi
Faculty of Technical Education, Suleyman Demirel University, 32260 Isparta, Turkey.
Received 22 September 2011; received in revised form 17 October 2012; accepted 21 January 2013
KEYWORDS Pan evaporation; Data mining process; Lake Egirdir.
Abstract. This study investigates the applicability of the data mining process in estimation of daily pan evaporation, a fundamental element in the hydrological cycle. Firstly, the models were developed using autoregressive modeling, frequently preferred in hydrological studies, for Lake Egirdir in the southern part of Turkey, and the suitability of the AR(3) model was shown. Hence, the previous 1-, 2- and 3- day, daily pan evaporation values of Lake Egirdir were used to develop the other DM models. The correlation coecient and root mean square error criteria were used for evaluating the accuracy of the developed models. When the results of the developed models were compared to observed pan evaporation according to these criteria, it was determined that the AR(3) model is a little more appropriate in estimation of daily pan evaporation. Consequently, it was shown that DM models are useful, as they are based on only daily pan evaporation data and do not include meteorological parameters.
c
2013 Sharif University of Technology. All rights reserved.
1. Introduction
Evaporation is the process by which water that has accumulated on land surfaces (including that held in surface depressions and water bodies, such as lakes and reservoirs) is converted into a vapor state and returned to the atmosphere. Evaporation occurs at the evaporating surface; contact between the water body and overlying air. At the evaporation surface, there is a continuous exchange of liquid water molecules into water vapor, and vice versa. Evaporation refers to the net rate of water transfer (loss) into a vapor state. Evaporation rate is a function of several meteorological and environmental factors. Those that are important, from an engineering standpoint, are net solar radiation, saturation vapor pressure, vapor pressure of the air, air and water surface temperatures, wind velocity, and atmospheric pressure. Unlike other phases of the hydrologic cycle, lake evaporation cannot be measured
*. E-mail address: [email protected]
directly. Therefore, several approaches have been developed to calculate evaporation. These vary in nature and are based on a water budget, an energy budget, or mass-transfer techniques. Uncertainty in the applicability of various evaporation formulas has led to the indirect measurement of evaporation using evaporation pans. An evaporation pan is a device designed to measure evaporation by monitoring the loss of water in the pan during a given time period, usually one day. It provides a measurement of the integrated eect of net radiation, wind, temperature and humidity on evaporation from an open surface [1].
Many scientists have tried to estimate evaporation from climatic variables. Stewart and Rouse (1976) de-termined summertime evaporation from shallow lakes using the energy budget and equilibrium models. They showed that actual evaporation could be determined within 10% over periods of two weeks using these models [2]. de Bruin (1978) used the simplied model by combining Priestley-Taylor and Penman equations to estimate evaporation. He indicated that the model
could produce good results for periods of 10 days or more [3]. Morton (1979) modied a model to esti-mate annual evaporation from lakes based on monthly observations of temperature, humidity and sunshine duration. The results of the model were compared with those of the water budget for lakes, and showed that there was good agreement between them [4]. Singh and Xu (1997a) evaluated and compared 13 evaporation equations that belonged to the category of the mass transfer method, and a generalized model form for that category was also developed [5]. Singh and Xu (1997b) further examined the sensitivity of mass transfer based evaporation equations to errors in daily and monthly input data [6]. Xu and Singh (2001) evaluated and generalized temperature based methods for evaporation calculations. Pan evaporation values have been widely used for estimating lake and reservoir evaporation [7-14].
Many researchers have also investigated the ap-plicability of the time series analysis, rstly proposed by Box and Jenkins [15], to hydrology studies, such as rainfall [16], ow [17,18], wind speed [19,20], and radiation [21,22]. Kisi (2004) used Articial Neural Networks (ANN) to predict monthly ow and com-pared the results with autoregressive models. He stated that ANN predictions, in general, are better than those found with AR(4) [23]. Yurekli and Ozturk (2003) determined alternative autoregressive moving average process (ARMA) models using the graphs of autocorrelation (ACF) and partial autocorrelation functions (PACF). The plots of the ACF showed that ARMA (1,0) with a constant was the best model by considering Schwarz Bayesian Criterion (SBC) and error estimates [24]. Torres et al. (2005) used ARMA and persistence models to predict the hourly average wind speed up to 10 h in advance. They showed that the use of ARMA models signicantly improved wind speed forecasts compared to those obtained with per-sistence models [25]. Wu and Chau (2010) investigated ARMA, K-Nearest-Neighbors (KNN), ANN and Phase Space Reconstruction-based Articial Neural Network (ANN-PSR) models to determine the optimal approach of predicting the monthly stream ow time series. They compared these models by a one-month-ahead forecast. They determined that the KNN model gives the best performance among the four models, but only exhibits weak superiority to ARMA [26]. Alhassoun et al. (1997) generated annual and monthly evaporation sequences using the rst order Markov model for ten stations in Saudi Arabia. They evaluated the perfor-mance of the developed models using the methods of fragments, Thomas-Fiering and Two-Tier, and dened their suitability [27]. Knapp et al. (1984) generated a weekly evaporation time series using the mass transfer method for Milford Lake. They also developed a mathematical model for the time series. The model
consists of a mean weekly component represented by a Fourier approximation and a stationary random residue represented by an autoregressive model. They obtained frequency distribution from the synthetic evaporation series, and dened that the estimated evaporation was most sensitive to changes in water temperature [28].
Knowledge discovery uses data mining and ma-chine learning techniques that have evolved through a synergy in articial intelligence, computer science, statistics, and other related elds. Although there are technical dierences, the terms `machine learning', `data mining', and `knowledge discovery and data mining (KDD)' are often used interchangeably [29].
Data mining is often dened as the process of extracting valid, previously unknown, comprehensible information from large databases in order to improve and optimize decisions [30]. In another words, data mining is dened as the identication of interesting structures, where a structure designates the patterns, and statistical or predictive models of the data, and the relationships between their parts [31]. Data mining has been applied to a wide variety of elds for prediction. In addition, data mining has also been applied to other types of scientic data, such as bioinformati-cal, astronomibioinformati-cal, and medical [32]. Keskin et al. (2009) developed pan evaporation models using the data mining process for Lake Egirdir, Lake Kovada, and the Karacaoren Dam, and formed an integrated evaporation model by aggregation of their daily pan evaporation for the Lake District in the southern part of Turkey. They showed that the REP tree model has better agreement with measured daily pan evaporation than other models [33]. Terzi (2012) used the data-mining process to develop rainfall estimation models in Isparta, and tried dierent input combinations using the rainfall values of Senirkent, Uluborlu, Egirdir, and Yalvac stations in Isparta. The most appropriate model was determined as the multilinear regression model (relative error; 0.7%), having monthly rainfall values of Senirkent, Uluborlu and Egirdir stations among the developed models [34].
The objective of the present study is to evaluate the applicability of the data mining process for daily pan evaporation estimation. This task is intended to be accomplished for Lake Egirdir, which is the second largest freshwater lake in the southern part of Turkey.
2. Data mining process
The Data Mining (DM) process generally involves phases of data understanding, data preparation, mod-eling, evaluation and knowledge. The DM process is a hybrid discipline that integrates technologies of databases, statistics, machine learning, signal process-ing, and high performance computing. This rapidly emerging technology is motivated by the need for
new techniques to help analyze, understand or even visualize the huge amounts of stored data gathered from scientic applications. The major data mining functions developed in research communities include summarization, association, classication, prediction and clustering [35].
Data understanding starts with an initial data collection and proceeds with activities to get familiar with the data, to identify data quality problems and to discover rst insights into the data. Data preparation covers all activities that construct the nal dataset to be modeled from the initial raw data. The tasks of this phase may include data cleaning for removing noise and inconsistent data, and data transformation for extracting embedded features [32]. Successful mining of data relies on rening tools and techniques capable of rendering large quantities of data understandable and meaningful [36]. The modeling phase applies various modeling techniques, determines the optimal values for parameters in models, and nds the one most suited to meeting the objectives. The evaluation phase evaluates the model found at the last stage to conrm its validity to t problem requirements. No matter to which areas data mining is applied, most eorts are directed towards the data preparation phase [32].
A good relational database management system will form the core of the data repository, and ade-quately reect both the data structure and the process ow. The database design will anticipate the kind of analysis and data mining to be performed. The data repository should also support access to existing databases, allowing retrieval of supporting information that can be used at various levels in the decision making process [37].
Data mining is a powerful technique for extracting predictive information from large databases. The automated analysis oered by data mining goes beyond the retrospective analysis of data. Data mining tools can answer questions that are too time-consuming to resolve with methods based on rst principles. In data mining, databases are searched for hidden patterns to reveal predictive information in patterns that are too complicated for human experts to identify [38]. De-tailed explanations of the used algorithms in modeling are given in the following.
2.1. Autoregressive modeling
Since the early 1960's, time series models have been extensively used in hydrology and water resources for modeling annual and periodic hydrologic time series. The application of these models has been attractive in hydrology, mainly because the autoregressive form has an intuitive type of time dependence (the values of variable at the present time depend on the values at previous times), and they are the simplest models to use. The autoregressive model (AR) may be generally
written as:
yt= + '1(yt 1 ) + + 'p(yt p ) + "t;
(1) where ytis the time dependent series (variable) and "t
is the time independent (uncorrelated) series, which is independent of yt, and normally distributed with
mean zero and variance, 2
". Coecients '1; ; 'p,
are called autoregression coecients. The parameter set of the model of Eq. (1) is f; 2; '
1; ; 'p; "2g,
which must be specied or estimated from data. Autoregressive models with periodic parameters are those in which part or all of their parameters vary within the year or are periodic. These models are often referred to as periodic AR models. The time series used in hydrological studies are generally annual or monthly [39].
2.2. Multilayer perceptron
The back-propagation learning algorithm is one of the most important historical developments in neural networks. It has reawakened the scientic and engi-neering community to the modeling and processing of many quantitative phenomena using neural networks. This learning algorithm is applied to multilayer feed-forward networks consisting of processing elements with continuous and dierentiable activation functions. Such networks associated with the back-propagation learning algorithm are also called back-propagation networks. Given a training set of input-output pairs, the algorithm provides a procedure for changing the weights in a back-propagation network to classify the given input patterns correctly. For a given input-output pair, the back-propagation algorithm performs two phases of data ow. First, the input pattern is propagated from the input layer to the output layer and, as a result of this forward ow of data, produces an actual output. Then, the error signals resulting from the dierence between the output pattern and the actual output are back-propagated from the output layer to previous layers for them to update their weights [40].
2.3. Radial basis function network
A radial basis function network is a two-layer network, whose output neurons form a linear combination of the basis functions computed by the hidden neurons. The basis functions in the hidden layer produce a localized response to the input. That is, each hidden neuron has a localized receptive eld. The basis function can be viewed as the activation function in the hidden layer, and the basis function used is a Gaussian function [41].
2.4. Decision table
The decision table summarizes the data set with a \decision table." In its simplest state, a decision table
contains the same number of attributes as the original data set, and a new data item is assigned a category by nding the line in the decision table that matches the nonclass values of the data item. This implementation employs the wrapper method to nd a good subset of attributes for inclusion in the table. By eliminating attributes that contribute little or nothing to a model of a data set, the algorithm reduces the likelihood of overtting and creates a smaller, more condensed decision table [42].
2.5. REP tree
The decision tree tool of the REP tree in Weka was employed to formulate resource access patterns for considered applications that are common in the target execution environment. The REP tree procedure builds a decision tree using information gain as the splitting criterion, and uses reduced-error pruning for pruning. This procedure is also characterized by lower computational overhead compared to other decision-tree-based classication methods, due to its ecient pruning mechanism [43].
2.6. KStar
As a nearest-neighbor classier, this algorithm is highly eective in situations with noisy training data, pro-vided it is supplied with a large enough training set. An important note to consider is that the algorithm calcu-lates the distance between instances on all attributes, unlike some other methods. If only a few features of the given vector are relevant, then two instances with two identical values for the relevant features may nd themselves spaced far apart by this algorithm [44].
3. Application
3.1. Data understanding
The DM process was applied to Lake Egirdir in the southwestern part of Turkey to estimate daily evapo-ration. Lake Egirdir has a surface area and volume of 470 km2 and 4360 hm3, respectively, and is used as a
source of drinking and irrigation water (Figure 1). The daily pan evaporation data were obtained from the State Hydraulic Works for 1998-2005. The training dataset consisted of the years 1998-2003, and the trained models were used to run a set of test data for the year 2004-2005.
3.2. Data preparation
This step investigates whether or not there are any missing data. For substitution of missing data, mean values were used. The previous 1-, 2- and 3- day pan evaporation values of Lake Egirdir were used to estimate daily pan evaporation in the data mining process.
3.3. Modeling
In order to estimate daily pan evaporation for Lake Egirdir, autoregressive modeling, multilayer percep-tron, a radial basis function network, a decision table, a REP tree and KStar algorithms in the data mining process were used. A detailed explanation of these algorithms is given above.
3.4. Evaluation
In this study, class A pan evaporation measurement values were used in the data mining modeling. The major diculty in using a class A pan for direct measurements is due to the subsequent application of coecients based on the measurements from a small
tank to large bodies of open water. Such diculties can be accommodated by the data mining process.
Two criteria were used to evaluate the adequacy of each model: The correlation coecient (R) and the Root Mean Square Error (RMSE). The R, based on evaporation estimation errors, is calculated as:
R=
n
P
i=1(Ei Emean)(Ei(m) E(m)mean)
s
n
P
i=1(Ei Emean) 2
s
n
P
i=1(Ei(m) E(m)mean) 2
; (2)
where n is the number of observed data, Ei, Ei(m),
Emean and E(m)mean are daily pan evaporation
mea-surements, the result of the developed evaporation model, the mean evaporation measurement and mean model result, respectively. The root mean square error represents the error of the model and is dened as:
RMSE = v u u t 1
n
n
X
i=1
(Ei Ei(m))2; (3)
whose parameters have been dened above. 3.5. Knowledge
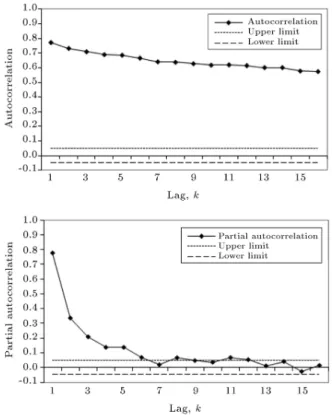
The daily pan evaporation data set is a periodic series due to shorter time intervals than the annual data set. Internal dependence increases because sta-tistical characteristics in periodic series are dierent for another day of the same process. Firstly, the series must be tted to normal distribution and then standardized for removing the periodicity of the daily pan evaporation data set. It was controlled, according to skewness, whether or not pan evaporation values t to normal distribution, and it was seen that they do. Then, moment values (mean, standard deviation and skewness) of pan evaporation data were determined. The standard normal series was obtained by applying a standardization process to the historical time series. The autocorrelation and partial autocorrelation values of a standard normal series were obtained. The upper and lower limits were determined for a 95% condence interval (Figure 2). It was shown that the yt series
was a dependent series, according to autocorrelation values. Then, the autocorrelation coecient (k) was calculated and the residual series was determined according to this value. The AR(1), AR(2) and AR(3) models were tested for Lake Egirdir and it was concluded that the AR(3) model was the most appropriate for autocorrelation values. A correlogram of the models is given in Figure 3, and it can be seen that there is agreement between the AR(3) model and the correlogram of the historical series. The parameters of developed AR models were given Table 1. It was shown that the AR(3) model provided a stationarity
Figure 2. The 95% condence interval, autocorrelation and partial autocorrelation values.
Figure 3. Correlogram of historical and AR(1), AR(2) and AR(3) models.
condition when using Eq. (4): up '
1up 1 '2up 2 'p= 0: (4)
According to Eq. (5), variance of residual series (2 )
was obtained:
2
= N
2
(N p) 0 @1 Xp
j=1
'jrj
1
A ; (5)
where N is number of data, p is model parameter, and ' is autoregression coecient. The Akaike Information Criterion (AIC) was used to investigate the tness of the selected model degree. The AICs of AR (1), AR(2) and AR(3) models were calculated to be
Table 1. The autocorrelation coecients of AR models.
AR models 1 2 3
AR(1) 0.775 -
-AR(2) 0.516 0.334 -AR(3) 0.447 0.227 0.207
0.954, 0.881 and 0.846, respectively. It was conrmed that the AR(3) model having the smallest AIC was appropriate.
The synthetic series was generated for the AR(3) model. The mean and standard deviations of the series were calculated and compared with the historical series (Figures 4 and 5). As shown in Figures 4 and 5, there was agreement between the historical and synthetic series.
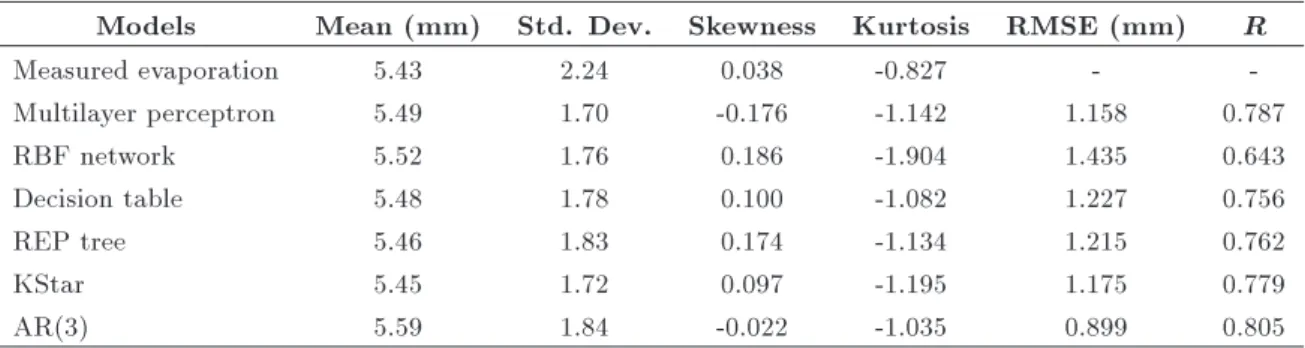
Hence, previous 1-, 2- and 3-day daily pan evap-oration values of Lake Egirdir were used to develop the models with multilayer perceptron, a radial basis function network, a decision table, a REP tree and KStar algorithms in the process, after the compatibility of AR(3) was shown. The best-t DM algorithm was determined according to R and RMSE values for the testing data set. The results of statistical analyses of the developed models were given in Table 2. As seen from Table 2, comparing these models, it is shown that the AR(3) model has the lowest RMSE (0.899) and the highest R (0.805) for the testing set. The results of the AR(3) model were plotted against measured daily pan evaporation for training and testing sets in Figure 6.
Figure 4. The mean values for synthetic series.
Figure 5. Standard deviations for synthetic series.
As shown in Figure 6, the AR(3) model comparison plot is around 45 straight lines, which imply that
there are no bias eects in the models for all sets. The results of the AR(3) model, together with the daily pan evaporation measurements, were presented in Figure 7. It shows that the AR(3) model matches daily pan evaporation closely, although it has variations during high and low evaporation periods. It shows that the developed AR(3) model gives the best result to estimate evaporation for Lake Egirdir. In the future, when more data are obtained, the developed models need to be revised. Also, the other developed models can give better results than AR(3) when adding more data or when developing models for dierent regions. Suitable results cannot be always obtained from the AR(3) model when estimating evaporation in another region, because the AR(3) model was developed only for Lake Egirdir. The models need to be reestablished
Figure 6. Scatter diagrams between the AR(3) model versus daily pan evaporation.
Table 2. The descriptive statistics of developed models.
Models Mean (mm) Std. Dev. Skewness Kurtosis RMSE (mm) R
Measured evaporation 5.43 2.24 0.038 -0.827 -
-Multilayer perceptron 5.49 1.70 -0.176 -1.142 1.158 0.787
RBF network 5.52 1.76 0.186 -1.904 1.435 0.643
Decision table 5.48 1.78 0.100 -1.082 1.227 0.756
REP tree 5.46 1.83 0.174 -1.134 1.215 0.762
KStar 5.45 1.72 0.097 -1.195 1.175 0.779
AR(3) 5.59 1.84 -0.022 -1.035 0.899 0.805
Figure 7. Time series of estimated and observed daily evaporation values for testing set.
or calibrated according to the data of the dierent region.
4. Conclusions
For the purpose of comparing data mining techniques, in this study, various models were developed to es-timate daily pan evaporation. The proposed tech-niques were applied to Lake Egirdir, which meets vital requirements, such as irrigation and drinking water. Firstly, AR(1), AR(2) and AR(3) models were developed, and it was shown that the AR(3) model was the most appropriate, according to autocorrelation values. Then, the previous 1-, 2- and 3- day pan evaporation values of Lake Egirdir were used to develop the models, using the other algorithms in the DM process. Comparing the developed models, it was demonstrated that the AR(3) model had higher R than other DM algorithms. Also, the performance of the developed models suggested that daily pan evaporation could be successfully estimated using DM approaches, without needing meteorological parameters in water resources planning and management. Finally, the models can be used for estimating evaporation, when the measurement system has failed, or to estimate missing daily pan evaporation data in hydrological modeling studies.
References
1. Ponce, V.M., Engineering Hydrology, Principles and Practices, Prentice-Hall, New Jersey, USA (1989).
2. Stewart, R.B. and Rouse, W.R. \A Simple method for determining the evaporation from shallow lakes and ponds", Water Resour. Res., 12, pp. 623-627 (1976).
3. de Bruin, H.A.R. \A simple model for shallow lake evaporation", J. Appl. Meteorol., 17, pp. 1132-1134 (1978).
4. Morton, F.I. \Climatological estimates of lake evapo-ration", Water Resour. Res., 15, pp. 64-76 (1979).
5. Singh, V.P. and Xu, C-Y. \Evaluation and generaliza-tion of 13 mass-transfer equageneraliza-tions for determining free water evaporation", Hydrolog. Process., 11, pp. 311-323 (1997a).
6. Singh, V.P. and Xu, C-Y. \Sensitivity of mass transfer-based evaporation equations to errors in daily and monthly input data", Hydrolog. Process., 11, pp. 1465-1473 (1997b).
7. Xu, C-Y. and Singh, V.P. \Evaluation and general-ization of temperature-based methods for calculating evaporation", Hydrolog. Process., 15, pp. 305-319 (2001).
8. Ikebuchi, S., Seki, M. and Ohtoh, A. \Evaporation from Lake Biwa", J. Hydrol., 102, pp. 427-449 (1988).
9. Choudhury, B.J. \Evaluation of an empirical equation for annual evaporation using eld observations and results from a biophysical model", J. Hydrol., 216, pp. 99-110 (1999).
10. McKenzie, R.S. and Craig, A.R. \Evaluation of river losses from the Orange River using hydraulic model-ing", J. Hydrol., 241, pp. 62-69 (2001).
11. Vallet-Coulomb, C., Legesse, D., Gasse, F., Travi, Y. and Chernet, T. \Lake evaporation estimates in tropical Africa (Lake Ziway, Ethiopia)", J. Hydrol., 245, pp. 1-18 (2001).
12. Abtew, W. \Evaporation estimation for Lake Okee-chobee in South Florida", J. Irrig. Drain. Eng., 127(3), pp. 140-147 (2001).
13. Keskin, M.E. and Terzi, O. \Articial neural network models of daily pan evaporation", J. Hydrol. Eng., 11(1), pp. 65-70 (2006).
14. Keskin, M.E., Terzi, O. and Taylan, E.D. \Fuzzy logic model approaches to daily pan evaporation estimation in western Turkey", Hydrolog. Sci.-J.-des Sciences Hydrologiques, 49(6), pp. 1001-1010 (2004).
15. Box, G.E.P. and Jenkins, G.M., Times Series Analysis Forecasting and Control, Holden-Day, San Francisco, USA (1970).
16. Nguyen, V.T.V. and Rouselle, J. \A stochastic model for the time distribution of hourly rainfall depth", Water Resour. Res., 17, pp. 399-409 (1981).
17. Carlson, R.F., MacCormick, A.J.A. and Watts, D.G. \Application of linear models to four annual stream-ow series", J. Water Resour. Res., 6(4), pp. 1070-1078 (1970).
18. Bender, M. and Simonovic, S. \Time-series modeling for long-range stream-ow forecasting", J. Water Re-sour. Plan. Manag., 120(6), pp. 857-870 (1994).
19. Torres, J. L., Garc'ia, A., Prieto, E. and De Francisco, A. \Characterization of wind speed data according to wind direction", Solar Energy, 66(1), pp. 57-64 (1999).
20. Kamal, L. and Jafri, Y.Z. \Time series models to simulate and forecast hourly averaged wind speed in Quetta, Pakistan", Solar Energy, 61(1), pp. 23-32 (1991).
21. Mora-Lo'pez, L.L. and Sidrach-de-Cardona, M. \Mul-tiplicative ARMA models to generate hourly series of global irradiation", Solar Energy, 63(5), pp. 283-291 (1998).
22. Morida, S., Gosainb, A.K. and Kesharib, A.K. \Solar radiation estimation using temperature-based, stochastic and articial neural networks approaches", Nord. Hydrol., 33(4), pp. 291-304 (2002).
23. Kisi, O. \River ow modeling using articial neural networks", J. Hydrol. Eng., 9(1), pp. 60-63 (2004).
24. Yurekli, K. and Ozturk, F. \Stochastic modeling of annual maximum and minimum streamow of Kelkit Stream", International Water Resources Association Water International, 28(4), pp. 433-441 (2003).
25. Torres, J.L. Garcia, A., De Blas, M. and De Francisco, A. \Forecast of hourly average wind speed with ARMA models in Navarre (Spain)", Solar Energy, 79, pp. 65-77 (2005).
26. Wu, C.L. and Chau, K.W. \Data-driven models for monthly streamow time series prediction", Engineer-ing Applications of Articial Intelligence, 23, pp. 1350-1367 (2010).
27. Alhassoun, S., Sendil, U., Al-Othman, A.A. and Negm, A.M. \Stochastic generation of annual and monthly evaporation in Saudi Arabia", Canadian Water Re-sources Journal, 22(2), pp. 141-154 (1997).
28. Knapp, H.V., Yu, Y.-S. and Pogge, E.C. \Monthly evaporation for Milford Lake in Kansas", J. Irrig. Drain. Eng., 110(2), pp. 138-148 (1984).
29. Goodwin, L., VanDyne, M., Lin, S. and Talbert, S. \Data mining issues and opportunities for building nursing knowledge", J. Biomed. Inf., 36, pp. 379-388 (2003).
30. Braha, D. and Shmilovici, A. \Data mining for improv-ing a cleanimprov-ing process in the semiconductor industry", IEEE Trans. Semi-cond. Manuf., 15(1), pp. 91-101 (2002).
31. Fayyad, U.M. and Uthurusamy, R. \Evolving data mining into solutions for insights", Communications of the ACM, 45(8), pp. 28-31 (2002).
32. Li, S.T. and Shue, L.Y. \Data mining to aid policy making in air pollution management", Expert System and Applications, 27, pp. 331-340 (2004).
33. Keskin, M.E., Terzi, O. and Kucuksille, E.U. \Data mining process for integrated evaporation model", J. Irrig. Drain. Eng., 135(1), pp. 39-43 (2009).
34. Terzi, O. \Monthly rainfall estimation using data-mining process", Applied Computational Intelligence and Soft Computing, 2012, pp. 1-6 (2012).
35. Zhou, Z.-H. \Three perspectives of data mining", Articial Intelligence, 143(1), pp. 139-146 (2003).
36. Mattison, R. \Data warehousing: Strategies. Tech-nologies and techniques statistical analysis", SPSS Inc. White Papers (2000).
37. Rupp, B. and Wang, J. \Predictive models for protein crystallization", Methods, 34, pp. 390-407 (2004).
38. Homann, D. and Apostolakis, J. \Crystal structure prediction by data mining", Journal of Molecular Structure, 647, pp. 17-39 (2003).
39. Salas, J.D., Delleur, J.W., Yevjevich, V. and Lane, W.L. Applied Modeling of Hydrologic Time Series, Water Resources Publications, Colorado (1980).
40. Lin, C.T. and Lee, C.S.G., Neural Fuzzy Systems, Prentice Hall, PTR 797, New Jersey, USA (1995).
41. Fu, L., Neural Networks in Computer Intelligence, McGraw-Hill, New York, USA (1994).
42. Cunningham, S.J. and Holmes, G. \Developing innova-tive applications in agriculture using data mining", in The Proceedings of Southeast Asia Regional Computer Confederation Conference, Singapore (1999).
43. Rajan, D., Poellabauer, C. and Chawla, N. \Resource access pattern mining for dynamic energy manage-ment", Proceedings of the Workshop on Autonomic Computing: A New Challenge for Machine Learning, Berlin, Germany (2006).
44. Young, A. \Automatic acronym identication and the creation of an acronym database", The Technical Report, The University of Sheeld (2004).
Biography
Ozlem Terzi received her PhD degree in Civil En-gineering from Suleyman Demirel University, Isparta, Turkey, where she is currently Associate Professor in the Technical Education Faculty. Her research interests include hydrology, water resources planning and articial intelligence methods.