ISSN: 2349-4468
International Journal of Advances in Management, Economics and Entrepreneurship
Available online at:
www.ijamee.info
RESEARCH ARTICLE
The Multivariate EWMA Model and Monitoring Bio Surveillance
Xia Pan
1, Jeffrey E. Jarrett
2*1Lingnan College, Sun Yat -sen University Guangzhou, China.
2Management Science and Finance (CBA) University of Rhode Island Kingston, RI (USA).
*Corresponding Author: Email: [email protected]
Abstract
In this study, we examine a common problem is bio surveillance in health care. Bio surveillance is the process of monitoring health data to assess changes in the likelihood of disease incidence. Based on an illustration, we suggest that multivariate exponential moving-average (MEWMA) control charts are suitable in most cases where detection and Inspection of several or more variables over a lengthy period of testing provide for the best analysis of data leading to pre-¬diagnostic and diagnostic therapy. Though these methods came from the control of quality and continuous improvement in lean manufacturing and service operations, these methods have useful if not vital application in the analysis of health care data. The indications from this study corroborate earlier findings by others that MEWMA methods fit the diagnostic activity under study.
Keywords:Multivariate Quality Control (MPC), Multivariate Exponentially Weighted Moving Average (MEWMA), Bio Surveillance, Correlation among variables, Serial Correlation.
Monitoring Bio Surveillance with MPC
Methodology
Modern bio surveillance involves the monitoring large number and wide range of data from samples of diagnostic and prediagnostic data for the purpose of giving health care professional to recognize , detect, investigate and respond to the outbreaks of disease and epidemics. A central tool in this monitoring in classical disease surveillance migrated to bio surveillance is the use of multivariate quality control methods. Fricker [1] applied multivariate statistical control methods with an application of multivariate quality control (MQC) to syndromic surveillance. Fricker et al. [2] continued the earlier study by focusing on
directionally sensitive procedure in bio
surveillance. Joner et al. [3] produced a one sided multivariate exponentially weighted moving--average (MEWMA) control chart for the analysis of health data. Niaki and Ershadi [4] used a solution to solve a statistically constrained economic model of a MEWMA control chart in which external intangible costs were considered. Shen and Cooper [5] produced an MPC Bayesian model for bio surveillance. Last, Yahav and Schmueli [6] introduced in practice directionally sensitive MPC charts to bio surveillance methods.
They examined four such techniques and came to conclusions based on simulated data, but suggested further research in the application of these methods.
MEWMA Modeling and Quality Control
processes characteristics in an exponentially weighted control chart. For example, one uses a MEWMA chart to monitor temperature and pressure in a plastic injection molding process. Each MEWMA point incorporates information from all the previous subgroups or observations in combination with a user defined weighting factor. MEWMA charts can help you detect small process shifts quicker than other multivariate charts,
such as the T 2 control chart. Another advantage
of MEWMA charts is that they are not greatly influenced when a small or large value enters the calculation. Also, MEWMA charts can be custom tailored to detect any size shift in the process. Because of this, they are often used to monitor in-control processes for detecting small shifts away from the target.
Multivariate process control simultaneously monitors several processes in a combination. Previous, work on multivariate monitoring since LWCR include a large number of papers in the quality monitoring literature [i.e., Lowry and Montgomery, [11]; Sullivan and Woodall, [12]; Djauhari, [13]; Khoo and Quah, [14]; Kruegel, Valuer and Vigna, [15]; Ye and Chen, [16]; Ye, Chen and Borror [17]; Ye, Giardano and Feldman, [18]; Ye, Vilbert and Chen, [19]; Bersimis, Psakaris and Panaretos [20]; Yeh, Wang and Wu, [21]; Pan and Jarrett [9]; Yang and Rahim [22]; Jarrett and Pan [23,24] Zhang et al. [25] and Pan and Jarrett [26] These monitoring methods
employ the Hotelling T 2 statistic for a current
sample.
Exponentially weighted moving average (EWMA) charts which are more sensitive to moderate shifts in parameters than Univariate charts are widely used in univariate cases [27,28]. LWCR extended the Univariate EWMA control chart to the multivariate case by simulation. They noted that the multivariate EWMA (hereafter MEWMA) chart has greater sensitivity to shifts in the mean
than more traditional Hotelling T2 control
methods.
An alternative MEWMA scheme is Pan [29],
which builds the Hotelling T 2 of the variables
before the formation of the EWMA of the T 2 s. Lui
[30] presented an improvement for MEWMA. Runger and Prahu [31] used Markov chain analysis to calculate the ARL for MEWMA and Prahu and Runger [32] discussed the design of the same scheme. However, all these studies assumed the processes to be serially independent. Others
chose to study the usefulness of MEWMA methods as well. Stoumbus and Sullivan [33] investigated the effects of non-normality on the performance of the MEWMA control chart, and its special case, the Hotelling’s Chi-Square control chart when applied to individual observations.
The purpose in this case was to monitor the mean vector of a multivariate process variable. Khoo studied the sensitivity of MEWMA control charts under other circumstances. In addition a method for optimally designing multivariate EWMA charts based on the measures of average run length (ARL) and median run length (MRL). In this study , we utilize the concept of sensitivity ratios based on the works of Hanson, Eskridge, Steadman and Madisa [34] and Väisänen and Hyttinen [35] who argued that sensitivity ratios are a superior method to assess quality in the areas of bioelectric measurements, plant disease-screening methods and others involving new technology. The sensitivity ratio is a statistic specifically developed for comparing for different measuring methods and is not based on any particular assumption about haw the measuring methods or scales are related. Hence, our purpose is to share new research in the evolution of monitoring processes by comparing results of experiments.
The Pan MEWMA scheme builds the Hotelling T 2
of the variables before order of construction steps is the statistic of MEWMA chart. Pan [29] used integral equation method to compute the ARL's of MEWMA charts for incontrol and outofcontrol situations without the presence of serial correlation. All MEWMA method variations are multivariate EWMA schemes.
The above schemes have a common problem, that is, they cannot be directly employed when the processes are serially correlated. An indirect way to apply the MEWMA schemes for serially correlated processes is to adopt Alwan and Roberts’ [36] approach. They suggest estimating the residuals, i.e., one-step-ahead forecasting errors, of the Auto correlated process. In turn, they apply traditional control charts for the
residuals. Extending this approach to
Available online at: www.ijamee.info
Since the process parameters are usually unknown, the appropriate estimation and use of the covariance matrix is vital for correct execution of MEWMA. This may occur if the direct sample variance is a biased estimate of the population variance for a serially correlated process.
The main reason for utilizing multivariate quality control charts occurs in the situation where the collected data for two or more variables show cross-correlation. In this event a multivariate control chart should produce a better result than studying independent control charts for each variable. We will in the next section, consider applications of MEWMA charts to monitor bio surveillance data to understand the meaning and application of these charts in a simulated experiment.
An Illustration of the MEWMA Control Chart
We consider a bio surveillance procedure where data is collected on five variables (A, B, C, D and E). Based on the results of Table 1 where we exhibit the correlation coefficients and their “p-values” for the cross correlations of the five variables denoted before. Five of the correlation coefficients are large enough to have produces p values which are small enough to reject the null hypothesis that ρi= 0 [α = 0.06 or less]. The remaining cross-correlation coefficients do not have small p¬-values; hence, we cannot make the same conclusion. With the mixed results, we will consider that here is enough evidence that cross-¬correlation exist among enough of the interactions to warrant the use of multivariate methods.
Table 1: Cross-Correlations and P-Values
Correlations: Var A, Var B, Var C, Var D, Var E Var A Var B Var C Var D Var B 0.032
0.593 Var C 0.199 0.061 0.001 0.309 Var D 0.181 0.064 0.832 0.003 0.288 0.000 Var E 0.029 0.006 0.115 0.186 0.630 0.915 0.056 0.002
Cell Contents: Pearson correlation P Value
Minitab®
To observe the sensitivity of the process, we construct using Minitab® six MEWMA control charts based on the dampening coefficient being equal to 0.1 to 0.6 with increments of Recall that the dampening coefficient in MEWMA refers to relationship between the prediction and observed values of the variables. The larger the value of the dampening coefficient indicates the greater the
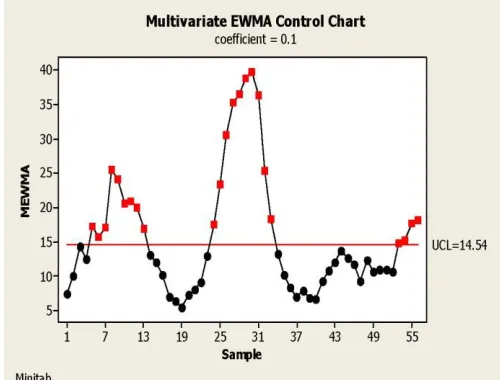
influence of the error in the previous prediction. Obviously if the dampening coefficient was 1, the prediction would be prediction in the previous time period. Figures 1 through 6 provide for the results of the MEWMA charts yield different upper control limits (UCL) for each of the control charts. For example Figure 1 where the coefficient is 0.1, one find a UCL of 14.54 and out of control points of 5 through 13, 24 through 33 and 53 through 56. Note when applying this method the value of the dampening coefficient is crucial.
Figure 1: Test Results for MEWMA Chart of Variable A, ..., Variable E TEST. One point beyond control limits. Test Failed at points: 5, 6, 7, 8, 9, 10, 11, 12, 13, 24, 25, 26, 27, 28, 29, 30, 31, 32, 33, 53, , 5654, 55
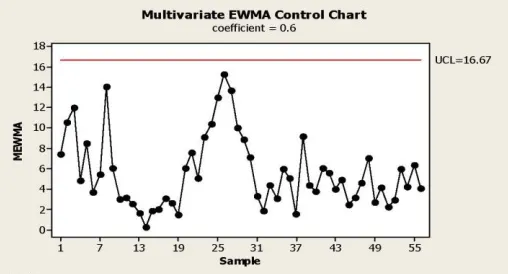
Observe in Figure 2, the UCL equals 15.73 but the number of points out of control becomes smaller. Only points 5, 8, 9 and 24 through 31 are out of control. Figure 3 the UCL increases to 16.22 and points 8 and 24 through 30 are out of control. For Figure 4 (coefficient of 0.4), the UCL equals 16.46 and points 8 and 25 through 28 are out of control. Figure 5 (coefficient equals 0.5), the UCL increases again to 16.60 and the points out of control 26 and 27. Finally, Figure 6 (coefficient equals 0.6) the UCL is now 16.67 and nothing is out of control.
Figure 3: Test Results for MEWMA Chart of Var A, ..., Var E TEST. One point beyond control limits. Test Failed at points: 8, 24, 25, 26, 27, 28, 29, 30
Figure 4:Test Results for MEWMA Chart of Var A, ..., Var E TEST. One point beyond control limits. Test Failed at points: 8, 25, 26, 27, 28
Figure 5: Test Results for MEWMA Chart of Var A, ..., Var E TEST. One point beyond control limits. Test Failed at points: 26, 27.
Figure 6: Test Results for MEWMA Chart of Var A, ..., Var E TEST. Nothing is beyond upper control limits.
From the analysis, we see the selection of the dampening coefficient is crucial in the decision to conclude when the process is out of control or not. The process being the surveillance indicates that for MEWMA control charts, the coefficient is a crucial parameter for assessing whether that each multivariate sample observation is in control or out of control. Some solutions to this is to determine the optimal coefficient. In the MEWMA method of analysis, one would seek to find that value for the dampening coefficient that minimizes the sum of squares of the error term for the predictions resulting from the applications of MEWMA to the data observed in bio surveillance. This would be a multivariate least squares solution.
The Robustness of Average Run Length (ARL)
Average Run Length (ARL) is the number of data points before the MEWMA process is stopped. Prabhu and [32] provide some results on finding the optimal MEWMA control charts based on comparisons of values for the ARL and the initial number of variables in the multivariate process. Using the same simulated bio surveillance data as in the previous illustrations, we shall now consider looking at the sensitivity of our results to changes in assumed value of the ARL leaving the dampening coefficient at one value.
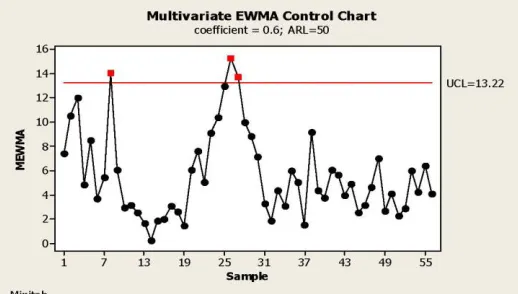
If we reexamine Figure 6, where the coefficient is 0.6 and ARL is 200 and compare it to the results of two additional figures. In Figure 7, the coefficient is still 0.6 but the ARL is now 100. The UCL is now 14.97 and there is one point out of control at 26. Figure 8 presents the same analysis when the ARL equals 50. The UCL is now constructed at 13.22 and three points are out of control at 8, 26 and 27.
Available online at: www.ijamee.info
Figure 8:Test Results for MEWMA Chart of Var A, ..., Var E TEST. Three points beyond control limits. Test Failed at points: 8, 26, 27
Based on the experience of these three constructed MEWMA control charts, we not that decreasing the assumed ARL will decrease the values of the UCL and increase the number of points where the observations will be out of control. These same or similar result occur when a sensitivity analysis is done by varying values of the dampening coefficients.
Summary
In this paper, we studied the construction of MEWMA process control as it applies in bio surveillance. Our purpose was to indicate the usefulness of constructing MEWWA control charts under the condition where the
cross-correlations among of set of observations of five variables produce results whereby these coefficients are often positive and shown to be significantly different from zero at low levels of the probability of a Type I error (significance level). When the construction of control charts are suggested, we find the results of such construction is that the dampening coefficient in the MEWMA process produces varying results. Further, these results are sensitive to the dampening coefficient employed with both the UCL varying and number of out of control points changing and becoming more diminutive as the coefficient increases as the ARL increases. Finally, we suggest a solution to the problem when then data also tend to Aut ocorrelated. We suggest a new way of construction multivariate charts under these conditions. Additional research is necessary to indicate the robustness and sensitivity of this alternative method to changes in the model parameters. Note, that although ARL is often the usual measure for multivariate chart performance, it is not the only criterion, and may have shortcomings. There is much to learn from using MEWMA in bio surveillance especially in the light of health and medical diagnostic processes which may have much great numbers of variables to consider when applications are merited. Alternatively, studies using other criteria such AD (average delay) or MRL (median run length) may prove to be better ways of establishing the MQC decision point in the future as well as unusual event control charts.
References
1.Fricker, R.D. (2007) “Directionally sensitive multivariate statistical process control procedures with application to bio surveillance,” Advances in Disease Surveillance, 3(1):17.
2.Fricker, R.D., Knitt, M.C., and Hu, C.X. (2008) “Comparing directionally sensitive MCUSUM and MEWMA procedures with application to bio surveillance,” Quality Engineering, 20(4):478-494.
3.Joner, M.D., Woodhall, W.H., Reynolds, M.R. and Fricker, R.D. (2008) “Aone-sided MEWMA chart for health surveillance,” Quality and Reliability Engineering International, 24(5):503-518.
4.Niaki, S.T.A. and Ershadi M.J. (2012) “A hybrid ant colony, Markov chain, and experimental design approach tor statistically constrained economic design of MEWMA control charts,” Expert Systems with Applications, 39(3):265-3275
5.Shen, Y. and Cooper, G.F. (2012) “Multivariate Bayesian Modeling of known and unknown causes of events – an application to bio surveillance,” Computer Methods Programs Biomed. Sep; 107(3):436¬46. Doi: 10.1016/j.cmpb.2010.11.015. Epub 2010 Dec 31.
6.Yahav, I. and Schmueli, G. (2013) “Directionally Sensitive Multivariate Control Charts in Practice: Application to Bio surveillance,” Quality and Reliability Engineering International, wileyonlinelibrary.com) DOI: 10.1002/qre.1491
7.Ord, J.K., Koehler, A.B., Snyder, R.D. and Hyndman, R.J. (2009) “Monitoring Processes with Changing Variances,” International Journal of Forecasting, 25(3):518-525.
8.Lowry, C. A. W. Woodall, CW. Champ and S.E. Rigdon (1992) “A Multivariate Exponentially Weighted Moving Average Control Chart”, Technometrics, vol. 34, 46¬53
9.Pan, X., and Jarrett, J.E. (2004) “Applying State Space to SPC: Monitoring Multivariate Time Series,” Journal of Applied Statistics, 31(4):397-418
10.Rungar, C.C. Barton, R.E., Del Castillo, E. and Woodall, W.H.
(2007) “Optimal Monitoring of Multivariate Data for Fault Patterns,” Journal of Quality Technology 39:159-172.
11.Lowry, C. A. & Montgomery, D. C. (1995) A Review of
Multivariate Control Charts. IIE Transactions,
12.Sullivan, J.H. and Woodall, W.H. (1996) “A Comparison of
Multivariate Quality Control Charts for Individual
Observations”, Journal of Quality Technology 28,(4):398-408
13.Djauhari, M.A. (2005) “Improved Monitoring of Multivariate
Process Variability,” Journal of Quality Technology, 39(1):32-39
14.Khoo, M.B.C., and Quah, S.H. (2003) “Multivariate Quality
Chart for Process Dispersion Based on Individual Observations,” Quality Engineering, 15(4):639-642 Kruegel, C. Valuer, F. and Vigna G. (2005) Intrusion Detection and Correlation, Challenges and Solutions, Springer Science + Business Media Inc. Boston
15.Ye, N. and Chen, Q. (2001) “An Anomaly Detection Technique
Based on a Chi Square Statistics for Detecting Intrusion into Information System,” Quality and Reliability Engineering, 17:105-112
16.Ye, N., Chen, Q. and Borror, C.M. (2004). “EWMA Forecast of
Normal System Activity for Computer Intrusion Detection, IEEE Transactions on Reliability, 53(4):557-566
17.Ye. N, Giardano, J. and Feldman, J. (2001). “A Process Control
Approach to Cyber Attack Detection,” Communication of the ACM, 44(8):76-82
18.Ye, N., Vilbert, S and Chen, Q (2003) Computer Intrusion
Detection through EWMA for Autocorrelated and Uncorrelated Data,” IEEE Transactions on Reliability, 52(1):75-82
19.Bersimis, S., Psarakis, S. and Paneretos, J. (2006) “Multivariate
likelihood¬ratio¬based EWMA control chart for monitoring variability of multivariate normal processes.” IIE Transactions 36 (9):865-879.
21.Yang, S.F. and Rahim, R.A. (2005) “Economic Statistical Process
Control for Multivariate Quality Characteristics under Weibull shock model,” International Journal of Production Economics, 98: 215-226
22.Jarrett, J.E. and Pan, X. (2007a) “The Quality Control Chart for
Monitoring Multivariate Autocorrelated Processes,”
Computational Statistics and Data Analysis, 51:3861-3870
23.Jarrett, J.E. and Pan, X. (2007b) “Using Vector Autoregressive
Residuals to Monitor Multivariate Processes in the Presence of Serial Correlation” International Journal of Production Economics, 106:204-216.
24.Zhang,L, Zhonghua, L. and Zhaojun, W. (2010)“A multivariate
control chart for simultaneously monitoring process mean and variability,” Computational Statistics & Data Analysis, 54(10): 2244-2252; doi: 10.1016/j.csda.2010.03.027
25.Pan X., Jarrett J.E. (2014) “The Multivariate EWMA Model and
Health Care Monitoring,” International Journalof Econoimics
and Management Sciences 3(2):176.
doi:10.4172/2162-6359.1000176
26.Crowder, S.V. (1989) “Design of Exponentially Weighted Moving
Average Schemes,” Journal of Quality Technology, 21(2):155-162
Moving Average Control Schemes: Properties and
Enhancements”, Technometrics, 32:1-12.
28.Pan, X. (2005) “An Alternative Approach to Multivariate EWMA
Chart,” Journal of Applied Statistics, 32:695-705
29.Lui, Y. (1996) “An improvement for MEWMA in Multivariate
process Control”, Computers & Industrial Engineering 31:779-781
30.Runger, G.C. and S.S. Prabhu (1996) “A Markov Chain Model for
the Multivariate Exponentially Weighted Moving Averages Control Chart,” Journal of American Statistical Association, 91: 1701-1706
31.Prabhu, S.S. and Runger, G.C. (1997) “Designing a Multivariate
EWMA Control Chart,” Journal of Quality Technology, 29:213-224
32.Stoumbus, Z. and Sullivan, J.H. (2002) “Robustness to
non¬normality of the multivariate EWMA Control Chart,” Journal of Quality Technology, 34(3):260-276
33.Hanson, L., Eskridge, K.M., Steadman, J.R. and Madisa, G.
(2009) “The Sensitivity Ratio: A Superior Method to Compare Plant and Pathogen Screening Tests,” Crop Science, 49:153-160.
34.Väisänen, and J. Hyttinen J. (2007) “Region of Interest
Sensitivity Ratio in Analyzing Sensitivity Distributions of Electrocardiographic Measurements,” Annals of Biomedical Engineering 37(4):1573-9686.
35.Alwan, B.M., and Roberts, H.V. (1988). “Time¬Series Modeling