DEVELOPMENT OF A PROTOCOL TO MEASURE GENE EXPRESSION IN THE MOUSE TIBIA
A Senior Project presented to
the Faculty of Biomedical and General Engineering Department California Polytechnic State University,
San Luis Obispo
In Partial Fulfillment
of the Requirements for the Degree Bachelor of Science in Biomedical Engineering
PROJECT INFORMATION
TITLE: DEVELOPMENT OF A PROTOCOL TO MEASURE
GENE EXPRESSION IN THE MOUSE TIBIA
AUTHOR: Daniel Hoover
DATE SUBMITTED: June 2012
ABSTRACT
DEVELOPMENT OF A PROTOCOL TO MEASURE GENE EXPRESSION IN THE MOUSE TIBIA
Daniel Hoover
Numerous molecular factors active in bone tissue direct fracture repair and remodeling which can be altered by disease conditions such as Peripheral Arterial Disease (PAD) and Osteoporosis. Methods of molecular biology are commonly applied to investigate the expression and role of these molecular factors. This project presents a robust three-step protocol for examining gene expression in the mouse tibia. The protocol begins with isolating RNA from a flash frozen tibia sample. The isolated RNA is reverse transcribed into cDNA. Finally, PCR is performed to indentify expressed genes. Establishing this protocol will allow further research into the mechanisms of bone remodeling and repair. For example, this approach can be used to examine the relationship between osteocyte apoptosis and angiogenesis in bone tissue, with applications to ischemic conditions and osteoporosis.
ACKNOWLEDGEMENTS
Dr. Trevor Cardinal – for introducing me to research, advising me during this project, and providing wise counsel regarding academics and career.
Andrew Tilton – for providing much needed help with all things mol bio.
Tyler Smith, Josh Cutts, Paul Heckler – for being “on-call” to extract tibiae.
Hannah Forbes Project Fund – for funding this senior project.
TABLE OF CONTENTS
Section Page
I Introduction ________________________________________________________ 1
Project Goal _______________________________________________________________ 1 Background: Osteoporosis and PAD ___________________________________________ 1 Osteoporosis ________________________________________________________ 1 Peripheral Arterial Disease (PAD) _______________________________________ 7 Link Between PAD and Osteoporosis ____________________________________ 7 Background: Genes of interest:________________________________________________ 8 Project Plan _______________________________________________________________ 10 II Methods __________________________________________________________ 12
Methods Overview _________________________________________________________ 12 Methods Observed _________________________________________________________ 12 III Results __________________________________________________________ 16
IV Discussion _______________________________________________________ 19
Success of Methodology _____________________________________________________ 19 Potential Improvements _____________________________________________________ 19 Future Research ___________________________________________________________ 20 V References ________________________________________________________ 21
VI Appendix A: Protocols ______________________________________________ 24
Bone RNA Isolation Qiagen Mini Lipid Tissue Kit _______________________________ 24 Reverse Transcription Agilent AffinityScript Kit ________________________________ 25 Gel Electrophoresis and Spectrophotometry ____________________________________ 26 Design and Order Primers __________________________________________________ 27 VII Appendix B: Experimental Setup ____________________________________ 28
LIST OF FIGURES
Figure Page
Figure 1 - Histology of Osseous Tissue 1... 3
Figure 2 - Cell Types and Their Roles in Bone Remodeling 5. ... 4
Figure 3 - Diagram of Remodeling in Cortical Bone 5. ... 5
Figure 4 - Photomicrograph of Remodeling in Cortical Bone 5. ... 5
Figure 5 - Diagram of Remodeling in Trabecular Bone 5. ... 5
Figure 6 - Photomicrograph of Remodeling in Trabecular Bone 5. ... 6
Figure 7 - Quality RNA.Results ... 16
Figure 8 - PCR Results. ... 17
Figure 9 - BioSpec Pulverizer (left) and Tissue Tearor (right). ... 28
Figure 10 - Nanodrop spectrophotometer for assaying RNA concentration and purity. .. 28
Figure 11 - Gel electrophoresis apparatus. ... 28
LIST OF TABLES
Table Page
Table 1 - Signal factor molecules related to Osteoporosis, PAD, and fracture healing. .... 9
Table 2 - Tibia Extraction Overview ... 12
Table 3 - RNA Isolation Overview ... 13
Table 4 - Reverse Transcription Overview ... 13
Table 5 - Thermocycler Protocol Design ... 14
Table 6 - PCR Overview ... 14
Table 7 - Gel Electrophoresis Overview ... 15
Table 8 - Primers ... 17
I Introduction
Project Goal
The purpose of this project was to develop a method for studying gene expression in mouse tibiae. Specifically, a protocol for analyzing gene expression of the mouse tibia was needed to pioneer a new area of research into the molecular factors governing osteocyte behavior under disease conditions such as PAD or Osteoporosis. This protocol was built on a collection of established methods and required a quarter of
experimentation designed to adjust the existing protocols to overcome specific difficulties associated with bone tissue. A reliable and accurate method of studying gene expression in the mouse tibia was created to ensure that molecular biology continues to complement ongoing research into angiogenesis and bone microcirculation. Bone-vasculature
interactions are many and manifold, but the immediate areas of application of this project are to the pathologies of Peripheral Arterial Disease (PAD) and Osteoporosis.
Background: Osteoporosis and PAD
Osteoporosis
Overview of Osteoporosis
independence, impaired ambulation, depression, and nursing home admission that often follow 7. Biologically, osteoporosis has several characteristics. First, there is an overall decrease in bone density resulting in weaker bone. Second, osteocytes suffer a loss of viability. Osteocyte function is critical for bone health and their deterioration has a serious impact on bone remodeling and bone composition regulation 1. Third, in cancellous bone, osteoporosis results in fewer, narrower trabeculae that are no longer interconnected in the strong lattice framework of healthy bone 2.
Normal Bone Structure
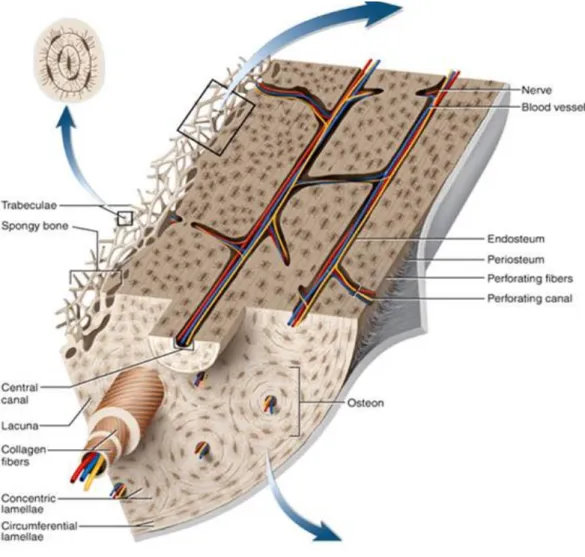
Two types of bone tissue are present in the human body: cortical or compact bone, and cancellous or trabecular bone. The basic structural unit of compact bone is the
Figure 1 - Histology of Osseous Tissue 1.
Normal Bone Remodeling
Bone remodeling is both a normal response to changing stress conditions and a standard repair mechanism to compensate for daily wear. Remodeling is initiated by osteocytes responding to their environment 2. Osteocytes perceive stresses and strains that correspond to microcracks in the bone, and release signaling factors that trigger
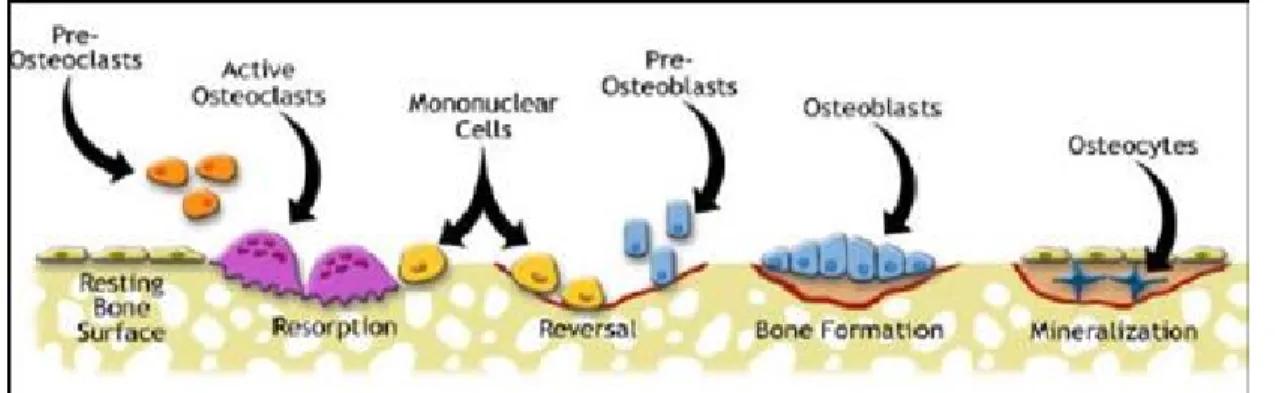
remodeling. In damaged or growing regions, bone endothelium recruits osteoclasts using the RANKL/OPG system which will be discussed in more detail later 2, 3. Bone
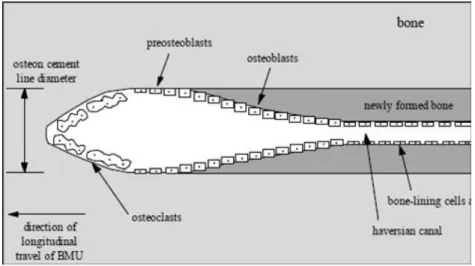
osteoclasts, osteoblasts, and osteocytes 3. Osteoclasts function to resorb old or damaged bone (see Figure 2). They produce VEGF for the early stages of remodeling, which acts in a variety of capacities to encourage remodeling 3. Osteoblasts deposit new bone (see Figure 2). Remodeling occurs in cycles beginning with resorption by the osteoclasts and ending with osteoblast deposition of fresh bone. In normal cancellous bone, remodeling takes place on the surface of the trabeculae with an average cycle duration of 200 days (see Figures 5 and 6 below). Resorption occurs relatively quickly, in 30-40 days, while bone formation occurs over a period of 150 days 3. In cortical bone, osteoclasts travel in resorbing “cutting cones” and are directly followed by osteoblasts that refill the
resorption cavity with new bone as shown in Figures 3 and 4 below. The remodeling cycle in cortical bone is shorter than the remodeling cycle in trabecular bone; in cortical bone, it has a median length of 120 days 3, 4.
Figure 3 – Diagram of Remodeling in Cortical Bone 5.
Figure 4 – Photomicrograph of Remodeling in Cortical Bone 5.
Figure 6 – Photomicrograph of Remodeling in Trabecular Bone 5.
Osteoporotic Bone Remodeling and Treatments
Peripheral Arterial Disease (PAD)
Peripheral arterial disease (PAD) is a serious chronic condition of the vasculature. Blood vessels are occluded by atherosclerotic plaques, impairing blood circulation. The disease’s effects are most noticeable in the extremities; in the early stages, PAD causes claudication: intermittent pain during ambulation. In the late stages, PAD progresses to ischemic ulceration and gangrene ultimately resulting in amputation in 30 percent of cases 11. Plaques are formed over time by the accumulation of ox-LDL, oxidized low density lipoprotein, in the subendothelial space 2. The body responds with acute dilation of collateral vessels to redirect some of the blocked flow. When PAD persists, the chronic response of the vasculature is to remodel itself to provide less collateral resistance. The end result however is an exhaustion of the vasculature’s ability to compensate and a severe reduction in the body’s vasodilation and vessel repair capacity 2.
Link Between PAD and Osteoporosis
The conception of a link between these two pathologies is fascinating and compelling for several reasons. The diseases share common risk factors such as older age, physical inactivity, smoking, and diabetes mellitus 12. The intermittent claudication of PAD restricts physical activity and results in less mechanical stimulation of the bone and less impetus for remodeling 2. PAD often occurs concurrent with low bone mineral density (BMD). Decreases in bone formation and overall bone mass have been previously linked to deficiencies in the vasculature network and PAD-affected vasculature is
The potential for PAD and osteoporosis interaction exists because they share the same biological pathways and similar marker molecules 12. In order for bone regeneration to take place, angiogenesis must occur to some degree. PAD affected vasculature is impaired in its ability to undergo both angiogenesis and arteriogenesis. Thus, PAD’s adverse affects on bone remodeling may contribute to osteoporosis. There may exist a specific connection centering on the relationship between osteoprotegerin (OPG), RANK, and RANKL 2. These three molecules work together to regulate remodeling. The excess osteoclast activity of osteoporosis stimulates OPG production to suppress that osteoclast activity. The increase in OPG also disrupts the RANK / RANKL interaction that
ordinarily stimulates angiogenesis, leading to a potential lack of the angiogenesis that ordinarily should accompany bone remodeling 2. Finally, both disease states are vitamin D deficient and vitamin D therapy has been very successful in patients with PAD and osteoporosis 2, 12. The reason for these successes could be the general physical inactivity of patients suffering from each disease. Physical inactivity is common associated with a lack of vitamin D absorption from the sun. In conclusion, although there is more
correlation than causal evidence at present, this hypothesized relationship between PAD and osteoporosis is well worth exploring.
Background: Genes of interest:
expression of these and similar factors under different experimental conditions will advance the current knowledge of molecular mechanisms in bone.
Table 1 - Signal factor molecules related to Osteoporosis, PAD, and fracture healing.
Signal Factor / Molecule Functions
Cytokines (TNF-α)
IL-1, IL-6, TNF-α
Cytokines contribute to osteoclast activation and bone resorption 2. TNF-α stimulates OPG production to suppress osteoclast activity 2. They are expressed at high levels during days 1 through 3 of bone remodeling. Cytokines increase extracellular matrix synthesis and attracts other inflammatory cells. They promote angiogenesis as well as bone resorption 15.
TGF-β (TGFβ-1)
Transforming Growth Factor Beta Superfamily
The factors of the TGF-β superfamily are key regulators of bone development and repair 14. They target mesenchymal stem cells and osteoprogenitors and incite cell proliferation of bone forming cells. TGF-β increases the density of the extracellular matrix (ECM) and is released throughout fracture healing process 15.
BMPs (BMP2)
Bone Morphogenetic Proteins
BMPs promote differentiation of mesenchymal cells into chondrocytes and osteoblasts, and
osteoprogenitors into osteoblasts 15. In addition, they may stimulate VEGF synthesis 15. Their expression during fracture healing takes many patterns.
VEGFs (VEGFa)
Vascular Endothelial Growth Factors
The degree of collateral arteriogenesis depends on the extent of VEGF and VEGF-A gene expression 2. For angiogenesis, VEGF incites proliferation and differentiation of endothelial cells (ECs). The higher the concentration of VEGF, the more EC
proliferation and differentiation. VEGF also stimulates EC proliferation during endochondral formation in the case of fracture 15. It can increase the rate of fracture repair when administered
exogenously 20.
Angiopoietins (Ang1 & Ang2) The angiopoietins affect the development of larger
Project Plan
As alluded to previously, the behavior of a tissue can be characterized to some extent by studying the gene expression of its cells. In this case, the protocol was created to analyze those signaling factors and molecules active in bone tissue by studying the gene expression of the bone cells. These bone cells contain genetic code in the form of DNA that is capable of encoding the factors of interest upon activation. The actual expression of a gene depends on the input the cell is receiving at that point in time. If the cell is triggered to produce a given factor by external stimuli, then it will transcribe messenger RNA from the DNA that codes that factor. The messenger RNA will be translated by ribosomes that assemble the protein or enzyme of interest. The point at which molecular biologists often intervene is after the DNA has transcribed mRNA. The protocol presented here begins with the isolation of mRNA from the bone cells.
traveled during electrophoresis. If an amplicon was present for a given gene, then that gene was being expressed, encoding mRNA to produce a certain protein or enzyme by translation.
RNA is difficult to extract from highly mineralized bone matrix but special reagents such as QIAzol make extraction possible. The contingency plan, if the Qiagen reagents failed, was to use a Trizol two step method of RNA isolation.
II Methods
Methods Overview
Each tibiae was surgically extracted from the mouse and frozen for storage to prevent degradation. RNA isolations were performed on the frozen samples. RNA quality was tested via nanodrop spectrophotometry. If the sample contained quality RNA, it was reverse transcribed to make cDNA. Finally, cDNA was used as the starting material for PCR and selected primers were added. The PCR products were visualized on an
electrophoresis tray under UV light.
Methods
The tibia sample was taken from a mouse specimen during surgery. IACUC guidelines were strictly observed and the animal remained anesthetized. After exposing the tibia, bone scissors were used to extract the tibia sample. The dissected sample was frozen to inactivate RNases and preserve the tissue. See Table 2 for an overview of this procedure.
Table 2 - Tibia Extraction Overview
Starting Material: Mouse specimen
Ending Product: Frozen 50 mg mouse tibia sample
Reagents: -
Equipment: Bone scissors, test tube
centrifuge tube containing Qiazol solution. The sample was disrupted and homogenized under the fume hood using the Tissue Tearor. In the fume hood, chloroform was added to the lysate, the tube was vortexed thoroughly, and the solution was incubated, centrifuged, and separated. A series of washes and centrifugations purified the RNA in a Qiagen spin column. The RNA was eluted with the addition of RNase-free water and an absorbance reading was taken using the nanodrop spectrophotometer to assay RNA concentration. See Table 3 for an overview of this procedure.
Table 3 - RNA Isolation Overview
Starting Material: Frozen 50 mg mouse tibia sample
Ending Product: Purified RNA
Reagents: RNeasy Mini Tissue Kit (Qiagen #74104), QIAzol (Qiagen #79306),
liquid nitrogen, β-mercaptoethanol
Equipment:
BioSpec Biopulverizer, BioSpec Tissue Tearor, forceps, heating block, centrifuge, liquid nitrogen container, ice bucket, RNase Zap wipes, micropipettes, Nanodrop spectrophotometer
To begin the process of reverse transcription, all solutions were thawed, vortexed, and centrifuged. RNA samples and oligo(dT) primers were added and the reaction was incubated in the thermocycler. The remaining reagents were added. The reaction was completed in the thermocycler and the product cDNA was stored at -20°C for future PCR. See Table 4 for an overview of this procedure.
Table 4 - Reverse Transcription Overview
Starting Material: Purified Quality RNA
Ending Product: cDNA
Reagents: AffinityScript Multiple Temperature cDNA Synthesis RT Kit
(Agilent #200436)
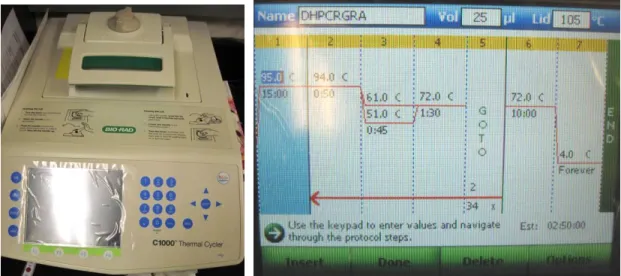
Following cDNA synthesis, PCR was performed using primers designed for genes of interest. A master mix was prepared containing all the components necessary for PCR except template cDNA and primers: 10x PCR Buffer, dNTP mix, HotStarTaq DNA Polymerase, and RNase-free water. Template cDNA was added to the mix, which was then divided among PCR tubes; the primers were added in forward and reverse pairs. PCR was performed in the thermocycler, following a cycling protocol similar to the one in Table 5, but adjusted to be primer specific. After the PCR reaction completed, the products were analyzed by electrophoresis. See Table 6 for an overview of the entire PCR procedure.
Table 5 - Thermocycler Protocol Design
Initial Activation Step: 15 min 95°C HotStarTaq DNA Polymerase
requires this heating to activate.
3-st
ep
c
yc
le Denaturation: 0.5-1 min 94°C
Annealing: 0.5-1 min 50-68°C Aim 5°C below Tm of primers.
Extension: 1 min 72°C
# of Cycles: 35
Final Extension: 10 min 72°C
Table 6 - PCR Overview
Starting Material: cDNA
Ending Product: Primer-selected amplified cDNA
Reagents: HotStarTaq DNA Polymerase Kit (Qiagen #203203), dNTPs,
forward and reverse PCR primers (IDT)
The gel electrophoresis visualized the amplified cDNA products of PCR. An agarose gel was prepared with ethidium bromide. Loading dye was mixed with each PCR product and with the standard ladder. The samples were loaded into the gel matrix. After electrophoresis, the finished gel matrix was imaged under UV light. By comparing the fluorescent bands present in the PCR product lanes to the standard ladder markings, the primer-selected genes (if they were present) were identified. See Table 7 for an overview of this procedure.
Table 7 - Gel Electrophoresis Overview
Starting Material: Primer-selected amplified cDNA
Ending Product: Visualized and identified cDNA: gene expression data
Reagents: Loading dye, standard ladder, agarose, ethidium bromide, TAE
buffer
Equipment:
IIIResults
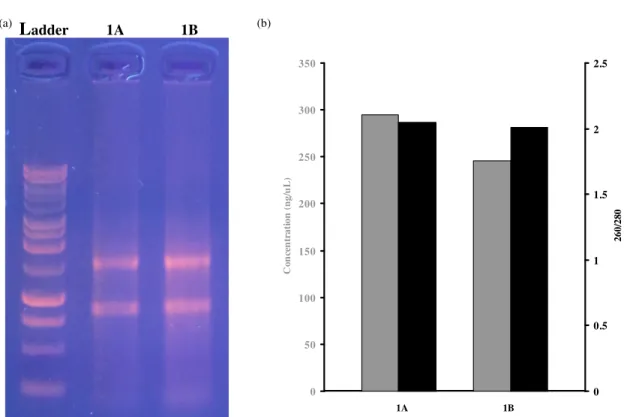
Figure 7 - (a) Quality RNA imaged via gel electrophoresis. Left: standard ladder. Middle: sample 1A. Right: sample 1B. (b) Column graph of RNA concentration (ng/µµµµL) and RNA purity (A260/280).
Figure 7a is an image of two quality RNA samples obtained using the tibia isolation protocol. Both samples displayed the crisp 18S and 28S bands indicative of a quality RNA isolate. In theory, the 28S band should be approximately twice as bright as the 18S band. For both samples, the 28S band is brighter than the 18S band as expected, but without using an alternate technique, the brightness could not be measured
quantitatively. Figure 7b is a graph of each samples’ nucleic acid concentration and 260/280 ratio as measured with the nanodrop spectrophotometer. The concentration was
(a) (b)
Ladder 1A 1B
0 50 100 150 200 250 300 350
1A 1B
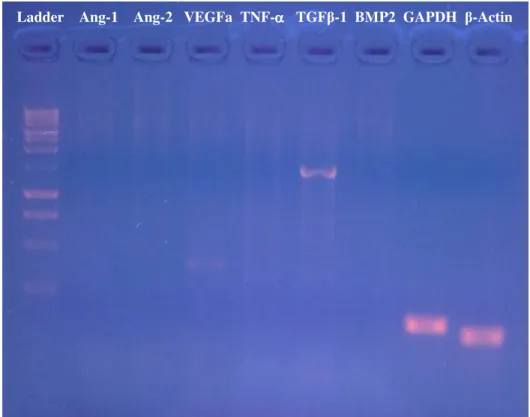
Figure 8 - PCR amplicons using cDNA reverse transcribed from RNA isolate 1B.
Table 8 - Primers
Gene 5’ F Primer 3’ 5’ R Primer 3’ Tm
Ang-1 CCAGAGAATGCCACTCACAATC CAACCACCACAATCACCAGAAT 62.0°C
Ang-2 CGGAAACTGACTGATGTGGAAG ATTCCAGAGATGTGGGCATTTT 61.9°C
VEGFa AAGCCTGACATGAAGGAAGAGG CACCGATCTGGGAGAGAGAGAT 62.0°C
TNF-α ACATTGACAGGTCCAGCAAGAA AAGCACACAGAAAAGCTGCAAG 62.0°C
TGFβ-1 AAGTCAGAGACGTGGGGACTTC CTTCTCTGTGGAGCTGAAGCAA 62.0°C
BMP2 TGCCCCCTAGTGCTTCTTAGAC CTTCATGTGCTGGAGTTGAACC 62.0°C
GAPDH TATGTCGTGGAGTCTACTGGTGTC AGTTGTCATATTTCTCGTGGTTCAC 56.0°C
β-Actin CTGACAGACTACCTCATGAAGATCC GTCTAGAGCAACATAGCACAGCTTC 58.0°C
Figure 8 above displays the successful results of a PCR performed on a sample of cDNA. The cDNA sample was prepared from “DH Tibia RNA 1B” shown in figure 7. The PCR was run using a temperature gradient 56-58°C. TGFβ-1 primers created a strong amplicon in lane 6 around 1400 base pairs, matching the expected product length of 1437 base pairs. GAPDH primers created a very strong amplicon in lane 8
IVDiscussion
Success of Methodology
The three stages of RNA isolation, reverse transcription, and PCR were completed successfully. For the RNA isolation, homogenizing the tissue and extracting RNA was the most difficult step. The Qiagen RNeasy mini kit protocol was not adapted for bone tissue and produced a low yield of RNA, but homogenizing the tibia in Qiazol reagent and separating with chloroform solved this problem. This approach yielded a high concentration of RNA and avoided degradation. Reverse transcription followed easily. PCR proved difficult at first, but optimizing annealing temperature and using previously validated primers eventually resulted in success. Future experiments now have a robust protocol for investigating gene expression in bone tissue.
Potential Improvements
The protocol has room for improvement, however. First, the PCR method employed only yields qualitative gene expression data. In order to assay the extent of mRNA transcription, quantitative real time PCR must be performed. Transitioning the existing protocol to real time PCR will not be difficult; the microcirculation lab already uses real time PCR for other molecular biology applications. A second need for
improvement is to handpick osteocyte gene targets of interest and optimize these primers. The primers used in this proof-of-concept study were chosen broadly to look for
gene targets of interest. The proper annealing temperatures for these primers will need to be established through primer optimization.
Future Research
Future research will focus on the connections between osteocyte gene expression, angiogenesis, bone remodeling, and osteoporosis. Osteocyte apoptosis is known to stimulate angiogenesis, presumably by releasing molecular signaling factors. The microcirculation lab plans to examine the angiogenic factors produced by osteocyte apoptosis in bone stimulated by axial loading. This is an appropriate follow on to current work studying the effects of mechanical stimulus induced osteocyte apoptosis on vascular and mechanical properties of bone tissue. A second potential application for the
V References
1. Saladin, Ken. Anatomy & Physiology: The Unity of Form and Function. New York, NY: McGraw-Hill, 2007.
2. Govea, Mike. “Thesis: Vascular and Mechanical Changes in Bone in Response to Chronic Ischemia and Mechanical Loading.” Diss. Cal Poly, SLO, 2011. <http://digitalcommons.calpoly.edu/theses/637/>
3. Eriksen, Erik F. “Cellular mechanisms of bone remodeling.” Rev Endocr Metab Disord
11. 2010: 219-227. 2 Dec. 2011
<http://www.springerlink.com/content/e1rgk282m0344636/>.
4. Agerbaek. “A reconstruction of the remodeling cycle in normal human cortical iliac bone.” Bone and mineral 12.2 1991: 101-112.
5. Hazelwood, Scott. “Simulating Bone Remodeling - BMED 430.” Cal Poly, SLO, Cal Poly, SLO Rm. 53-251. 20 Sept. 2011.
6. Gauthier et al.,. “Development and validation of a disease model for postmenopausal osteoporosis.” Osteoporosis Int 22. 2011: 771-780. 2 Dec. 2011
<http://www.springerlink.com/content/kk50v7721p12637j/>.
7. Navarro et al.,. “Poverty is a risk factor for osteoporotic fractures.” Osteoporos Int 20. 2009: 393-98. 2 Dec. 2011
<http://www.springerlink.com/content/ax35k30w753tn678/>.
8. Compston. “Treatments for Osteoporosis - Looking beyond the HORIZON.” The new
england journal of medicine 356.18 3 May 2007: 1878-80. 2 Dec. 2011
9. Raisz, Lawrence G. “Pathogenesis of osteoporosis: concepts, conflicts, and prospects.”
The Journal of Clinical Investigation 115.12 Dec. 2005: 3318-25. 2 Dec. 2011
<http://www.ncbi.nlm.nih.gov/pmc/articles/PMC1297264/>.
10. Meunier et al.,. “The Effects of Strontium Ranelate on the Risk of Vertebral Fracture in Women with Postmenopausal Osteoporosis.” The New England Journal of
Medicine 350.5 29 Jan. 2004: 459-68. 2 Dec. 2011
<http://www.nejm.org/doi/full/10.1056/NEJMoa022436>.
11. Ouriel, Kenneth. “Peripheral arterial disease.” The Lancet 358. 13 Oct. 2001: 1257-64. 2 Dec. 2011
<http://www.sciencedirect.com/science/article/pii/S0140673601063516>. 12. Collins et al,. “Peripheral Arterial Disease Is Associated With Higher Rates of Hip
Bone Loss and Increased Fracture Risk in Older Men.” Circulation 119. 20 Apr. 2009: 2305-2312. American Heart Association. 2 Dec. 2011
<http://circ.ahajournals.org/cgi/content/full/119/17/2305>.
13. Tsiridis et al,. “Molecular aspects of fracture healing: Which are the important molecules?.” Injury 38S1. 2007: S11-S25. 2 Dec. 2011
<http://www.sciencedirect.com/science/article/pii/S0020138307000551>. 14. Sandberg et al.,. “Gene Expression During Bone Repair.” Clinical Othopaedics and
Related Research 289 1993: 292-312.
Model Mechanobiol 10 9 Sept. 2010: 383-395. 2 Dec. 2011 <http://www.springerlink.com/content/15hgu7r365x64012/>.
16 Malizos, Konstantinos N and Loukia K. Papatheodorou. “The healing potential of the periosteum.” Injury 36S. 25 July 2005: S13-S19. 2 Dec. 2011
<http://www.sciencedirect.com/science/article/pii/S002013830500286X>. 17. Al-Aql et al,. “Molecular Mechanisms Controlling Bone Formation during Fracture
Healing and Distraction Osteogenesis.” Journal of Dental Research 87.2 2008: 107-118. 2 Dec. 2011 <http://jdr.sagepub.com/content/87/2/107>
18. Yao et al.,. “Increase of Both Angiogenesis and Bone Mass in Response to Exercise Depends on VEGF.” JOURNAL OF BONE AND MINERAL RESEARCH 19.9 2 June 2004: 1471-80. American Society for Bone and Mineral Research. 2 Dec. 2011
<http://onlinelibrary.wiley.com/doi/10.1359/JBMR.040517/abstract;jsessionid=73 8658CA3CC0F5C83FC08C419226B95E.d01t01?>.
19. Brandi, Maria and Patricia Collin-Osdoby. “Vascular Biology and the Skeleton.”
JOURNAL OF BONE AND MINERAL RESEARCH 21.2 3 Oct. 2005: 183-192.
American Society for Bone and Mineral Research. 2 Dec. 2011
<http://onlinelibrary.wiley.com/doi/10.1359/JBMR.050917/abstract?>.
20. Street et al,. “Vascular endothelial growth factor stimulates bone repair by promoting angiogenesis and bone turnover.” pnas.org 99.15 23 July 2002: 9656-9661. 2 Dec. 2011 <http://www.pnas.org/content/99/15/9656.full>.
VI Appendix A: Protocols
VII Appendix B: Experimental Setup
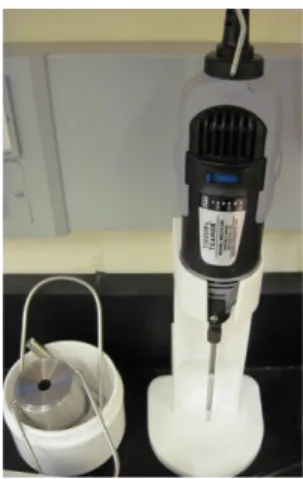
RNA Isolation Equipment
Figure 9 - BioSpec Pulverizer (left) and Tissue Tearor (right).
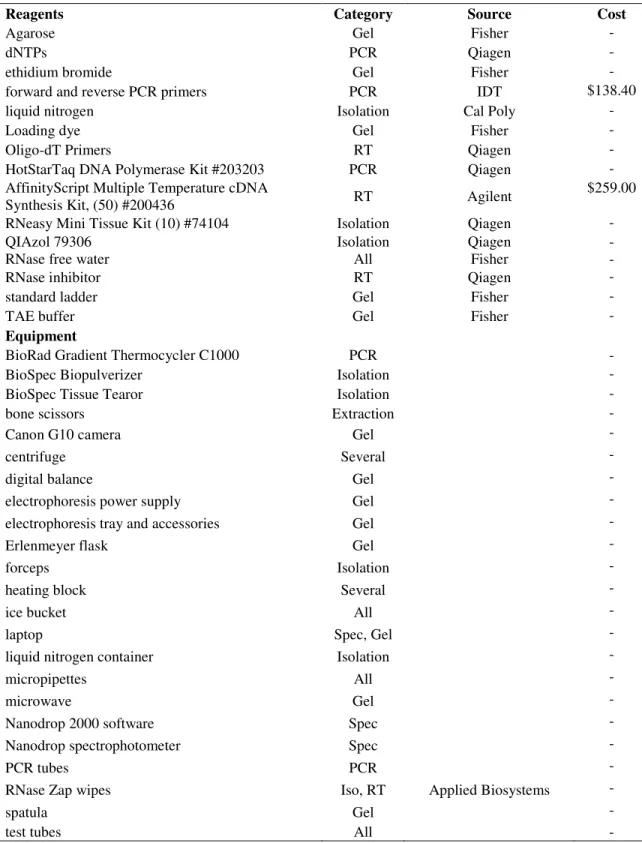
Comprehensive Reagents/Equipment List
Table 9 - Reagents/Equipment List
Reagents Category Source Cost
Agarose Gel Fisher -
dNTPs PCR Qiagen -
ethidium bromide Gel Fisher -
forward and reverse PCR primers PCR IDT $138.40
liquid nitrogen Isolation Cal Poly -
Loading dye Gel Fisher -
Oligo-dT Primers RT Qiagen -
HotStarTaq DNA Polymerase Kit #203203 PCR Qiagen - AffinityScript Multiple Temperature cDNA
Synthesis Kit, (50) #200436 RT Agilent
$259.00
RNeasy Mini Tissue Kit (10) #74104 Isolation Qiagen -
QIAzol 79306 Isolation Qiagen -
RNase free water All Fisher -
RNase inhibitor RT Qiagen -
standard ladder Gel Fisher -
TAE buffer Gel Fisher -
Equipment
BioRad Gradient Thermocycler C1000 PCR -
BioSpec Biopulverizer Isolation -
BioSpec Tissue Tearor Isolation -
bone scissors Extraction -
Canon G10 camera Gel -
centrifuge Several -
digital balance Gel -
electrophoresis power supply Gel -
electrophoresis tray and accessories Gel -
Erlenmeyer flask Gel -
forceps Isolation -
heating block Several -
ice bucket All -
laptop Spec, Gel -
liquid nitrogen container Isolation -
micropipettes All -
microwave Gel -
Nanodrop 2000 software Spec -