Interactive Data Validation and Data Preprocessing of
Contactless Medical Devices
By
Vikram Aikat
Senior Honors Thesis
Computer Science
University of North Carolina at Chapel Hill
April 9th, 2020
Approved:
___________________
Kevin Jeffay, Thesis Advisor
Section 1: Introduction
Patients of chronic diseases often prefer to deal with their ailments in their own home, rather than in a hospital environment. This makes it difficult to accurately monitor their condition, thus motivating the use of smart devices. Smart devices can help users better understand their health and give physicians reliable metrics of their patient’s condition while allowing monitoring outside the hospital setting. In the age of IOT (Internet of Things), we can leverage constant device communication technology and apply it to in-home monitoring. When self-monitoring, it is difficult for patients to give a fully accurate assessment of their condition. Hence, when working with their doctors, they are often limited to sharing qualitative
information. With an appropriate IOT-based measurement system, a patient could give their doctor quantitative measurements describing the state of their ailment.
Many current popular devices such as Fitbit and Apple Watch continuously monitor movement and activity, but they are primarily marketed towards individuals aiming for fitness improvements, and not those with chronic medical conditions. For people with chronic
conditions, or elderly individuals, having to use a wearable can be obstructive and annoying. Furthermore, when trying to study patient motion or behavior, the use of the wearable can impact their actions due to the burden of having to wear the device. Thus, there is a need for a
WiTrack and the Emerald Device
At the Katabi lab at MIT they have created WiTrack and the Emerald Device, which works to solve this exact problem [15]. The Emerald Device, the size of a small poster, is a wall mounted system which utilizes WiFi reflections to observe movement in a room. Similar to how a camera is able to get a picture of a room through RGB reflections of light, this device does so through RF signal reflections. The Emerald Device is wall mounted to allow for the best view of the space that it is tracking. Ideally, the device is positioned where the nearby area is clear of large furniture or moving doors. Due to its use of RF signals, it can see through walls with a wide range of view, making it useful for both in home applications as well as in hospital settings. This device also works independent of lighting conditions, allowing for accurate measurement during night time or when the patient is sleeping. When conducting studies concentrated on sleep or night time analysis, the device should be positioned perpendicular to the bed in the patient’s room, ensuring maximal signal when the patient is sleeping.
WiTrack is the software that analyzes and interprets these wireless signals received from the Emerald Device. The WiTrack system is built on machine learning models that interpret the heat maps of reflection received by the Emerald device as human action and movement. The training of these models requires ground truth labels, which are collected by a camera. Once the models are effectively trained and tested, the camera is no longer needed.
they stay. In the past, the placement of the tracking devices has mostly been done by students of the Katabi Lab, who are trained to understand effective device placement and have intuition for where to place the device for effective signal collection. In order to expand usage of this
technology, future deployments must be made by nurses, doctors, or even by the patients themselves. The current method, in which the patient follows written instructions on how to set up the device, is a potentially highly error prone process. An additional complication is that the data from a particular home may often not be analyzed for weeks. This is because analysis of the data and training of machine learning models is done only once sufficient data has been
collected.
Thesis Contributions
In this thesis, I present two systems that will be used in tandem to help with data validation for WiTrack, one to assist in short term validation of device functionality and one to assist in long term preprocessing of data from the device. These systems have the long term goal of being used to assist a study of scratching behavior in psoriasis patients at Washington
University at St. Louis. In that study, twenty patients will be monitored four nights a week to create a robust model for classifying scratching actions in these patients. These patients have a serious, chronic skin condition with no known cure. Because of this, they often have trouble sleeping due to scratching or they scratch during their sleep.
well-positioned camera for this scratching study will be focused on the bed, with the rest of the room also in the field of view. A poorly positioned camera would return obscured or useless information. The positioning of the camera is important as its images provide ground truth data for labeling the sleep of the patients as scratching or not scratching. So both the camera image and the tracking from the device must be accurate for the experiment to be successful. Thus, we now need to be able to validate that someone without prior knowledge of the system and its technology can deploy it correctly. Proper validation would confirm that the deployment was of the same standard as if a student in the Katabi Lab were deploying the device. This validation would also include ensuring that the data being streamed from the device is of sufficient quality and makes sense in the context of the study.
In this paper, I present the Interactive Validation System, a phone app that I developed to be used by a lay-person while deploying the device. This system was built on a previous
non-functional app developed in the lab. Through a series of tests and instructions, the person deploying the Emerald Device may use this system to validate the camera positioning as well as the data being streamed from the Emerald Device. This will ensure that the deployment is successful even when there is no expert doing the deployment.
Section 2: WiTrack Background
The usage of radio frequency (RF) signals has multiple useful advantages over visible light. When trying to record RGB videos of human action and behavior, low light and physical obstructions can completely occlude the image. RF signals can simultaneously capture
information through reflection in the low light environments and penetrate through many materials. This is because RF signals are highly reflective electromagnetic waves of greater wavelength than visible light. While this reflection is effective for its penetration and reflective purposes, very fine grain roughness on a surface will appear smooth from RF signal. This means that an RF sensor can see through rooms, even at night, which makes it the perfect candidate for in-home monitoring. A sensor that can emit RF signals using the reflections to map out a room could then be used to create snapshots of the room. Over time, these successive snapshots are effectively a video that can be analyzed to look for human movement and action.
The Emerald Device built by the NETMIT group at MIT was created for this exact application. The majority of signal received by the device will be due to human bodies in the room. This is due to the signal attenuation that occurs due to the material make up of the human body. Furthermore, the majority of these signals relating to the human body will be due to the torso, which is the largest and most consistent portion of the human body for reflection [6].
WiTrack improves heavily on other existing RF tracking techniques and does not require an excessive amount of calibration, emitters or receivers. Previous systems utilized Doppler shift of the RF signals to locate people, whereas WiTrack takes advantage of time of flight
being tracked. To get this time of flight measurement, WiTrack uses Frequency Modulated Carrier Waves (FMCW) [6]. RF signals travel at the speed of light, so objects close together will have nearly identical measurements. Using FMCW allows WiTrack to transform changes in time of flight to changes in wave frequency. This is because the FMCW has a signal whose carrier frequency can be mapped linearly with time. The differences between these frequencies are easier to interpret than differences in time of flight. The Emerald Device contains two antenna arrays, one horizontal and one vertical to collect these signals. This allows the system to capture angular data based on which antenna in the array detects the signal, as well as spatial data from time of flight [6].
Figure 1: Example of a Heatmap from the Emerald Device
Previous Work using WiTrack Data
Further analysis done by the Katabi Lab uses these heatmaps in machine learning models with convolutional neural networks, treating the previous signal processing problem as a
computer vision task. Due to a combination of limited labeled data and the timescale of this thesis, no machine learning methods are used in this thesis. Instead, a combination of heuristics and optimization techniques are used to analyze the heatmaps.
not change over time, WiTrack is able to eliminate new signals that appear to come from these sources as they are more likely to be due to multipath. The system also uses successive
subtraction between frames of data, which further eliminates the effect that multipath and static signals have on the final heatmap analysis. This ensures that a resulting RF video only shows movement over time from consistently reflective surfaces, such as the human body. This
previous work allows us to ignore much of the multipath effect on our heatmap analysis, even to the point of analyzing small signals such as breathing [17]. While there may be stray reflections, it is unlikely any high power reflections are due to multipath.
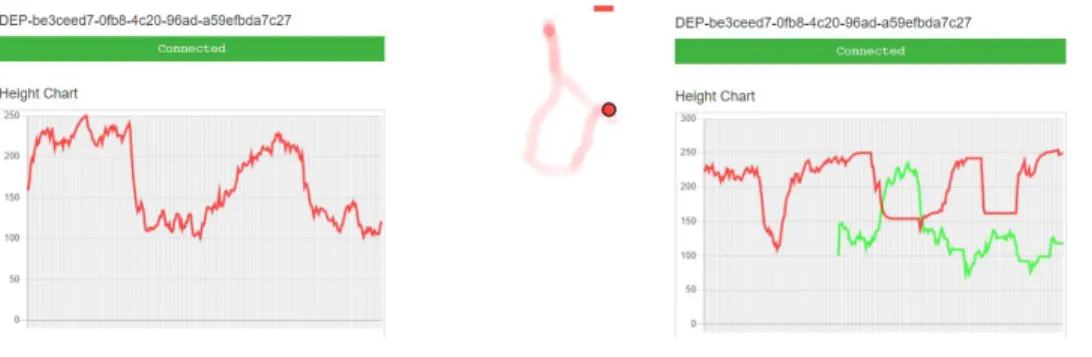
Katabi Lab, on the devemerald server they use for storing Emerald Device data, has functions for displaying the tracklets over time. In Figure 2 we can see a few plots that show how the
assignment of the two tracklet IDs (red and green) are flawed.
Figure 2. (a) Tracklet detection of a room with a moving person and fan in which the two
are bundled together, resulting in improper height detection. (b) Tracklet detection once
the person and fan have been disentangled.
Section 3: Related work in Contactless Medical Devices
WiTrack and the Emerald Device are not the only systems to take advantage of network signals or in-home devices for localization. While these two systems are unique and effective, particularly in the field of contactless medical devices, there also exists other work which keeps this patient concern in mind.
Golestanian et al classify RF localization techniques into two main categories: range-based and range-free localization [2]. These mainly differ in their accuracy and
computation, with range-based techniques such as GPS having higher accuracy at the cost of increased computation. Due to this, each category of techniques is specific to particular applications. The Emerald Device is catered towards in-home monitoring; so technological comparisons should be limited to devices with similar range and application. Zafari et al. explore different approaches to leveraging IoT for indoor localization in a survey paper as well. Based on their definitions, the Emerald Device would best be described as a monitor based localization system, in which the Emerald Device is used as a reference node from which all other signals are compared. Another method is device based localization, in which location is given relative to a series of anchor nodes in the room. This highlights an advantage of the Emerald Device, in which only one device is required to get accurate location information.
and variety of applications are therefore reduced. The Emerald device is able to garner information about sleep staging by using breathing rates from the rise and fall of the chest. Similarly, Nandakumar et al. [1] use a smartphone as a “short-range active sonar”. This sonar is achieved in the same way as the Emerald device, by using FMCW to discern time of flight measurement of signals. However, due to the limitations of a smartphone, this system must be within 1 meter of the patient during the night. From the rise and fall of the chest, their work classifies breathing abnormalities. In their work, they acknowledge that a previous mobile solution does not exist because of this distance limitation as well as the difficulty in validating the data from the smartphone.
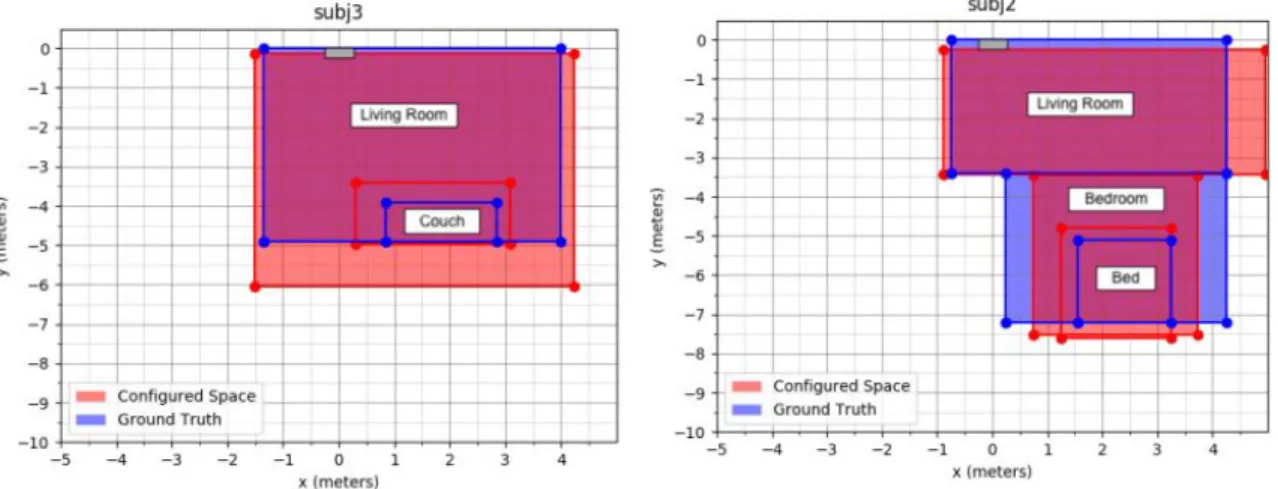
Other work in the Katabi lab relates to data validation using smartphone applications. This work by Choudhury et al. uses tracklet information to estimate the boundaries of a room [4].
Figure 3a Comparison of detection of a room from trackleys and the ground truth.
They use similar methods of bounding a rectangle to the path travelled by the user as they traverse the entire room. Furthermore, they evaluate the robustness of their tracklet system by comparing the ground truth of the room dimensions to that of the bounded rectangle. While configuring the room setup they do not assume that the device lies directly on the wall. This results in slight and consistent errors across the entire wall on which the device lies. The configured space is plotted against the ground truth in the plots of Figure 3. We can see that instead of only concentrating on the bedroom, this previous work observes multiple rooms in the house. By limiting the scope of our detection to only the bedroom, we can tailor the long term checking to features commonly found in the bedroom.
Since few rooms have a regular and standard rectangular shape, this method is error prone. They find accuracy within 0.5m for the boundaries of the walls. Furthermore, as expected, the error is most obvious the further the wall is from the device. For our usage, where we attempt to estimate bed location and dimension, this will pose similar issues. Although beds will be rectangular and easier to estimate, the bed may have furniture on its side or other obstacles. So to improve upon previous room dimension estimation, we must take into account these factors. Improvements could come from bounding the movement to more complex polygons, moving on from the assumption that rooms are rectangular. This is not a simple fix, since this process would be prone to overfitting at high enough polygon size. Choudhury also reports that device angle relative to the room has a significant impact on tracklet ability to accurately bound the room [4].
the same type of user feedback to evaluate the app functionality and quality. Additionally, the app can be evaluated by looking at how many times the user had to stream tracklets and view the image to confirm the pathing. Ideally, each user will be able to do this once and move on, so any results greater than this indicate either difficulty using the application or fundamental issues with the supporting technology’s communication.
In addition to other work with contactless medical devices, there is a great deal of previous work in generalized data validation. For this use case however, we are more interested in data validation related to signal processing, and more specifically with analyzing these heat maps and tracklets.
In a review paper by Pires et al., they discuss the current landscape of validation in mobile medical data acquisition [8]. They specifically look at monitoring of what they term Activities of Daily Living (ADL), which is very relevant for the in-home monitoring that the Emerald Device is primarily used for. Figure 4 shows the overall pipeline described in the paper.
Section 4: Short Term Validation
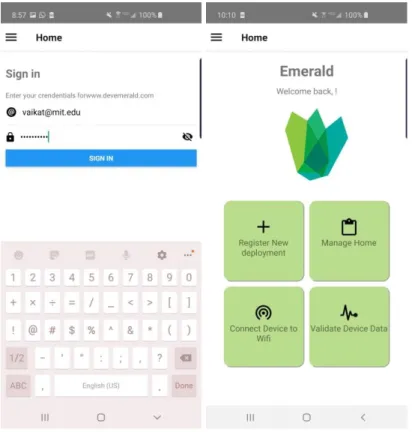
Figure 5: Login and Landing Page of the Mobile App
and enables separation of the data from each location. While this is a simple process, the current method of accomplishing this is not intuitive for a user who has never interacted with the
devemerald server before. The registration component of the app takes care of this. There are a few potential ways in which to test the functionality of this feature. The two best metrics are total time to register and a rating from the user on their experience. The time to register can be broken up into time to connect to WiFi and time to register the device, as both are important.
Figures 6 and 7 show the registration process on the app. This registration pipeline must be robust and be able to work on any given device. To maintain this flexibility, previous work moved away from manually inputting device information to using a QR code scanner to get unique identification of each device. This identification is in the form of the service set identifier (SSID) and password of the device’s WiFi network as well as a universally unique identifier (UUID) that is associated with the device. Using this, we can create a unique QR code that can then be printed on the device and used for any future app specifications. Earlier, the Katabi Lab would use the GUI of a label maker product to manually create each QR code and the associated information for each device. This was an inefficient process and would not scale in the long term. As part of this thesis, I have built an efficient script that interacts with the DYMO
Figure 6a. Display of the QR code function. 6b. Installation Instructions Screen 6c: List of
local wifi networks to connect to.
Figure 7a. List of emerald server registration options 7b. Page to specify information for
Once the device is properly connected and registered, it will begin sending RF signals, recording signal data and streaming this data to AWS. From here it is important that the data collected is both correct in form and is correctly streaming to the server. An added component of this for the scratching study is the camera attached to the device. The camera attached to the device is built on a Raspberry Pi with a mini camera attached to it. This camera is wall mounted and will connect to the WiFi network that the Emerald Device emits. While the recording and uploading process for the camera is abstracted from the patient and deployer, they should have ready access to the current camera image to confirm that the bed is in frame. This camera image is exposed to the device via a POST HTTP request. Therefore, the app needs to make an
Figure 8a. Result of streaming the camera image to the device 8b: Tracklet path of the
user. Device location marked in green.
instructs the user to turn off the lights in the room and see if the bed image is still viewable through the app. Once both of these images are validated by the user, the next step is to confirm the accurate streaming of tracking data from the Emerald Device.
As explained in the WiTrack Background section, the Emerald Device takes in the RF signal and produces a heatmap of the signal acquired. Through previously built machine learning models, the device can then predict where people are located in the room. In addition to location in the x,y,z space of each person, information such as gait and confidence in the positioning are recorded as well. All of this information is stored in the aforementioned tracklets. The device streams these tracklets at a rate of 22.5 per second. Unlike the camera image, these tracklets cannot be accessed through an HTTP request. These tracklets are not exposed on the device, but they are transmitted to the devemerald server. They can then be retrieved through the use of a socket connection using the WebSocket protocol with the devemerald server.
Once the socket connection is established between the app and the devemerald server, these tracklets are streamed to the app as long as the socket is kept open. The user is told to move in a straight line or pattern away from the device and press a button on the app to start this
process. Once they press the button, the socket connection is established and the tracklets are streaming. After they walk, the user may stop the tracking and the socket connection is closed. Since the tracklets are not being streamed directly from the device, but rather from a server after the device uploads them, there is an eight second delay from the user’s movement to the
reasonable time to wait given the overall time of setup. After this delay, the app displays the user’s path and requests their confirmation of the movement. Thus, the user can easily verify whether the device was able to track their movement in the room. The user can repeat this test as often as they want, moving in different patterns to check with the device again. If the signal appears incorrect or doesn’t display at all, the user can tell that either the device is not connected properly or that the movement was out of the device’s range, in which case it may need to be moved.
To make the tracklets easier for the user to understand, I have implemented a standard convex hull to estimate the minimum bounding polygon that describes the path being used. Figure 9 below shows an example of the input and goal output of a convex hull algorithm.
Figure 9 Visualization of a 2D convex hull algorithm. [12]
user can easily see the data that the device is collecting. By confirming this is working, many features of the device, such as its WiFi connection and its data collection, are validated even though the user only sees the end result. In this way, this process can abstract the specifics of the device from the user and allow them to only validate the end result. First, it shows that the orientation and positioning of the device are correct. Second, this confirms both that the device’s WiFi network is working and that the device is properly connected to the WiFi network of the patient and communicating appropriately with the devemerald server. If any one of these factors are incorrectly set up or connected, the tracklets will either not show up at all or look awry.
Short Term Validation Results
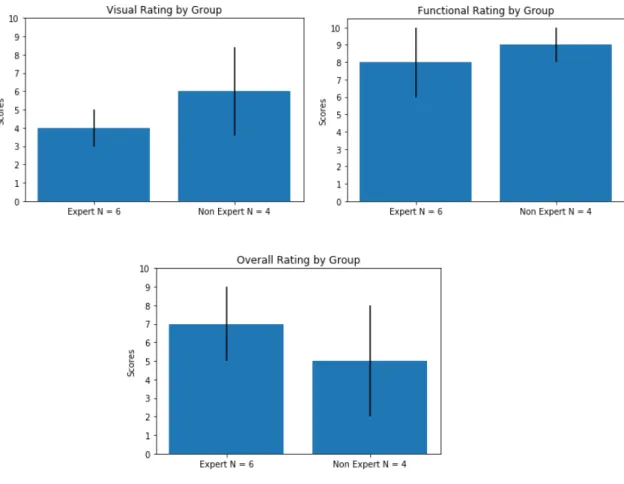
Figure 10 User recorded rating, divided by group, for (a) app visuals, (b) app functionality
and (c) overall app rating
Effectiveness is best quantitatively defined by how quickly the app can be used to set up the device. A limitation of this method is that I was the one who used the app each time, resetting the connection of the device and the local wifi or Emerald server. This means that this
Figure 11. Time elapsed during (a) Wifi connection of device through app, (b) Total time
elapsed for registration including connection time, (c) Time elapsed for validation steps.
Section 5: Long Term Preprocessing
As stated earlier, the second contribution of this project is a set of long term checks to help preprocess and understand data coming from the device. In the short term it is useful to make sure that the device is connected and streaming data; with a phone the analyzing ability is limited. Long term checks work to be able to effectively look at what is actually contained within the device data, rather than just verifying that the device is functional. This original motivation can then be expanded to try and gain a strong understanding for the layout of the room.
Bed detection is an essential part of long term validation of data within a room, since a primary usage of the MIT device is looking at activity while the person is sleeping in their bed. We can take advantage of the strong signal that reflects off of a person while they sleep, and a person’s bed orientation remains consistent for the most part over long periods of time.
There are two main data types that are involved in the long term checks: heatmaps and tracklets. Before going into the nuances of each data type, we must first explain the overall pipeline for understanding long term checks. These heatmaps are frame by frame data of the signal power at x,y points in the observable area. The device collects this data and uploads it to an AWS S3 manager on an hour by hour basis. This binary-encoded data can be downloaded and parsed to get the frame by frame results. From this, we can grab any hour-long stretch of
heatmap data. From these frames we can look at both static and moving heat maps. The moving heatmaps are acquired by successive subtraction of frames to see what moves between frames. The static heatmaps instead use an average of all acquired frames. These static heat maps thus give an idea of signals that are consistent and in the same location.
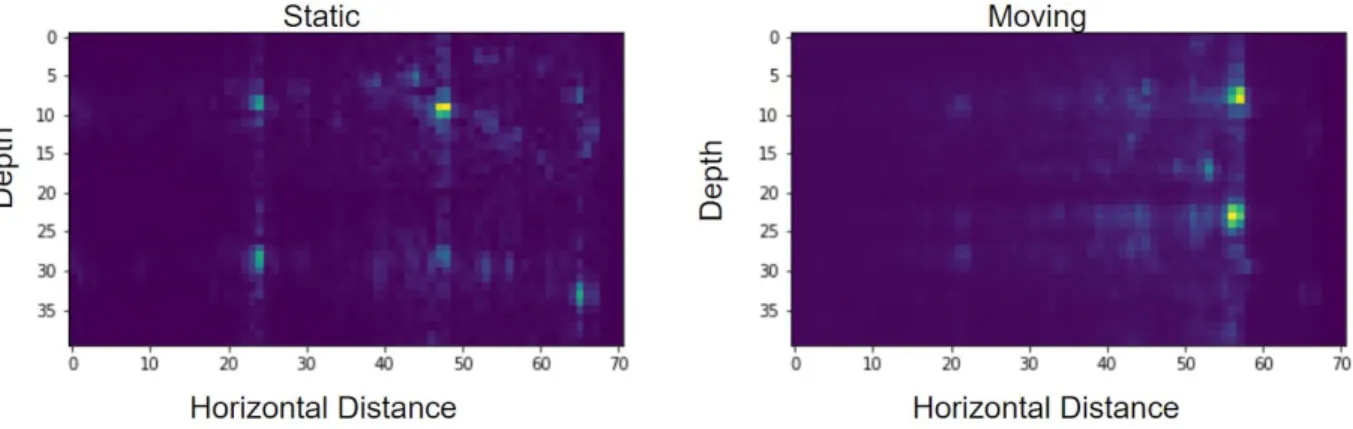
Figure 12a: Example of the heatmap from sequentially subtracting frames to get a
static image of the room Figure 12b: Heatmap of total signal power added over a series of
frames.
Along with the heatmap data, we can also grab bundles of tracklets by the hour. This is done through a pre-built python library made by the Katabi lab that interacts with the S3
manager. The library takes in a heatmap and assigns peaks in the heatmaps to people. Figure 12a shows the result of sequentially subtracting frames to get a static image of the room. In Figure 12b, instead of sequential subtraction, the heatmap is built by aggregating the signal at each position over time. This results in each point showing accumulation of signal, or consistent movement. In this example, the static image shows the outline of a room, as well as the location of a few pieces of furniture. Whereas in the moving heatmap we see only two prominent signals, coming from the sleeping person and the ceiling fan. In both of these images the device is located at (36, 0), in the top middle of the plot.
was in a circle, I may think that everything is working. And for the most part this is true, since it shows correct orientation and uploading of the data. But when attempting to understand the layout of the room, we need to be sure that the tracklets are accurately mapping the heatmap data.
In fact, this process can be faulty, and often results in confusion between person
identifications. We can see this confusion in action by analyzing a night of sleep with a moving fan. In Figure 13, we see an example of tracklet streaming that results in entangling between the fan signal and my sleeping signal. For this experiment, I placed the device next to my bed and analyzed the overnight data while I was sleeping, with my ceiling fan on. The long horizontal signal is me sleeping, while the tall vertical signal comes from my ceiling fan. In this image, the device is located at (0,0,0), or the center of the bottom left axis.
Figure 13: 3D Tracklet plot of a person sleeping with the fan on
prone signal, it is also apparent that each cluster should be one singular tracklet ID, rather than the three colors of ID we see. Thus, we have strong motivation to be able to effectively parse amongthese signals. Overall the purpose of long term checks is to be able to effectively understand the layout of the room as much as possible, and to check for troublesome signals within the room. This can be used for bed detection, improving the SNR of the room, and for future work in seeing what the user is interacting with.
Heatmap Analysis
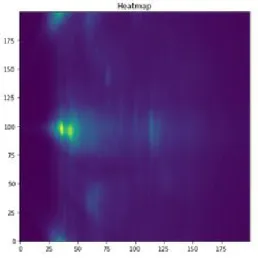
Understanding the layout of the room from just raw heatmap data is an extremely difficult problem. In the scope of this project, machine learning approaches are not ideal due to limitations on data collection. Even with data from many sets of rooms, generalizability would be tough considering how distinct objects like fans, tables or chairs may have very similar signals on a heatmap. As opposed to vision analysis, where color, corner detection and similar methods are easily understood, the raw frames in the heatmap contain much less observable data. Take the below example of a static heatmap averaged over a 10 minute period.
Figure 14: Static heatmap image
labeling the objects in the room, the best we can do is get an understanding of the peak signals within the room. Initial gaussian filtering of the room to reduce noise and subsequent island detection results in the following layout, as shown in Figures 15a and 15b.
Figure 15a: Gaussian blurring of the Figure 14 heatmap. Figure 15b: Island
detection of blurred image
While this simplified approach does make even more apparent the locations of major signals in the room, we have no ability to actually ground this in the room’s objects.
Figure 16: User drawn image of the room.
There is no inherent understanding of height from this, and the orientation of the drawing is done with the device being in the middle of the upper wall of the room. There are a few initial issues with this sort of labeling. While the user could map out their room and give an exact layout, this is very tedious and prone to error. Instead, it is more realistic to take this crude drawing as a sort of soft labeling. This gives us an idea of the number of significant items in the room, the orientation of the bed relative to the rest, and guesses for initial positioning of
Figure 17a: User drawn image of their room. Figure 17b: Decomposition of the room into
discrete shapes drawn by user
The goal here is to use the individually labeled items in the room as initial estimations for the bounding boxes of each item in the heatmap. Hence, the high-level problem statement is: (1) Using the decomposed drawing, find initial bounding boxes of all items in the room; (2) Shift the bounding box dimensions to include the majority of strong static signals; (3) Use these bounding boxes to know where in the original image signals like the fan can be removed. While the initial steps seem simple, the adjustment of the bounding boxes is actually a very complex problem. To simplify at first, we assume that every item in the room is rectangular and is oriented
First, we can explore a linear transformation between the user drawn room and the signal of the heatmap and observe the signal to noise ratio of a given object. Since the object of greatest interest is the bed, we can look here first. A linear transformation requires the definition of the room size, and assuming that the room does not extend past the furthest object in each direction results in Figure 18 below.
Figure 18a: Estimated detection of the bounds of a room given the heatmap. Figure 18b:
Heatmap containing only the estimated room.
The next step involves taking the decomposition of the room drawing, focussing on the bed, and mapping the drawing linearly to the original room signal as shown in Figure 19..
Figure 19a. The location of the bed from the decomposition of the hand drawn image of a
From this, the best metric to understand the effectiveness of this mapping is a comparison of signal to noise ratio (SNR). In current models using this data, with machine learning methods, on the scratching project, they estimate the bed based on the location of the bed from initial setup of the device. The goal of this experiment is to see how the signal to noise ratio of the bed estimated from this process compares to that of the previous method, which was described earlier. The method to quantify SNR was done by comparing the average signal bounded by the bed with the average signal in a plot of the same size as the bed of estimated noise. This noise was
approximated using gaussian white noise, with parameters of mean and variance set based on random sampling of the heatmap away from the main signals. This gives some understanding of the relative signal strength captured between this method and the previous method. The
summarized results can be seen in Figure 20 below.
Method Signal Noise SNR
Previous Static Bounding Box
2.581 0.379 6.818
From Image Bounding Box
3.148 0.379 8.298
Figure 20. Table showing the aggregate signal and estimated noise in each bounding box
and their resulting SNR for 4 sets of heatmaps.
Tracklet Analysis
boxes for sets of points [10]. Unfortunately, this will only be effective for looking at tracklets while the person is sleeping, since in the end we need tracklet clusters that can be fully separated. Recall the previous problem in which the signal of the fan heavily disrupted current tracklet creation algorithms, visualized in Figure 21.
Figure 21a. 3D Tracklet plot of person sleeping while the fan is on. 21b. Current Tracklet
ID allocation result
in a dataset of our type. To get the most likely number of clusters from a dendrogram, we use the commonly used elbow method shown in Figure 23. The peak of the orange line and the greatest point of inflection, or elbow, of the blue line show where the model best fits and gives the most likely number of clusters. From this, we can use standard k-means clustering, which works extremely well in this case, as seen in Figure 24. Figures 22-24 show the process from dendrogram to elbow method and the resulting clustering.
Figure 23. Elbow method plot from the dendrogram.
Figure 24. Clustering result
Once we have the appropriate clusters, we can isolate them and attempt to create accurate 3-D convex hulls. This input and output result is shown in Figure 25, using the isolated signal from the clusters associated with the fan.
Figure 25. A isolation of just the fan signal from the previous plot. b. Result of 3D convex
hull algorithm on this point cloud.
Figure 26a. Plot comparing the relationship between the maximum standard deviation of
outliers kept in the point cloud before making the hull. b. Relationship between the volume
of the hull and ratio of points kept.
Section 6: Future Work
During Fall 2019 and early Spring 2020, I was able to make regular trips to MIT’s CSAIL lab and have direct access to data and resources for this project. However, after the COVID-19 situation unfolded, I lost access to their machines. Given more time, and if I had continued access to data acquisition that I did at the Katabi lab there are a few paths that I would take in improving the methods that I have described in this thesis. These are in the analysis of heatmaps and tracklets. First, I would address the full decomposition of the drawn image of a room and its comparison to the heatmap signal. As shown in the previous section, a linear transformation improves upon previous methods, but is still prone to error. The next step would be to find more concise bounding boxes.
much of the signal from the room as possible. This metric, along with the fact that our subsets can contain no overlap, this could trivially result in the entire room being divided up into N objects as seen in Figure 27.
Figure 27: Greedy result of dividing the room into 3 non-overlapping parts
It is obvious from the above image in Figure 11 that while this greedy approach does contain all points in the room within N objects, there is no proper real world mapping of these objects from the algorithm to objects in the real world. Instead we want to look at optimizing the size, in either area or perimeter, of each bounding box with the number of peaks it contains, and also the number of peaks left behind. The simplest way to do this is assign a scoring system to the creation of sets in S. We can bring back the convex hulls used during short term checking and apply them to the heatmap points rather than tracklets.
Figure 28: Jarvis Algorithm Process [13]
Since at each point pair we must compare to all remaining points the runtime is O(n^2). For our purposes this is fine, since it is polynomial runtime, but may be problematic for very dense heatmaps. Instead we will use the Graham Scan. In this, the set of points are stored in a stack, so that if any concave features are detected we can pop points off the stack and remove them. Again we first find the leftmost point p. We sort the remaining points by their angle relative to p, breaking ties by distance, since further points connecting will contain the closer points. Then if a new point being added to the stack causes a clockwise orientation, then points are popped off the stack until the new point being added is counterclockwise to the current stack. This ensures a convex hull in O(nlogn) time.
Section 7: Conclusions
In this thesis, I introduce three overarching techniques used to improve validation and preprocessing in the contactless medical device data field. This thesis specifically relates to the work done in the Katabi Lab at MIT.
The first of these techniques allows for improved setup of the device with a mobile app that walks the user through registration and validation of the device data. With total process times under five minutes and positive user ratings, this app allows for non-experts to properly set up and validate device data.
Second, efficient clustering and creation of tight convex hulls of tracklets shows strong improvement on previous methods. Instead of continued confusion between tracklet IDs, this method accurately clusters tracklets appropriately.
Section 8: Acknowledgements
I deeply appreciate the advice, generosity and encouragement of my thesis adviser Dr. Kevin Jeffay. His caring advice and sharp critique have helped to change my perspectives in computer science research. I thank him for that. I thank Dr. Dina Katabi, at MIT, for supervising my research and creating all of the foundation of my work. I would also like to thank Dr. Don Porter and Dr. Shahriar Nirjon for being a part of my thesis committee. I appreciate all of their time and advice on my work.
In our pursuit of a healthy life, I consider technology to be an extremely important ally. The research reported in this thesis addressed the intersection of computer science and health. It began at the Computer Science and Artificial Intelligence Lab (CSAIL) group at the
Massachusetts Institute of Technology (MIT) in Cambridge, MA, where I worked this past summer, and then continued throughout the last academic year. My sincere thanks to the
Morehead-Cain foundation, who funded my time at MIT and have supported me throughout my time at UNC.
Finally, I owe heartfelt thanks to my professors and peers for an enriching experience at Carolina. I am grateful to my friends and family who share my strong belief that computer science is the most marvelous of all fields. I thank them for their unceasing encouragement, dissenting thoughts, and for motivating me to endure to the end.
I am grateful to the NSF Graduate Research Fellowship Program (GRFP) for funding my future research as I begin my doctoral studies in fall 2020 at Duke University.
– Vikram Aikat,
Section 10: References
1. Nandakumar, Rajalakshmi, et al. “Opioid Overdose Detection Using Smartphones.” Science Translational Medicine, vol. 11, no. 474, 2019,
doi:10.1126/scitranslmed.aau8914.
2. Golestanian, Mehdi, et al. “Radio Frequency-Based Indoor Localization in Ad-Hoc Networks.” Ad Hoc Networks, 2017, doi:10.5772/66523.
3. F. Zafari, et al., "A Survey of Indoor Localization Systems and Technologies," in IEEE Communications Surveys & Tutorials, vol. 21, no. 3, pp. 2568-2599, thirdquarter 2019. 4. Choudhury, Zareen. “Configuration of Wireless Connectivity and Spatial Boundaries for
IoT Monitoring Devices”. Massachusetts Institute of Technology 2019
5. Wang, Jue & Katabi, Dina. (2013). Dude, Where's My Card? RFID Positioning That Works with Multipath and Non-Line of Sight. ACM SIGCOMM Computer
Communication Review. 43. 51-62. 10.1145/2486001.2486029.
6. Kabelac, Zachary. “In-home passive monitoring for medical applications”. Massachusetts Institute of Technology 2019
7. “BedSense Contactless Bed Sensor for Medical & Care.” 2M Engineering – Sensor Product Development, 2020,
www.2mel.nl/projects/bedsense-bed-sensor-technology-platform/.
8. Pires, Ivan Miguel, et al. “Validation Techniques for Sensor Data in Mobile Health Applications.” Journal of Sensors, vol. 2016, 2016, pp. 1–9., doi:10.1155/2016/2839372. 9. Noga Alon, et al.. 2006. Algorithmic construction of sets for k-restrictions. ACM Trans.
Algorithms 2, 2 (April 2006), 153–177. DOI:https://doi.org/10.1145/1150334.1150336 10. O’Rourke, Joseph. “Finding Minimal Enclosing Boxes”. International Journal of
Computer and Information Sciences. Volume 14. No 3. June 1985.
12. “Convex Hull: Set 1 (Jarvis's Algorithm or Wrapping).” GeeksforGeeks, 30 Sept. 2019, www.geeksforgeeks.org/convex-hull-set-1-jarviss-algorithm-or-wrapping/.
13. Chan, Justin, et al. “Detecting Middle Ear Fluid Using Smartphones.” Science Translational Medicine, vol. 11, no. 492, 2019, doi:10.1126/scitranslmed.aav1102. 14. Rajalakshmi Nandakumar, et. al.. 2018. 3D Localization for Sub-Centimeter Sized
Devices. In Proceedings of the 16th ACM Conference on Embedded Networked Sensor Systems (SenSys ’18). Association for Computing Machinery, New York, NY, USA, 108–119. DOI:https://doi.org/10.1145/3274783.3274851
15. Katabi, Dina. “WiTrack.” WiTrack, Massachusetts Institute of Technology, 2013, witrack.csail.mit.edu/.
16. Fadel Adib, et. al.. 2015. Multi-person localization via RF body reflections. In Proceedings of the 12th USENIX Conference on Networked Systems Design and Implementation (NSDI’15). USENIX Association, USA, 279–292.
![Figure 4: Data validation pipeline proposed by Pires et. al. [8]](https://thumb-us.123doks.com/thumbv2/123dok_us/8238835.2183684/16.918.317.657.716.977/figure-data-validation-pipeline-proposed-pires-et-al.webp)