Qishun Wang. A Study of Amazon Customer Review Helpfulness Using Machine Learning. A Master’s Paper for the M.S. in I.S degree. April, 2020. 62 pages. Advisor: Arcot Rajasekar
With the rapid development of the Internet, online customer reviews (OCR) have become an important part of online shopping platforms that provides a wealth of information. In this paper, I proposed two different models to predict the helpfulness of an OCR using the data from online electronics review at Amazon.com. I built a random forest classifier using content, readability and metadata of the reviews and reached a 75% of accuracy. I also found that the most helpful feature in this model is the star-rating of the review. The other models proposed in this paper are deep learning NLP models like LSTM and BERT. These models can help us solve the “cold start” problem of text mining. Based on the research, online shopping platforms could use the helpfulness prediction to pre-rank the review, which could benefit both the platform itself and their customers.
Headings:
Online Customer Review
Text Mining
A STUDY OF AMAZON CUSTOMER REVIEW HELPFULNESS USING MACHINE LEARNING
by Qishun Wang
A Master’s paper submitted to the faculty of the School of Information and Library Science of the University of North Carolina at Chapel Hill
in partial fulfillment of the requirements for the degree of Master of Science in
Information Science.
Chapel Hill, North Carolina
April 2020
Approved by
_______________________________________
Table of Contents
Introduction ... 2
Literature Review ... 6
Online customer review ... 6
Review helpfulness ... 8
Review readability ... 10
Review Rating ... 12
Data & Feature Engineering ... 14
Data Source ... 14
Data Preprocessing ... 16
Data Visualization ... 18
Feature Engineering ... 21
Baseline Model ... 25
Feature Ablation Study ... 26
Word Embedding & LSTM ... 27
Bidirectional Encoder Representations from Transformers (BERT) ... 32
Discussion... 35
Conclusion ... 38
Reference ... 42
Appendix A ... 47
Introduction
Word of mouth (WOM) – interpersonal communication about products and
services between consumers – is one of the most influential sources of marketplace
information for consumers (Arndt 1967; Alreck & Settle 1995). The power of WOM to
influence consumers’ decision-making processes has long been known to researchers and
practitioners; the power of WOM has recently become even more important with the advent
of the internet (Sun et al. 2006). With the rapid development of the Internet, online
customer reviews (OCR), a form of electronic word of mouth (eWOM), have become an
important part of online markets that provides a wealth of information. Product review
websites (e.g. consumerreview.com), retailers’ websites (e.g. amazon.com), brands’
websites (e.g. nike.com), personal blogs, message boards and social networking sites (e.g.
Facebook, Twitter) are all examples of the types of eWOM platforms (Bickart & Schindler
2001). Reviewers share their experience through reviews and consumers look for detailed
information from these reviews. This consumer-oriented information provides indirect
experience of products, which have greater credibility and relevance compared to
information provided by sellers (Park & Lee, 2007).
However, because reviews are highly personal and can be very intentional, not all
reviews are helpful reviews and affect customers in the same way. Reviews that are
considered more helpful by consumers have stronger effect on their purchase decisions
than other reviews (Baek, Ahn & Choi, 2012). Many studies show that online product
product categories (Chen, Dhanasobhon, & Smith, 2007; Forman, Ghose, & Wiesenfeld,
2008). Recent studies suggest that characteristics of reviews and reviewers collected
through variables such as reviewer identity, reviewer location, information quantity, and
semantic factors (Cao, Duan, & Gan, 2011) may add more insights to the line of research.
Since reviewer identity is difficult to come by when collecting reviews directly from
publicly available sources (such as Amazon.com), Mudambi and Schuff (2010) suggest
that future extensions of their work may focus on other forms of disclosed reviewer’s status,
such as Amazon’s “top reviewer” designation.
Among the many variables associated with online product reviews, “review
helpfulness” is particularly important, as it represents the subjective valuation of the review
judged by others, and is also the aggregate perceived utility of the information contained
in the review (Cao et al., 2011; Baek, Ahn, & Choi, 2012; Li, Huang, Tan, & Wei, 2013).
A favorable helpful review adds perceived value to the product, but a critical review is also
an opportunity to perform customer service. However, “helpfulness” is quite a complex
concept as one would easily equate length (number of words) of review message to
helpfulness, while others might consider message length as “effort” instead. Added to the
complexity is that helpful messages are often lengthy fill with details, but the other way
around may not be true (i.e., a lengthy message is not necessarily a helpful one). Even
within helpful reviews, the effect of message length on helpfulness could diminish when it
reaches a certain threshold. Beyond the threshold, it may not get read in detail. A direct
relationship between helpfulness and message length is explored in a recent study
(Mudambi & Schuff, 2010), where the authors reported a linear relationship between
votes). Despite that past behavioral patterns might have an effect on review helpfulness,
existing studies have not paid enough attention to them. An example of such pattern
includes the effect of past review performance on future review quality. Past helpfulness
ratings could become a form of incentive for those who have done good reviews before.
As a result, we will be able to shed some light by including past review patterns to study
review helpfulness.
It is crucial for online marketers to lead reviewers to write more helpful reviews
and provide more helpful reviews to their customers by finding out which factors determine
the helpfulness of online reviews. Although most sites that provide consumer reviews also
provide helpfulness data such as the total helpful votes received by the user, reviews
published earlier appear to have more helpful votes than recent reviews, even if they are
less helpful. Analyzing factors affect review helpfulness and being able to predict review
helpfulness once posted is useful to advertisers and consumers.
Past researches have studied factors that affect the helpfulness of online customer
reviews. Huang, Chen, Yen & Tran (2015) found that word count could affect the
helpfulness of reviews by all reviewers and reviewer cumulative helpfulness affect the
helpfulness of reviews by top ranked reviewers. Baek et al. (2012) found that both
peripheral cues, including review rating and reviewers' credibility, and central cues, such
as the content of reviews, influence the helpfulness of reviews. Mudambi and Schuff (2010)
found that review depth has a positive effect on the helpfulness of the review, but the
product type (search or experience) moderates the effect of review depth on the helpfulness
of the review. These studies show many factors and their effect on review helpfulness for
The objective of this research is to find out the factors that predict the helpfulness
of online customer reviews and which factors are more effective in review helpfulness
prediction. This research also wants to find out if good reviews or helpful reviews really
affect customers’ purchase decisions. This paper seeks to answer the following research
questions (RQs):
RQ1: How do features associated with readability contribute to predictions of
review helpfulness?
RQ2: How does the content of the review related to the review helpfulness?
RQ3: How does meta-features of the review related to the review helpfulness?
The remainder of my proposal is organized as follows. The second section is the
literature review that presents former researches about potential factors that affects the
helpfulness of online reviews and about the findings in the relationship of reviews and sales.
The third section describes the data that I used in the research, including my data collection,
feature selection, and feature generation and engineering. The fourth section of the paper
describes the method that I used and the models that I created to predict the review
helpfulness using various features, and also the results of those models. The fifth section
Literature Review
Online customer review
Online customer review (OCR), a form of electronic word of mouth (eWOM), is
product review that generated by consumer and provided in addition to the product
description or personalized recommendation system. It usually provides customers the
opportunity to evaluate the product in textual comments and numerical rating. Online
customer reviews are becoming widely used on various types of sites and have become a
more and more important source of information that helps customers make their purchase
decisions. The effects of online customer reviews have been studied from many different
aspects.
OCRs can be divided into two groups: qualitative and quantitative OCRs (Sridhar
& Srinivasan, 2012). Qualitative OCRs provide a written description of the usage
experience. In qualitative reviews, the customer is completely free to choose how to
describe, criticize, and evaluate the product (Jiménez & Mendoza, 2013).
In the case of a quantitative OCR, the customer is forced to summarize his or her
evaluation in a single rating or grade, and the single ratings from customers are usually
pooled together into a summary statistic (Kostyra et al., 2016).
According to Chintagunta et al. (2010), a quantitative OCR can be decomposed into
1. Valence, which is the average rating and represents average customer
satisfaction;
2. Volume, which is the number of customer ratings for each valence level and
the total number of ratings; and
3. Variance, which is the variation in ratings along the rating scale and is
observable through the number of customer ratings for each valence level. Variance
represents the degree of disagreement or heterogeneity among customers'
evaluations.
Park and Lee (2008) found that online customer reviews provide indirect
experience of products, which have greater credibility and relevance than information
provided by sellers. In terms of the effects of information provided from seller and
customer, Bickart and Schindler (2001) compared the influence of marketer-generated
online information with consumer-generated online discussions and found that consumers
are more interested in product topics when they acquired information from online
customers. Kumar and Benbasat (2006) also found that the provision of recommendation
and consumer reviews could increase both the usefulness and social presence of the website.
With this in mind, online customer reviews can provide customers additional information
with more credibility from consumers’ perspective and are more influential in helping
customers making their purchase decision.
OCRs also have impacts on product sales. Chen, Wu and Yoon (2004) discussed
the impacts of online recommendations and consumer feedbacks on book sales based on
data gathered from Amazon.com. Their results indicate that consumer ratings are not
associated with sales. Archak, Ghose and Ipeirotis (2011) examined the influence of online review’s content subjectivity with product sales and perceived usefulness. The result shows
that reviews with a mixture of objective and highly subjective sentences are negatively
associated with product sales compared to reviews that tend to include only subjective or
objective information. From the findings, we can hypothesize that by discovering the most
influential components of online customers reviews, seller can encourage more valuable
reviews to help consumers’ decision-making process and increase their own product sales.
Review helpfulness
To maintain the value of online reviews and to address concerns about their
credibility and quality (Cheung, Sia, & Kuan, 2012), some online review sites allow readers
to “review the reviews.” The most common approach is to rate a review as “Helpful” or
“Not Helpful” (Baek et al., 2012; Li et al., 2013). A helpfulness score is then calculated as
the percentage of “Helpful” votes among all votes. Such a check-and-balance measure
provides a certain degree of quality assurance and allows readers to more quickly find
helpful reviews among the thousands that may exist. Reviews with a higher number of
helpfulness votes were found to have a higher correlation with sales (Chen, 2013; Chen et
al., 2007).
In addition to be a quality assurance tool, helpfulness can also be regarded as a
subjective measurement of the potential value of the information contained in a review. A
review that influences potential customers could logically lead to a purchase. Theoretically,
one could calculate the net economic value of a review by summing the net financial
outcomes for all consumers who acted on it. Unfortunately, such information would be
helpfulness score of the review, submitted by consumers who read and voted on it. This
could then be seen as a subjective assessment of the review. While the result would not
have a monetary value, it would represent the perceived utility of the information contained
in the review (Huang et al., 2015).
Chen and Dhanasobhon (2008) built multiple models using different features and
assessed their relationship to product sales. They found that reviews that are considered
more helpful by customers have stronger effects on their purchase decisions than other
reviews. Lee and Choeh (2018) built regression models to examine the interactive impact
of online word-of-mouth and review helpfulness on ticket sales. They found that when the
helpfulness of reviews is high, number of reviews and review length are associated with
the box office of movie. Sites containing more helpful reviews are more likely to attract
buyers and consumers seeking information, and length of helpful reviews improve the
value of business sites. Chen and Huang (2013) found that reviews that have a higher
number of helpfulness votes tended to have a higher correlation with sales. These research
above shows that it is important for sellers to lead reviewers to write more helpful product
reviews, and for consumers to find helpful reviews more easily by figuring out what factors
could determine the helpfulness of online reviews.
A helpfulness score can be assigned to each review by calculating the percentage
of helpful votes among all votes. This rating system gives a certain degree of review quality
evaluation and sites could position the review with most helpful votes to higher ranks on
the product information page. This allows consumers to find more helpful reviews quickly,
consumers can also sort reviews by their helpfulness, ratings or publication date. Reviews
as they provide more up-to-date information about the product. However, an older review
tends to have a larger number of helpful votes than a review published earlier. Ghose and
Ipeirotis (2011) found that the helpful votes are not a useful feature for ranking recent
reviews as the helpful votes can accumulate over a long period of time, and hence cannot
be used for review placement in a short-term time frame. Thus, a helpfulness score is a
better feature to represent the helpfulness of a review than the helpfulness votes.
Review readability
Review readability, or the level of cognitive effort required to understand the text,
has impact on the helpfulness of reviews (Korfiatis et al., 2008). Consumers generally
would consider a review helpful only if they have been able to comprehend the text
appropriately. Therefore, if a review has better readability, consumers are able to
understand it more easily. However, Hu et al. (2012) discovered that if a review is too easy
to comprehend, it may increase the chances of reviews being fake, as deceptive reviewers
may intentionally make reviews simple to catch more attention.
The features used to predict readability in the literature are largely consistent with
each other. Liu et al. (2004) divided the features they considered to predict readability into
semantic and syntactic categories, exploring both the words and structures of sentences.
Syntactic features include sentence length, average number of characters per word, average
number of syllables per word, percentage of various part-of-speech tags and various
readability indices such as SMOG (Mc Laughlin, 1969) and FOG (Gunning, 1969). Longer
sentence length, higher average number of characters or syllables per word would decrease
the readability of the content. Semantic features include the frequency of numerous 1-, 2-,
cross validation using feature from the combination of two categories. Huang and Chen
(2015) used both quantitative and qualitative factors to predict online review helpfulness.
They found that quantitative data like word count has a threshold in predicting review
helpfulness. When a review has word count less than 144, the word count can be used to
predict review helpfulness, and review helpfulness increases when word count gets larger.
However, the word count stops being a significant predictor after it exceeds the threshold.
Hu et al. (2012) used the Automated Readability Index (ARI) to ascertain readers’
ability to comprehend text. The ARI evaluates the readability of a text by decomposing the
text into its basic structural elements. Many researchers have used it to evaluate review’s
readability (Hu et al., 2012; Krofiatis et al., 2012; Ghose & Ipeirotis, 2011; Chen, Wu &
Yoon, 2004). When ARI gets higher, the readability of the content decreases. Korfiatis et
al. (2012) used the Gunning-Fog Index (FOG), FleschKincaid Reading Ease (FRE), and
Coleman-Liau Index (CLI), along with ARI to examine the effect of readability on review
helpfulness. They found that review readability had a greater effect on the helpfulness ratio
of a review than its length, and reviews with lower word length and higher readability
scores from readability indices like ARI and CLI could provide consumers as much
information as possible and were considered to be highly helpful. Ghose and Ipeirotis
(2011) used average number of characters in each word and word count in reviews, along
with ARI, CLI and FRE, and found that the improvement of readability has a positive and
statistically significant impact on review helpfulness for audio-video products and DVDs.
However, the directional impact is mixed across different product categories and
readability is more effective in predicting “experience goods”. Experience goods are
such as movies. To summarize, several researchers have shown that readability is an
important factor that could be evaluated through word count and readability indices to
examine their effectiveness in predicting review helpfulness.
Review Rating
Review extremity and rating are important factors for helpfulness prediction.
Review extremity is calculated as the difference between review’s rating for the product
and the average rating of all reviews on this product. Baek and Ahn (2012) used the
inconsistency of the rating with existing reviews’ average rating for a certain product as a
factor to predict a review’s helpfulness. They found that reviews with lower extremity
values are more helpful to customers. Customers may judge the review whose rating is
consistent with the average rating of all other reviews as the most reliable review, leading
them to conclude that the review is helpful. Lee and Choeh (2018) found that review rating
and review extremity are important determinates for review helpfulness for experience
goods like movies. Consumers tend to find reviews with more extreme ratings more helpful,
as these reviews usually provide strong arguments for the positive and negative parts of the
movies and contain more useful information. In contrast, reviews with moderate ratings
tended to exhibit complex information for both sides that fail to offer a clear explanation.
Customer’s rating is a numerical score in the form of number or star that indicating
the overall valence of the review. In the context of product reviews on Amazon.com, the
star rating appears at the beginning of each review, and ranges from 1 to 5 stars representing
extreme disapproval to utmost appreciation (Wu, Van, & Korfiatis, 2011). The relationship
between review rating and helpfulness is not simply linear. Forman and Ghose (2008)
extreme ratings, as they provide strong arguments in favor or against the product to help
other consumers make their decisions. Ghose and Ipeirotis (2011) measured the effect of
numeric review rating on review helpfulness and found that the effect was significant only
Data & Feature Engineering
In this section, I will discuss the data source, basic data analysis, data visualization
and cleaning, and feature engineering.
Data Source
In order to answer the research questions, I would like to use the Amazon AWS
customer reviews datasets. There is a very large dataset of Amazon customer review on
The Amazon Simple Storage Service (Amazon S3). Amazon S3 is an object storage service
that offers industry-leading scalability, data availability, security, and performance1.
Amazon Customer Reviews is one of Amazon’s iconic products2. In a period of over two
decades since the first review in 1995, millions of Amazon customers have contributed
over a hundred million reviews to express opinions and describe their experiences
regarding products on the Amazon.com website. This makes Amazon Customer Reviews
a rich source of information for academic researchers in the fields of Natural Language
Processing (NLP), Information Retrieval (IR), and Machine Learning (ML), amongst
others.
Accordingly, Amazon are releasing this data to further research in multiple
disciplines related to understanding customer product experiences. Specifically, this
1https://aws.amazon.com/s3/
dataset was constructed to represent a sample of customer evaluations and opinions,
variation in the perception of a product across geographical regions, and promotional intent
or bias in reviews. The dataset includes 46 different product categories such as books,
music, furniture and so on. Each product category contains 14 different attributes: there are
attributes regarding the product, such as ‘product_id’ which is unique for each product;
attributes regarding the review, such as ‘review_body’ which is the review text; and
attributes about the reviewer, such as ‘customer_id’ which is a random identifier that could
be used to aggregate reviews written by a single author.
The dataset contains the customer review text with accompanying metadata, consisting of
three major components:
• A collection of reviews written in the Amazon.com marketplace and associated
metadata from 1995 until 2015. This is intended to facilitate study into the
properties (and the evolution) of customer reviews potentially including how
people evaluate and express their experiences with respect to products at scale.
(130M+ customer reviews)
• A collection of reviews about products in multiple languages from different
Amazon marketplaces, intended to facilitate analysis of customers’ perception of
the same products and wider consumer preferences across languages and countries.
(200K+ customer reviews in 5 countries)
• A collection of reviews that have been identified as non-compliant with respect to
Amazon policies. This is intended to provide a reference dataset for research on
part of the dataset is distributed separately and is available upon request – please
contact the email address below if you are interested in obtaining this dataset.
Data Preprocessing
In order to do my research effectively and efficiently, I chose to use a subset of this
huge dataset. The subset that I chose is the Amazon customer’s reviews for electronics,
which contains 3,091,023 rows and 14 columns. Each row is the information about a review,
and the 14 columns are listed in Table 1.
Table 1: Column names and their description in the original dataset.
Column’s Name Description
Marketplace The marketplace of the product
Customer_id The unique identifier of the customer
Review_id The unique identifier of the review
Product_id The unique identifier of the product
Product_parent The parent category of the product
Product_title The title of the product
Product_category The category of the product
Star_rating The rating of that review gave to the product
Helpful_votes The number of the helpful vote
Total_votes The number of the total votes
Vine Whether it is an Amazon Vine Review
Verified_purchase Whether this review is from a verified purchase
Review_headline The headline of the review
Review_date The date of the review
Although this subset is much smaller than the original dataset, it is still too large
for my research. Also, there are many columns which I do not need in my research.
However, the first thing that I did was not data cleaning, but created a target for my
research, which is the review helpfulness. For each review, I assigned a continuous
helpfulness score which is calculated by the division of helpful votes and total votes the
review received from other customers.
𝐻𝑒𝑙𝑝𝑓𝑢𝑙𝑛𝑒𝑠𝑠 𝑆𝑐𝑜𝑟𝑒 =#𝐻𝑒𝑙𝑝𝑓𝑢𝑙_𝑣𝑜𝑡𝑒𝑠 #𝑇𝑜𝑡𝑎𝑙_𝑣𝑜𝑡𝑒𝑠
I then converted the continuous helpfulness score into binary for efficiency and
simplicity. This also allowed the results to be compared with other research using the
regression models to see their similarity. Archak et al. (2011) used two human coders to
do a content analysis on a sample of 1,000 reviews randomly chosen and performed a ROC
analysis to balance the false positive rate and the false negative rate. The precision and
recall metrics show that when the helpfulness separation threshold is set at 0.6, the error
rate in the classification is minimized. Hong (2012) and Krishnamoorthy (2015) also used
the same threshold. In this paper, I also used a threshold of 0.6 to convert the helpfulness
score to a binary target.
However, not all review can have an effective helpful score. Some of the product
only received a few reviews so that there might not be enough people to votes the reviews.
And also, even if the number of reviews is large enough, some of the review only received
selected reviews of products with at least 100 reviews, and removed all the reviews that
received less than 10 total votes to ensure that there would be a significant number of peer
rating votes accumulated for the review in my dataset. The resulting dataset contains
55,173 reviews.
Data Visualization
But before I did anything else to manipulate the dataset or tried to clean any of the
other attributes, I did some data visualization to help me better understand this dataset and
to decide which rows and columns is the data that I need. Here I list some of the meaningful
visualization, full visualization content is attached at appendix.
First of all, I created a distribution graph for the target in the whole dataset as Figure
1. As I expected before, there are more helpful reviews that unhelpful reviews. There are
over 40,000 helpful review but only 10,000 unhelpful review. So, in this research, I will
do a stratified sample to balance the target in order to get a better model. After the sample,
the dataset contains 22,552 reviews and the number of helpful reviews is the same as the
number of unhelpful reviews.
I created a distribution graph for star-rating of review for each of the class. The
distribution showed me that helpful reviews are mostly high rating reviews, while the
unhelpful reviews are low rating reviews.
Figure 2: Star-rating distribution for helpful reviews and unhelpful reviews
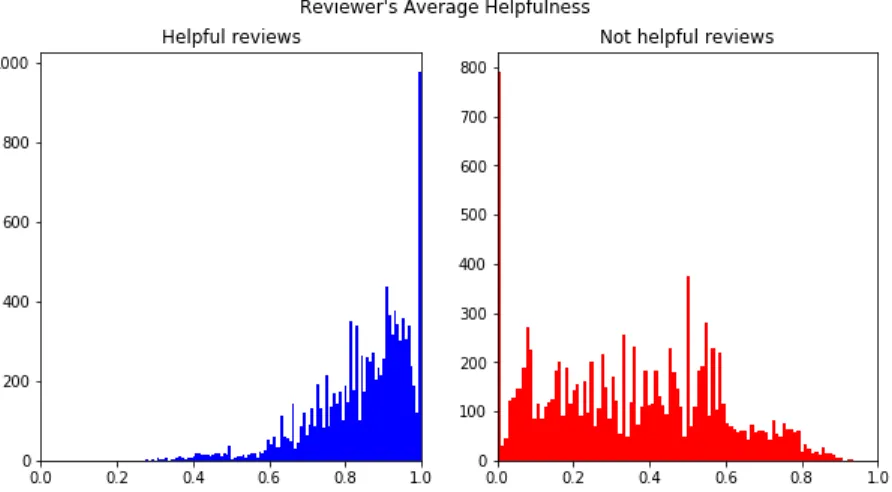
For the reviewer’s information, I created the reviewer’s average helpful score
distribution for both helpful reviews and unhelpful reviews. The distribution graph shows
us that the reviewer’s average helpful score is a great feature because the difference
between helpful review and unhelpful reviews is huge. It seems that reviewers who wrote
high quality reviews will keep their quality in their future reviews.
Figure 3: Reviewer’s average helpful score distribution for helpful reviews and unhelpful reviews
For the content of the review, the most important attribute must be the length of the
distribution for both helpful reviews and non-helpful reviews. As we can see in Figure 4,
the two distributions are similar, but showed some difference. For the helpful reviews, the
slope is flatter and for the non-helpful reviews, the slope is steeper. As a result, the length
of the review can be used as a feature.
Figure 4: Character count distribution for helpful reviews and unhelpful reviews
There is also another similar feature related to the length of the review, which is the
number of words in each review. As we can imagine, if the review is longer, the number
of words in that review will be larger. I created a distribution graph of the word count for
both helpful reviews and non-helpful reviews. As I expected, the two distributions of the
word count in are similar to the character count distribution for both helpful reviews and
non-helpful reviews. Thus, I put the word count in reviews in the feature set.
Since the character count distributions and the word count distributions are similar,
I assume that the average word length distribution will also be similar for helpful review
and non-helpful reviews. As a result, I created the distribution graph and it showed that my
assumption is correct. As we can discover in Figure 6, the majority of average word length
in helpful review and non-helpful reviews is in the range of 4 - 5.
Figure 6: Average word length distribution for helpful reviews and unhelpful reviews
Feature Engineering
The target of my research is to predict whether a review is helpful or not, and there
are three different categories of feature that I wish to put in the experiment: features related
to readability of the review, features related to the content of the review, and features
related to the metadata of the review.
• Content
The selection of features related to content is based on the data visualization.
The first feature that I chose is character count in each review. Basically, the characters
count is the length of the review. However, I will remove characters like spaces and
punctuations to make this feature more related to the content. The second feature that I
chose is the word count. Similar to the character count, the word count is calculated
The content itself can also be a feature. I combined the review headline and the
review body content to create a single text feature and put it into a word embedding,
then each review can be transformed to a sequence of feature vector. This feature will
be elaborated in 4.3.
• Readability
For readability, I plan to use the review text to calculate the word count, the
Automated Readability Index (ARI) and Coleman–Liau index (CLI) of each review.
The Automated Readability Index (ARI) is a readability test designed to assess
the understandability of a text. Like other popular readability formulas, the ARI
formula outputs a number which approximates the grade level needed to comprehend
the text. The Automated Readability Index is derived from ratios representing word
difficulty (number of letters per word) and sentence difficulty (number of words per
sentence). Here is the equation to calculate the ARI:
ARI = 4.71 * (characters / words) + 0.5 * (words / sentences) - 21.43
The Coleman–Liau index is a readability test designed by Meri Coleman and T.
L. Liau to gauge the understandability of a text. Like the ARI but unlike most of the
other indices, Coleman–Liau relies on characters instead of syllables per word.
Although opinion varies on its accuracy as compared to the syllable/word and complex
word indices, characters are more readily and accurately counted by computer
programs than are syllables. The Coleman–Liau index was designed to be easily
calculated mechanically from samples of hard-copy text. Unlike syllable-based
readability indices, it does not require that the character content of words be analyzed,
theoretically simple mechanical scanners that would only need to recognize character,
word, and sentence boundaries, removing the need for full optical character recognition
or manual keypunching. Here is the equation to calculate CLI:
CLI = 0.0588 * (characters * 100 / words) - 0.296 * (sentences * 100 / words) - 15.8.
• Metadata
The features related to the metadata is limited in my dataset, but there is a very
promising feature, which is the verified_purchase column. Imagine that you are
viewing a review, but the review in written by someone who did not even buy the
product, will you believe what the reviewer said? As a matter of fact, I assume that the
verified purchase is a very promising feature.
Another feature that I chose to use is the start rating of the review. This metadata
can show us how the reviewer thinks about this product, whether it is positive of
negative. The reason I chose this as a feature is that sometimes people will agree with
the review that he likes to see. For instance, if the customer is viewing a product that
he really wants to buy, he tends to agree with the review that support his idea. Plus, the
majority of the people who view the review want to buy such a product, so there might
be a relation between the reviewer’s attitude towards the product, which is the star
rating of the review, and the helpfulness of the review.
• Reviewer
The reviewer’s information includes two different features, one is the total
number of reviews that the reviewer wrote. To keep the result more accurate, this
feature is calculated within scope of the entire dataset that I have instead of the selected
average helpful score for each review. This feature is also calculated using the whole
dataset except the test set. In the data visualization, we can see that the average helpful
score should be a very effective feature. A review which is written by someone with
higher average review helpful score is more likely to be helpful review, and vice versa.
However, during the data processing, I found an issue with these features. Because I
exclude the test set when I was calculating the average helpful score, there are a great
number of reviewers in the test set that never wrote a review before. This means that
reviewer’s information of many new reviews will be 0, which is useless.
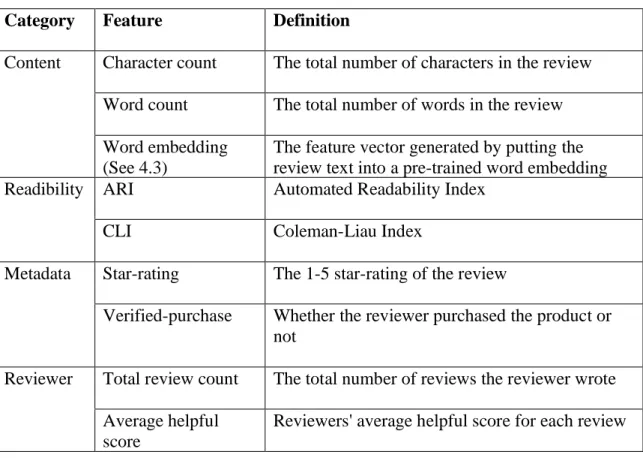
I listed all the features that I chose and their descriptions in Table 2.
Table 2: Category of features and their definitions
Category Feature Definition
Content Character count The total number of characters in the review
Word count The total number of words in the review
Word embedding (See 4.3)
The feature vector generated by putting the review text into a pre-trained word embedding Readibility ARI Automated Readability Index
CLI Coleman-Liau Index
Metadata Star-rating The 1-5 star-rating of the review
Verified-purchase Whether the reviewer purchased the product or not
Reviewer Total review count The total number of reviews the reviewer wrote
Average helpful score
Methods and Results
Baseline Model
For the baseline, I chose to use all the features that I had except the word embedding.
And I chose to build a random forest classifier. Random forests or random decision forests
are an ensemble learning method for classification, regression and other tasks that operate
by constructing a multitude of decision trees at training time and outputting the class that
is the mode of the classes (classification) or mean prediction (regression) of the individual
trees. Random decision forests correct for decision trees' habit of overfitting to their
training set. I put all the chosen features into a random forest classifier. I set 80% of the
dataset as the training and 20% as the test set, and I used a 10-fold cross validation to tune
the hyperparameters like the maximum depth of the random forest classifier to get the best
results. The baseline model provided an overall test accuracy of 60%. Table 3 is the detailed
resulting performance.
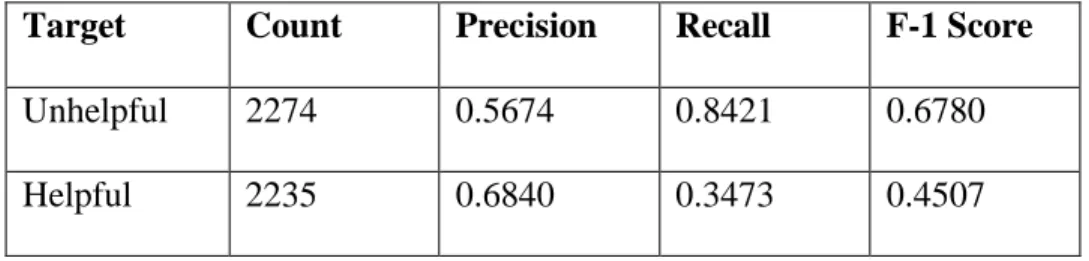
Table 3: Precision, recall, and F-1 score of the baseline model in the test set
Target Count Precision Recall F-1 Score
Unhelpful 2274 0.5674 0.8421 0.6780
Helpful 2235 0.6840 0.3473 0.4507
Interestingly, the baseline model achieved a much higher recall score for unhelpful
means is that this baseline model tent to predict any review as an unhelpful review. The
baseline mode is very biased and cannot be used in a real-world situation, but it serves well
as a baseline.
Feature Ablation Study
To determine which group of features could be helpful in predicting the helpfulness
of reviews, I built binary predictive models and ran several experiments. I performed a
feature ablation study to compare the accuracy of random forest classifiers built using
different feature groups, determined through ten-fold cross validation. The accuracy of
each model was compared with the others: a significant decrease in accuracy compared to
other models after removing a feature set indicate that the feature set is useful in predicting
review helpfulness.
I had three feature categories as the table before showed: 1) review content, that
includes the character count and the word count of the review, 2) readability of the review,
that includes the Automated Readability Index and the Coleman-Liau Index of the review,
3) metadata of the review, which includes the star-rating and the verified_purchase, and 4)
reviewer’s information, which consist of total number of the reviewer’s previous reviews
and the average review helpful score of the reviewer.
To examine the power of each feature category, I evaluated the performance of the
model on the same dataset testing and combining different feature categories. The results
showed the accuracy and the area under the ROC curve (Ghose & Ipeirotis, 2011). Table
4 shows the results for each feature subset.
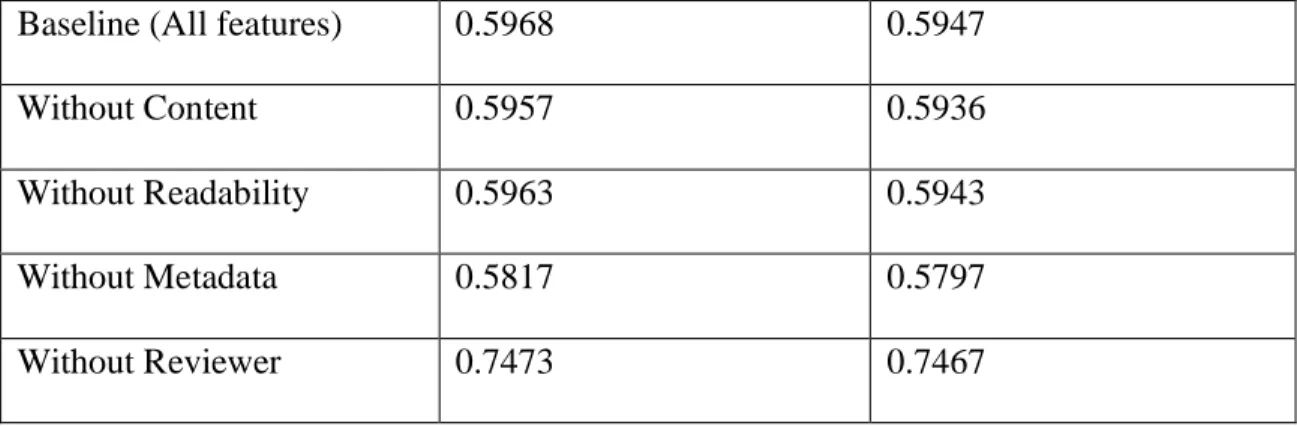
Table 4: Test accuracy and AUC of the same model using different feature sets.
Baseline (All features) 0.5968 0.5947
Without Content 0.5957 0.5936
Without Readability 0.5963 0.5943
Without Metadata 0.5817 0.5797
Without Reviewer 0.7473 0.7467
From the results in table 4, we can conclude that the least useful features are
reviewer’s information and readability features. So, I removed those features and continued
the experiment.
In order to further explore which of the feature is the most powerful one, I used
single feature from the best feature subset in terms of performance, which are “content’
and “metadata”, to do the modelling. For each of the feature, I used the same model, which
is random forest classifier with 10-fold cross-validation. Table 5 is the results of the models:
Table 5: Test accuracy and AUC of the same model using different feature set.
Features Test Accuracy AUC
Character count 0.6462 0.6457
Word count 0.6435 0.6439
Star-rating 0.7240 0.7231
Verified-purchase 0.5659 0.5663
Word Embedding & LSTM
For the content feature, I apply a method called word embedding. A word
have a similar representation. It is this approach to representing words and documents that
may be considered one of the key breakthroughs of deep learning on challenging natural
language processing problems.
Word embeddings are in fact a class of techniques where individual words are
represented as real-valued vectors in a predefined vector space. Each word is mapped to
one vector and the vector values are learned in a way that resembles a neural network, and
hence the technique is often lumped into the field of deep learning.
I first transformed the review text to a sequence of feature vector, then tried to do
the prediction task by traditional machine learning and deep learning. For the traditional
machine learning, I built a ridge regression. While for the deep learning, I chose to build a
LSTM model and a bi-directional LSTM model to do the prediction task.
• GloVe Embedding
After Mikolov et al. (2013) released the word2vec tool, there was a boom of articles
about word vector representations. One of the best of these articles is Stanford’s GloVe:
Global Vectors for Word Representation (Pennington et al., 2014), which explained
why such algorithms work and reformulated word2vec optimizations as a special kind
of factorization for word co-occurrence matrices.
GloVe, coined from Global Vectors, is a model for distributed word representation.
The model is an unsupervised learning algorithm for obtaining vector representations
for words. This is achieved by mapping words into a meaningful space where the
distance between words is related to semantic similarity. Training is performed on
aggregated global word-word co-occurrence statistics from a corpus, and the resulting
developed as an open-source project at Stanford. As log-bilinear regression model for
unsupervised learning of word representations, it combines the features of two model
families, namely the global matrix factorization and local context window methods.
• LSTM
Long short-term memory (LSTM) is an artificial recurrent neural network (RNN)
architecture used in the field of deep learning. Unlike standard feedforward neural
networks, LSTM has feedback connections. It can not only process single data points
(such as images), but also entire sequences of data (such as speech or video). For
example, LSTM is applicable to tasks such as unsegmented, connected handwriting
recognition, speech recognition and anomaly detection in network traffic or IDS's
(intrusion detection systems).
A common LSTM unit is composed of a cell, an input gate, an output gate and a
forget gate. The cell remembers values over arbitrary time intervals and the three gates
regulate the flow of information into and out of the cell.
LSTM networks are well-suited to classifying, processing and making predictions
based on time series data, since there can be lags of unknown duration between
important events in a time series. LSTMs were developed to deal with the vanishing
gradient problem that can be encountered when training traditional RNNs. Relative
insensitivity to gap length is an advantage of LSTM over RNNs, hidden Markov
models and other sequence learning methods in numerous applications.
In my research, I used 100-dimensional GloVe word embedding pre-trained on 6
billion words. For the raw review, the GloVe embedding covered 15.07% of the vocabulary
preprocessing to the raw data. First of all, I lowered all the text, and this helped me increase
the coverage of text a lot. Then I found that there are a lot of HTML tags in the text, so I
removed all the HTML tags. Last but not least, I removed all the URLs, punctuations and
words contains non-alphabets. Finally, with all the preprocessing, the Glove embedding
covered 70.24% of the vocabulary and 99.37% of the whole text. Although the vocabulary
coverage is not very high, the overall text coverage is high enough to let me move forward
to the modelling process.
Since the word embedding is perfect for deep learning model, LSTM is a perfect
fit in this problem. The LSTM model actually worked very well. A single LSTM layer in
the neural network provided an overall test accuracy of over 70%, which is much higher
than the baseline. And I also tried to use bidirectional LSTM, which is basically apply the
LSTM forward and backward to the same sequence of text. This slightly improved the
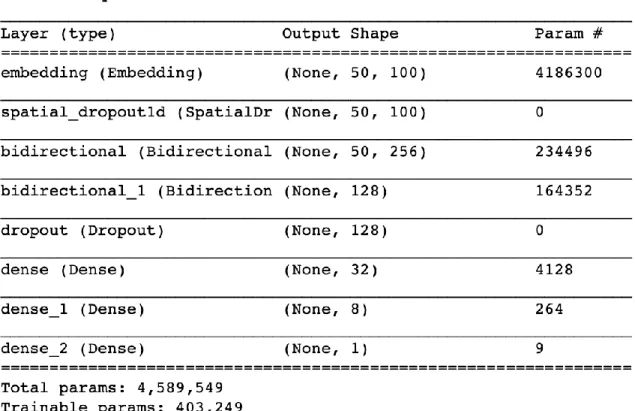
results but required much more time to do the training process. Figure below is the structure
of the deep learning models that I built. The sequences have different lengths and the model
prefers inputs to be vectorized and all inputs to have the same length. As a result, I padded
all input sequences and set different maximum length of the sequences to test the model.
75% of the reviews contains less than 220 words, so I first set the MAX_LEN to 220. Then
I tried to set the MAX_LEN to 50 to test the model’s performance, and only 25% of the
Figure 7: The structure of LSTM model.
Bidirectional Encoder Representations from Transformers (BERT)
I tried another deep learning model to utilized the content of the reviews to predict
the helpfulness called BERT. BERT (Bidirectional Encoder Representations from
Transformers) is a paper published by researchers at Google AI Language (Devlin et al.,
2018). It has caused a stir in the Machine Learning community by presenting
state-of-the-art results in a wide variety of NLP tasks, including Stanford Question Answering (SQuAD
v1.1 & v2.0), General Language Understanding Evaluation (GLUE) task set, Situations
With Adversarial Generations (SWAG), and others.
BERT’s key technical innovation is applying the bidirectional training of
Transformer, a popular attention model, to language modelling. This is in contrast to
previous efforts which looked at a text sequence either from left to right (like LSTM) or
combined left-to-right and right-to-left training (like bidirectional LSTM). Context-free
models such as word2vec (Mikolov et al., 2013) or GloVe (Pennington et al., 2014)
generate a single word embedding representation for each word in the vocabulary, where
BERT is deeply bidirectional. The paper’s results show that a language model which is
bidirectionally trained can have a deeper sense of language context and flow than
single-direction language models.
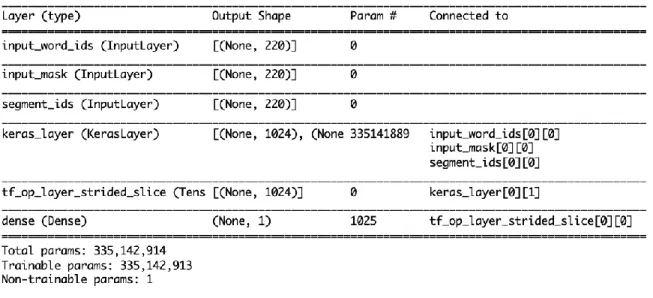
I my research, I tried some of the ideas used in the original paper:
• No pooling. I directly used the CLS embedding. The original paper uses the output
embedding for the [CLS] token when it is finetuning for classification tasks, such
as sentiment analysis. Since the [CLS] token is the first token in our sequence, I
simply took the first slice of the 2nd dimension from the tensor of shape (batch_size,
• No Dense layer. Simply add a sigmoid output directly to the last layer of BERT,
rather than experimenting with different intermediate layers.
• Fixed learning rate, batch size, epochs, optimizer. As specified by the paper, the
optimizer used is Adam, with a learning rate between 2e-5 and 5e-5. Furthermore,
they train the model for 3 epochs with a batch size of 32. I wanted to see how well
it would perform with those default values.
Figure 9 shows the structure of the BERT model.
Figure 9: The structure of bi-directional LSTM model.
I also did the same experiment as I did with the LSTM model, which is using
different MAX_LEN to train the same model. And the performance of the BERT model
shows that although using more sentence to train the model will increase the test accuracy,
setting MAX_LEN to 50 is sufficient for us to get a satisfying result.
Table 6: Test accuracy of different model
Model Test Accuracy
Random Guess 0.5000
LSTM: MAX_LEN = 220 0.7262
LSTM: MAX_LEN = 50 0.6916
Bi-LSTM: MAX_LEN = 220 0.7397
Bi-LSTM: MAX_LEN = 50 0.7149
BERT: MAX_LEN = 220 0.7834
Discussion
In this paper, I tried to build several models to predict the helpfulness of an Amazon
customer review. For the random forest classifier model, there are three different categories
of features related to a review: content, readability, and metadata. The best result of the
model utilized all of the available features and reached a test accuracy of 74.73% on the
Amazon electronics reviews dataset, which is very effective.
Among the three different feature categories, the most powerful and effective one
is the metadata because the model reached the best result when using a single feature
category. Within that category, the star-rating of the review seemed to be the most
informative feature for predicting review helpfulness. Korfiatis et al. (2012) found the
connection between positive rating value with high helpfulness of a review, however, they
also found that the results were significant only for reviews with ratings higher than three.
In my experiment, however, even the rating is under three stars, the performance of the
model using start-rating as a feature was still robust. One explanation could be the customer
who want to buy electronics tend to like positive reviews over negative reviews. And this
can be tested using a review data for different product categories, like books or cloths. The
other feature in the metadata set is verified-purchase, which is not a good feature along
according to the results of the model. However, adding it to the model and combine it with
the star-rating can help improving the model’s prediction performance.
The readability and the content of the review in the first experiment were not very
features in those two categories along or together could not give us a satisfying test
accuracy. Ghose and Ipeirotis (2011) found that an increase in the readability of reviews
has a positive and statistical impact on review helpfulness for audio-video products and
DVDs, they also discovered that the impact is quite mixed across different product
categories. But in my experiment, the dataset only contains one category of product, which
is electronics. As a result, the readability feature set was not effective in predicting the
review helpfulness. Huang and Chen (2015) found that the word count is not a significant
predictor of review helpfulness for top ranked reviewers and word count could only predict
review helpfulness when the word count was less than 145 words. However, in my dataset,
even the average word count (189) was higher than it, which could be the reason why word
count in my experiment was not a good feature.
The last set of features is the features related to the reviewers. Lee and Choeh (2018)
found that review helpfulness is largely determined by reviewers' capability of writing
helpful reviews, but review ratings do not influence the review helpfulness. Huang and
Chen (2015) found about reviewer characteristics: the reviewers' cumulative helpfulness
was the only reviewer characteristic that was a significant predictor of review helpfulness.
However, my findings are quite the opposite. In my experiment, I found that although the
distribution of the reviewers' cumulative helpfulness could be a very good feature, the
results showed that it is not. The primary reason behind it is because there are so many new
reviewers in the test set and no previous data can be used to feed the prediction model. This
can be explained by the famous “cold start” problem. The “cold start” problem concerns
the issue that the system cannot draw any inferences for users or items about which it has
order to avoid this problem in my experiment, I could have selected those reviews written
by those who have previous records in the database. However, I did not do that because I
wanted to mimic the real-world situation.
For the deep learning models in this paper, the results exceeded my expectations.
NLP has always been one of the hottest topics in ML. By transforming the text to a
sequence of feature vector by using word embedding, the deep learning model performed
very well. Simply using the content of the review, the model reached a test accuracy of
78.34%, which is even better than all the other features combine together in the first
experiment. This is remarkable because it solved the “cold start” problem of ML. In my
first experiment, the “cold start” problem is: if the review we want to predict is a new
review, and no other metadata or reviewer’s information related to it, it would be very hard
to use the random forest model we built. However, for the deep learning model, as long as
we have the review text, we can predict whether it will be a helpful review or not. However,
it took so much computing power and memory space to train a deep learning model like
BERT than a traditional ML model like random forest, especially when applying to the
real-world situation when the amount of data is huge.
Another interesting finding in the deep learning model is that, even only 25% of
the review are shorter than 50 words, setting the maximum length to 50 gave us a fairly
good test result. One possible explanation to this is that people tend to determine if it is a
good review while reading the first couple of sentences. For a longer review, people might
not have the patient to read till the end to decide whether it is helpful or not. Another
explanation is that the quality of the first couple of sentences of helpful reviews might be
Conclusion
In this paper, I conducted two major experiments in attempt to predict whether an
Amazon customer’s review is helpful or not. I used online customer review dataset of
electronics published by Amazon.com and generated various features from it. I built two
different models to do the prediction task. For the first model, I used four different
categories of features and examined their effectiveness by comparing the results of a single
model using different feature set. Some of the previous research supported my findings
while others seemed to have different results due to the potential difference between our
dataset.
First of all, the helpfulness of online customer reviews for electronics are not related
to the readability of the review headline and review content. Using readability features like
Automated Readability Index or the Coleman-Liao Index to predict the helpfulness of a
review is no better than a random guess. Although this finding is different from the research
of Ghose and Ipeirotis (2011), the reason behind it is that the dataset we use is very different.
Secondly, I found that basic content related features of the review such as character
count and word count are not very effective in predicting the helpfulness of an online
customer review. The quality of the review is not determined by how elaborate the review
is or how concise the review is.
Thirdly, I found that some meta-features of the review such as the star-rating is
super helpful in my first model. In electronics review, people seemed to agree with the
is that most people who view the reviews really want to buy the product, so they tend to
agree with those positive reviews. On the other hand, I found that meta-features like
verified-purchase is irrelevant to the helpfulness of the review at all. It is very interesting
that people actually do not care whether the reviews purchased the product before or not.
Last but not least, I found that in the real-world situation, the features related to the
reviewer cannot be used as a good indicator in the prediction of review helpfulness. It is
because of the “cold start” problem, which is a potential problem in computer-based
information systems which involve a degree of automated data modelling. In the data
visualization, I found that reviews written by those who always provide high quality
reviews are also more likely to be good reviews. However, in modelling experiment, I
found that if the reviewer has never provided any records or very few records, the
reviewer’s information would be useless, and the helpfulness prediction results were not
better than random guess. As a result, we cannot use the reviewer’ information to predict
the helpfulness of their reviews if they are new users.
In my second model, which is the deep learning model, I used only the review text
as the feature to predict the helpfulness of an online customer review and reached a very
promising test accuracy. This is exciting because with this model, we can predict the
helpfulness of a newly created review, without needing of any other metadata of the review.
This could help us solve the “cold start” problem of machine learning. The experiment of
maximum length in this model also showed us that we did not need the whole text of the
review to predict the helpfulness of a review. With only a couple of sentences of the review,
we can get a fairly acceptable test accuracy. This can save us a lot of training time and
results of this experiment showed us that maybe the first few sentences are the key point
of a helpful review.
The results of this paper can be used to help online shopping platform the improve
their review ranking and help customers in their online shopping decision making process.
For instance, instead of sorting the review chronologically by default, online shopping
platforms can create an algorithm to sort the reviews by their helpfulness to guide their
customers. And this can also encourage customer to write more helpful reviews because
the people who like to write reviews often like their opinions to be viewed. Thus, ranking
reviews by helpfulness can encourage those people to continuously write high quality
reviews.
There are also many limitations in this paper. In this paper, I only used online
review of electronics, which is too narrow. Future work can be done in applying my
methods to different product categories and even mixed categories. The second limitation
about the dataset is that I only used online customer from Amazom.com. Although Amazon
is the biggest online shopping platform, there are many other platforms like BestBuy. As a
result, future research could extend the work that I done to different dataset or mixed
dataset from various online shopping platforms to see if my work is generalizable. Thirdly,
the way I sample the dataset in order to balance the helpful and unhelpful reviews is
effective in the experiment, but not in reality. As a result, applying the same method in a
real-world dataset might get very different results. Last, I calculated the helpfulness of the
review by using the data from the database of Amazon.com. Baek and Ahn (2012) pointed
out that the helpful votes in the database might not be an accurate indicator of the
collected. For instance, surveys and interviews can be done to create a more accurate
Reference
Alreck, P.l. & Settle, r.B. (1995) The importance of word-of-mouth communications to
service buyers. Proceedings of American Marketing Association, Winter, pp.
188-193.
Archak, N., Ghose, A., & Ipeirotis, P. G. (2011). Deriving the pricing power of product features by mining consumer reviews. Management science, 57(8), 1485-1509.
Arndt, J. (1967) role of product-related conversations in the diffusion of a new product.
Journal of Marketing Research, 4(3), pp. 291-295.
Baek, H., Ahn, J., & Choi, Y. (2012). Helpfulness of online consumer reviews: Readers'
objectives and review cues. International Journal of Electronic Commerce, 17(2),
99-126.
Bickart, B. & Schindler, r.M. (2001) Internet forums as influential sources of consumer
information. Journal of Interactive Marketing, 15(3), pp. 31-40.
Cao, Q., Duan, W., & Gan, Q. (2011). Exploring determinants of voting for the “helpfulness” of online user reviews: A text mining approach. Decision Support
Systems, 50(2), 511-521.
Chen, H. N., & Huang, C. Y. (2013). An investigation into online reviewers' behavior.
Chen, P. Y., Dhanasobhon, S., & Smith, M. D. (2008). All reviews are not created equal:
The disaggregate impact of reviews and reviewers at amazon. com. Com (May
2008).
Chen, P. Y., Wu, S. Y., & Yoon, J. (2004). The impact of online recommendations and consumer feedback on sales. ICIS 2004 Proceedings, 58.
Cheung, C. M. Y., Sia, C. L., & Kuan, K. K. (2012). Is this review believable? A study of factors affecting the credibility of online consumer reviews from an ELM
perspective. Journal of the Association for Information Systems, 13(8), 618.
Chintagunta, P. K., Gopinath, S., & Venkataraman, S. (2010). The effects of online user
reviews on movie box office performance: Accounting for sequential rollout and
aggregation across local markets. Marketing Science, 29(5), 944-957.
Devlin, J., Chang, M. W., Lee, K., & Toutanova, K. (2018). Bert: Pre-training of deep
bidirectional transformers for language understanding. arXiv preprint
arXiv:1810.04805.
Forman, C., Ghose, A., & Wiesenfeld, B. (2008). Examining the relationship between
reviews and sales: The role of reviewer identity disclosure in electronic markets.
Information Systems Research, 19(3), 291-313.
Gunning, R. (1969). The fog index after twenty years. Journal of Business Communication,
6(2), 3-13.
Hu, N., Bose, I., Koh, N. S., & Liu, L. (2012). Manipulation of online reviews: An analysis
of ratings, readability, and sentiments. Decision Support Systems, 52(3), 674-684.
Huang, A. H., Chen, K., Yen, D. C., & Tran, T. P. (2015). A study of factors that contribute
Hong, Y., Lu, J., Yao, J., Zhu, Q., & Zhou, G. (2012, August). What reviews are
satisfactory: novel features for automatic helpfulness voting. In Proceedings of the
35th International ACM SIGIR Conference on Research and Development in
Information Retrieval (pp. 495-504). ACM.
Jiménez, F., & Mendoza, M. (2013). Too popular to ignore: The influence of online
reviews on purchase intentions of search and experience products. Journal of
Interactive Marketing, 27(3), 226-235.
Korfiatis, N., Rodríguez, D., & Sicilia, M. A. (2008, September). The impact of readability
on the usefulness of online product reviews: a case study on an online bookstore.
In World Summit on Knowledge Society (pp. 423-432). Springer, Berlin,
Heidelberg.
Kostyra, D. S., Reiner, J., Natter, M., & Klapper, D. (2016). Decomposing the effects of
online customer reviews on brand, price, and product attributes. International Journal of Research in Marketing, 33(1), 11-26.
Krishnamoorthy, S. (2015). Linguistic features for review helpfulness prediction. Expert
Systems with Applications, 42(7), 3751-3759.
Kumar, N., & Benbasat, I. (2006). Research note: the influence of recommendations and
consumer reviews on evaluations of websites. Information Systems Research, 17(4), 425-439.
Lee, S., & Choeh, J. Y. (2018). The interactive impact of online word-of-mouth and review
helpfulness on box office revenue. Management Decision, 56(4), 849-866.
Liu, X., Croft, W. B., Oh, P., & Hart, D. (2004, July). Automatic recognition of reading
SIGIR Conference on Research and Development in Information Retrieval (pp.
548-549). ACM.
Mc Laughlin, G. H. (1969). SMOG grading-a new readability formula. Journal of Reading,
12(8), 639-646.
Mikolov, T., Sutskever, I., Chen, K., Corrado, G. S., & Dean, J. (2013). Distributed
representations of words and phrases and their compositionality. In Advances in
neural information processing systems (pp. 3111-3119).
Mudambi, S. M., & Schuff, D. (2010). What makes a helpful review? A study of customer
reviews on Amazon. com. MIS Quarterly, 34(1), 185-200.
Park, D., and Lee, J. (2008). eWOM overload and its effect on consumer behavioral
intention depending on consumer involvement. Electronic Commerce Research
and Applications, 7(4), 386-398.
Pennington, J., Socher, R., & Manning, C. D. (2014, October). Glove: Global vectors for
word representation. In Proceedings of the 2014 conference on empirical methods
in natural language processing (EMNLP) (pp. 1532-1543).
Sridhar, S., & Srinivasan, R. (2012). Social influence effects in online product ratings. Journal of Marketing, 76(5), 70-88.
Sun, T., Youn, S., Wu, G. & Kuntaraporn, M. (2006) Online word-of-mouth (or mouse):
an exploration of its antecedents and consequences. Journal of Computer-
Mediated Communication, 11(4), available at http://jcmc.indiana.edu/vol11/issue4/
Wu, P. F., Van Der Heijden, H., & Korfiatis, N. (2011, August). The influences of
negativity and review quality on the helpfulness of online reviews. In International
Appendix A
Figure 1: Number of helpful reviews vs. number of unhelpful reviews in the original dataset.
Figure 3: Distribution of star-rating in helpful reviews and unhelpful reviews.
Figure 5: Distribution of character count in helpful reviews and unhelpful reviews.
Figure 6: Distribution of character count in helpful reviews and unhelpful reviews.