PATTERN AND PROCESS IN RARE PLANT CONSERVATION:
AN ASSESSMENT OF THE SOUTHEASTERN U.S.
Sarah E. Marcinko
A thesis submitted to the faculty of the University of North Carolina at Chapel Hill in partial fulfillment of the requirements for the degree of Master of Science in the
Curriculum of Ecology
Chapel Hill 2007
Approved by:
ABSTRACT
Sarah E. Marcinko: Pattern and Process in Rare Plant Conservation: An Assessment of the Southeastern United States
(Under the direction of Peter S. White)
The development of conservation policy for rare plant species is informed by
large-scale patterns of distribution and abundance as well as the processes that generate them.
I collected data on 224 rare vascular plants in the Southeastern U.S. to characterize patterns
of rarity at ecoregional scales, among broad habitat types, and with respect to taxonomic
group size. Rare species diversity is highest in Appalachian/Blue Ridge Forests and
Southeastern Conifer Forests ecoregions. Most rare plants are concentrated in woodland and
glade habitats and larger taxonomic groups.
A case-study experimental approach was adopted to explore the significance of
reproductive biology in the persistence of a globally imperiled Southeastern endemic plant,
Ptilimnium nodosum. The species has a phenologically regulated mixed mating system
dependent on insect-mediated pollination. Moderate reproductive output and high seed
germinability suggest environmental conditions, not mating system, play a critical role in
regulating the species’ distribution and abundance, and favor high immediate fitness gained
ACKNOWLEDGMENTS
This thesis benefited appreciably from the support of many people. I first want to
thank Johnny Randall at the North Carolina Botanical Garden whose patience, enthusiasm,
and pragmatism guided me through some of the more challenging moments of this project.
He never hesitated to give me his time when I needed it most and his support of this research
was resolute. Peter White, my committee chair, was one of the reasons I came to UNC in the
first place. I respect his conservation vision and limitless ability to generate new ideas. Dean
Urban at Duke University has an enviable clarity of thought and elegant approach to
ecological research that truly amazes me. His insight and explanatory power were refreshing
and helped renew my commitment to this thesis. Bob Peet, chair of the Ecology Curriculum,
has been an advocate on my behalf for financial assistance and research support. I also owe
my gratitude to Alan Weakley, curator of the UNC herbarium, for his unparalleled and
invaluable taxonomic knowledge. I thank him for sharing his data with me without which a
considerable part of this thesis would not have been possible. Mark Schlessman at Vassar
College, who reviewed a manuscript generated from this thesis, provided helpful comments
and constructive feedback.
I want to thank both my peers in the Ecology Curriculum and the Plant Ecology Lab,
all of whom enriched my life and research. In particular, I want to acknowledge Lee Anne
Jacobs and Jen Costanza for their insight and collaboration on all things rare and ecological.
Carolina Botanical Garden staff who in no way hesitated to be but the greatest of assistance.
I want to thank my husband and family for their love, wisdom, and hopefulness.
Finally, I want to thank all of the organizations and institutions that provided essential
financial support, including the University of North Carolina’s Center for the Study of the
American South, Biology Department, Ecology Curriculum, and the North Carolina
Botanical Garden. Funding was also provided by the Center for Plant Conservation, the
TABLE OF CONTENTS
LIST OF TABLES ... viii
LIST OF FIGURES ... ix
Chapter
I.
Combining pattern and process
in conservation planning ...1
References... 5
II.
Patterns in rarity among vascular
plant species in the Southeastern
United States ...7
Abstract ... 7
Introduction... 8
Methods... 10
Data Collection... 10
How are rare species distributed in the Southeast? ... 12
Are rare plants clustered within particular habitat types?... 13
How is rarity distributed among taxonomic groups? ... 14
Data analysis ... 14
Results... 15
How are rare species distributed in the Southeast? ... 15
Are rare plants clustered within particular habitat types?... 16
How is rarity distributed among taxonomic groups? ... 16
Discussion ... 17
Phytogeography and plant ecology of rarity ... 17
Taxonomic patterns of rarity ... 22
III.
Conservation implications of mating systems,
floral phenology, and sexual expression in the
federally endangered Ptilimnium nodosum
(Apiaceae)... 39
Abstract ... 39
Introduction... 40
Methods... 43
Study species ... 43
Sampling ... 45
Floral phenology and sex expression ... 45
Mating systems... 47
Germination rate... 48
Data analysis ... 49
Results... 49
Floral phenology and sex expression ... 49
Mating systems... 51
Germination rate... 53
Discussion ... 53
Consequences of floral attributes ... 53
Implications for conservation ... 55
Conclusions... 57
References... 67
IV.
Conclusions, synthesis, and
future directions ... 72
Challenges and remaining questions... 74
Appendices... 77
LIST OF TABLES
Table Page
2.1 Rare species diversity among Southeastern terrestrial ecoregions. 30
2.2 The number of rare and native plants found in Southeastern habitats. 31
2.3
State occurrences of rare, endemic, and federally listed vascular plant
species. 32
2.4
Counties with exceptional rare floras within Southeastern terrestrial
ecoregions. 33
3.1
Pollination treatments performed in the breeding system study of
Ptilimnium nodosum. 64
3.2 Stage-based floral phenology for Ptilimnium nodosum. 65
3.3
Relative synchrony in male and female sexual phases that represent
LIST OF FIGURES
Figure Page
2.1
Geographic area of analysis for the Southeastern U.S., including state and
ecoregional boundaries. 24
2.2
Scatter diagrams for the number of species per county area for Southeastern
terrestrial ecoregions. 25
2.3
A scatter diagram for the number of rare species per habitat type in the
Carolinas. 26
2.4
A frequency histogram of the number of rare plants per plant family for the
Southeast. 27
2.5 Stacked histograms of rare species distribution among plant families. 28
2.6 A scatter diagram for the number of rare species per family size. 29
3.1 Opportunities for geitonogamy within a flowering stalk. 60
3.2 Variation in sex expression among sequentially blooming umbel orders. 61
3.3 Mean seed set among different pollination treatments. 62
3.4
Variation in mean seed set among sequentially blooming umbel orders in
I. COMBINING PATTERN AND PROCESS IN CONSERVATION PLANNING
Conservation biology is a discipline with a deadline (Ricketts et al., 1999a).
Human-induced environmental changes are occurring at a rapidly increasing pace and have severely
impacted species diversity and composition. The accelerating and widespread loss of species
is unprecedented (Thomas et al., 2004) and the task of conserving biodiversity is considered
to be one of the most important global environmental challenges today. The scale of loss is
daunting and most conservationists have recognized the need for prioritizing areas for
conservation to make recovery and protection efforts more efficient and effective, often
before all relevant data is collected.
Conservation strategies have largely focused on patterns of diversity, specifically how
to maximize the number of species that can be protected within a particular geographic
region. Species inventory data are fundamental to the development of conservation plans or
“portfolios,” which represent the full array and diversity of native species, communities and
ecosystems within an area (TNC, 2004). The criteria for identifying areas of highest
conservation value is wide-ranging and includes high species richness (Ricketts et al.,
1999a), endemism (Meyers et al., 2000; Hobohm, 2003), rarity (Prendergast et al., 1993),
endangerment (Dobson et al., 1997), unique phylogenies (Mace et al., 2003) and
evolutionary histories (Sechrest et al., 2002), and degree of threat (Wilcove et al., 1998;
conservation targets captured by portfolios. Nonetheless, the reliance on threatened species
lists or the identification of biodiversity patterns for the delineation of conservation areas
often fail to address the ecological and evolutionary mechanisms that produced the patterns
in the first place (Smith et al., 1993). The “flux of nature” (Pickett et al., 1992) ensures that
the presence of a species at risk in a protected area does not guarantee its conservation.
Dynamic natural processes in ecological communities and human-caused environmental
impacts can lead to species turnover and loss even in areas set aside for conservation.
Ensuring the viability of target species will often require more active management.
Conservation of rare species must be guided by the biological attributes of the taxon, yet the
lack of basic biological data has been implicated in the failure of many recovery plans,
especially for plants (Pavlik, 1994; Schemske et al., 1994; Schultz and Gerber, 2002). What
constitutes the most critical biological information has been the subject of much debate
(Schemske et al., 1994). Most scientists will agree on the importance of incorporating
ecological, genetic, and evolutionary processes in conservation and studies of autecology,
demography, and reproductive biology abound.
In this thesis, I seek to combine conservation strategies of pattern and process.
Specifically, I aim to identify patterns in rare plant species and natural areas of high
conservation value as well as take a closer look at the fundamental processes responsible for
maintaining diversity patterns. My focus is the Southeastern United States, an ecologically
complex region rich in biological diversity. It is also a region that has undergone substantial
environmental change, resulting in the loss of globally distinct habitats and communities
In the second chapter, I explore several patterns of rarity in the Southeast flora with
respect to geography, ecology, and taxonomy. Here, rarity is a surrogate for extinction risk
and is delimited by global conservation status ranks. To streamline and facilitate
conservation efforts I use Natural Heritage program data to compile detailed information on
224 rare species. Specifically, I ask three questions: 1) How are rare plants distributed at the
state and ecoregional scales? 2) Are rare plants clustered within particular habitat types?
And, 3) How is rarity distributed among taxonomic groups? I show that rarity among plants
is not randomly distributed across the Southeast and discuss some of the ecoregions, habitat
types, and plant families that contain unusually high number of rare species.
In chapter 3, I take a case-study approach to address reasons for rarity and persistence
in a federally endangered plant, Ptilimnium nodosum by examining the species’ reproductive
biology. Studies of reproductive biology are critical to the effective conservation and
management of rare and endangered species (Hamrick et al., 1991; Karron, 1991; DeMauro,
1993; Weller, 1994). Demographic trends (survival, growth, and reproduction) directly
influence population dynamics and biological/conservation status. Furthermore, differences
in mating patterns can influence the amount and genetic structure within a species, which are
believed to affect the evolutionary potential of a species and ability to adapt to a changing
environment.
In addition to determining the mating system of P. nodosum, I examine the role of
floral phenology and differential sex expression in regulating opportunities for mating. I
show that the limited distribution and abundance observed in P. nodosum may not be a total
consequence of its reproductive biology. The species is restricted to a unique and uncommon
environmental conditions, not mating system, may play a central role in population
dynamics.
Finally, in the fourth chapter I combine the results from each chapter to discuss the
application of this research to the conservation of Southeastern rare plants at landscape and
local scales. I demonstrate how the identification of patterns of rarity in this region
complement and improve upon other research contributions concerning plant conservation in
the Southeast. I also discuss current management plans and ongoing research objectives for
References
ABBITT, R.J.F., J.M. SCOTT, AND D.S. WILCOVE. 2000. The geography of vulnerability: incorporating species geography and human development patters into conservation planning. Biological
Conservation 96: 169-175.
DEMAURO, M. 1993. Relationship of breeding system to rarity in the lakeside daisy (Hymenoxys acaulis var. glabra). Conservation Biology 7: 542-550.
DOBSON, A.P., J.P. RODRIQUEZ, W.M. ROBERTS, AND D.S. WILCOVE. 1997. Geographic distribution of endangered species in the United States. Science 275: 550-553.
HAMRICK, J.L., M.J.W. GODT, D.A. MURAWSKI, AND M.D. LOVELESS. 1991. Correlations between species traits and allozyme diversity: implications for conservation biology. In D.A. Falk and K.E. Holsinger [eds.], Genetics and Conservation of Rare Plants 75-86. Oxford University Press, New York, NY.
HOBOHM, C. 2003. Characterization and ranking of biodiversity hotspots: centres of species richness and endemism. Biodiversity and Conservation 12: 279-287.
KARRON, J.D. 1991. Patterns of genetic variation and breeding systems in rare plant species. In D.A. Falk and K.E. Holsinger [eds.], Genetics and Conservation of Rare Plants 87-98. Oxford University Press, New York, NY.
MACE, G.M., J.L. GITTLEMAN, AND A. PURVIS. 2003. Preserving the tree of life. Science 300: 1707-1709.
MYERS, N., R.A. MITTERMEIER, C.G. MITTERMEIER, G.A.B. DA FONSECA, AND J. KENT. 2000. Biodiversity hotspots for conservation priorities. Nature 403: 853-858.
PAVLIK, B.M. 1994. Demographic monitoring and the recovery of endangered plants. In M.L. Bowles and C.J. Whelan [eds.], Restoration of Endangered Species 322-350. Cambridge University Press, Cambridge, MA.
PICKETT, S.T.A., V.T. PARKER, AND P.L. FIEDLER 1992. The new paradigm in ecology: implications for conservation biology above the species level. Conservation biology: the theory and practice of nature conservation, preservation, and management 65-88. Chapman and Hall, New York, NY.
PRENDERGAST, J.R., R.M. QUINN, J.H. LAWTON, B.C. EVERSHAM, AND D.W. GIBBONS. 1993. Rare species, the coincidence of diversity hotspots and conservation strategies. Nature 365: 335-337.
RICKETTS, T.H., E. DINERSTEIN, D.M. OLSON, AND C. LOUCKS. 1999a. Who's where in North America? BioScience 49: 369-381.
RICKETTS, T.H., E. DINERSTEIN, D.M. OLSON, C.J. LOUCKS, W. EICHBAUM, D. DELLASALA, K. KAVANAGH, P. HEDAO, P.T. HURLEY, K.M. CARNEY, R. ABELL, AND S. WALTERS 1999b. Terrestrial ecoregions of North America: a conservation assessment. Island Press, Washington, D.C.
SCHEMSKE, D.W., B.C. HUSBAND, M.H. RUCKELSHAUS, C. GOODWILLIE, I.M. PARKER, AND J.G. BISHOP. 1994. Evaluating approaches to the conservation of rare and endangered plants. Ecology 75: 584-606.
PURVIS, A.B. RYLANDS, AND J.L. GITTLEMAN. 2002. Hotspots and the conservation of
evolutionary history. Proceedings of the National Academy of Sciences of the United States of America 99: 2067-2071.
SMITH, T.B., S. KARK, C.J. SCHNEIDER, R.K. WAYNE, AND C. MORITZ. 2001. Biodiversity hotspots and beyond: the need for preserving environmental transitions. Trends in Ecology and Evolution 16: 431.
THOMAS, J.A., M.G. TELFER, D.B. ROY, C.D. PRESTON, J.J.D. GREENWOOD, J. ASHER, R. FOX, R.T. CLARKE, AND J.H. LAWTON. 2004.Comparative losses of British butterflies, birds, and plants and the global extinction crisis. Science 303: 1879-1881.
II. PATTERNS IN RARITY AMONG VASCULAR PLANT SPECIES IN THE
SOUTHEASTERN UNITED STATES
Abstract
The objective of this research is to examine geographic, ecological, and taxonomic
patterns in rarity among plants in the Southeastern United States in an attempt to inform and
facilitate on-going conservation efforts. I collected data on 224 rare vascular plant species
carrying a global conservation rank of G1-G2G3 to assess the distribution of rare plants at
state and ecoregional scales. I show that Southeastern Conifer Forests and Appalachian/Blue
Ridge Forests are especially rich in rare species. A closer examination of species-area
relationships reveals several counties with unexpectedly high numbers of rare plants. I also
explore the representation of rare plants in broad habitat types across the Southeast. Using a
habitat classification scheme unique to the Carolinas, I then determine if species are
over-represented in particular habitat types. Across the Southeast, rare plants are overwhelming
distributed in woodland and glade habitats, particularly calcareous glades, woodlands, and
prairies. In the Carolinas, rare plants were over-represented in Coastal Plain blackwater
bottomlands and wet savannas and flatwoods. Finally, I examine the distribution of species
within families and show that most Southeastern plant families only have three rare plants or
less and small plant families consistently contain fewer rare species. Several families were
Together, these patterns suggest a high degree of predictability in the distribution of rare
plants within the Southeast.
Introduction
There are over 4500 native vascular plant species in the Southeastern United States
(Stein et al., 2001). Within the USA, the Southeast ranks among the top “hotspots” in terms
of native plant (Ricketts et al., 1999a; Qian, 1999; Stein et al., 2001) and ecosystem diversity
(Noss et al., 1995; White et al., 1998). While considerable effort has been made in
describing regional biodiversity patterns with respect to broad and small scale environmental
variation, a glacier-free evolutionary history, and historical disturbance regimes (Delcourt
and Delcourt, 1998; White et al., 1998; White and Miller, 1998), these mechanisms also
provide a valuable opportunity to examine patterns in regional rarity and can potentially
inform the on-going process of plant conservation in the Southeast.
Regional studies of rarity in the Southeastern U.S. have predominantly explored
patterns of plant endemism. Estill and Cruzan (2001) compiled county-level distribution data
on 482 endemic species to identify regional centers of endemism. They found that endemic
species also tend to be regionally rare and demonstrated geographic clumping of endemics.
Similarly, Loehle (2006) expands on the work of Estill and Cruzan (2001) to describe
hotspots of endemism with regard to habitat types. He comments on the concentration of
endemics in, among others, pine flatwoods, sandhills, and savannahs in the mid-Atlantic
Coastal Plain as well as the cedar glades in the Central Basin of Tennessee and granite
outcrops throughout the Piedmont Plateau. Others have assessed rarity and endangerment in
habitats, including coastal plain wetlands (Sutter and Kral, 1994; Edwards and Weakley,
2001; Sharitz, 2003), hardwood forests (Imm et al., 2001), peat bogs (Stewart and Nilsen,
1993), glades and prairies (Platt, 1951; Baskin et al., 1995; Allison and Stevens, 2001;
Baskin and Baskin, 2003; Lawless et al., 2006), and longleaf pine forests (Walker, 1993;
Gray et al., 2003).
Most rare plants in the Southeast are naturally rare (Rabinowitz, 1981; Owen, 2002),
although many factors influence the rarity of species (Fiedler, 1986; Fiedler and Ahouse,
1992), including their ecology, population biology, and taxonomy. More recently,
considerable effort has been spent investigating whether rare species are randomly
distributed among taxa in an attempt to better understand processes that lead to rarity
(Domínguez Lozano and Schwartz, 2005) and forecast which species are most vulnerable to
extinction (Schwartz, 1993; Edwards, 1998; Edwards and Westoby, 2000). If rarity is
clustered in particular groups, it suggests that predisposition to rarity may be governed by
intrinsic characteristics (e.g. taxon size) and attention should be directed to those species
within groups with high rates of rarity that are not presently threatened (Lockwood et al.,
2002; Pilgrim et al., 2004).
Identifying patterns of rarity and vulnerability, particularly at scales relevant to
conservation planning, is becoming increasingly important in light of current rates of
biodiversity losses (Abbitt et al., 2000; Pearman et al., 2000). The Southeast heads the list of
the highest number of endangered ecosystems of any region in the country (Noss et al. 1995;
Stein et al., 2001; Owen, 2002). Rapid population growth, development, and loss of
biologically rich communities in the Southeast have significantly affected the distribution
population size, occurrence, and geographic extent (Wilcove et al., 1998). Here, in an
attempt to streamline and facilitate conservation efforts, I use a database of rare species in the
U.S. to describe several patterns of rarity in the Southeast flora by addressing the following
questions:
(1) How are rare plants distributed at state and ecoregional scales?
(2) Are rare plants clustered within particular habitat types?
(3) How is rarity distributed among taxonomic groups?
Methods
Data Collection
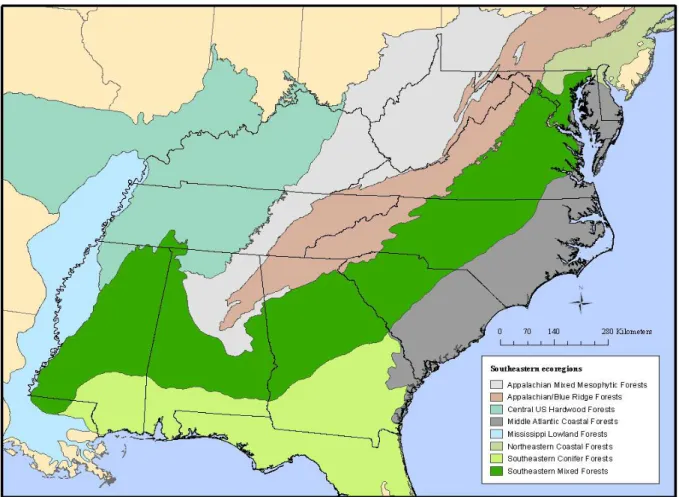
The geographic extent for the Southeast used in this study follows the coverage area
reported in Weakley (2006) and includes the Carolinas, Virginia and D.C., West Virginia,
Maryland, Delaware, Kentucky, Tennessee, Alabama, Mississippi, the Florida Panhandle and
Northeastern Florida (Fig. 2.1).
A database of Southeastern rare vascular plant species was compiled using Natural
Heritage Program data available through NatureServe (www.natureserve.org). Initially
developed by the Nature Conservancy, NatureServe assesses species vulnerability on several
criteria, including occurrence and extent of occurrence, population size, geographic range,
trends in population status (short- and long-term), listed threats, intrinsic vulnerability, and
the number of protected populations (Master et al., 2001; Andelman et al., 2004). The
Natural Heritage ranking system is a reliable protocol for identifying vulnerable species
(Master et al., 2001; Andelman et al., 2004; Keith et al., 2004) and NatureServe is considered
2004; Mills and Schwartz, 2005). Although NatureServe ranks have no official role in the
federal listing of species in the United States, they do provide a more accurate assessment of
species endangerment (Master et al., 2001) and inform management decisions for private and
public organizations, government agencies, academia, and the general public (Regan et al.,
2004).
There are many ways to describe rarity (Kunin and Gaston, 1993) and many factors
operating at a range of spatial scales may determine the abundance or rarity of species
(Schemske et al., 1994). For the purpose of this analysis and within the NatureServe
database, rarity is a surrogate for extinction risk and is delimited by conservation status ranks
available at the global, national, and subnational scale; here, rare species were assessed at the
global level (G). All species carry a rank on a one-to-five scale, ranging from critically
imperiled (G1) to common, secure species (G5). Conservation ranks are primarily based on
the number of occurrences of a species and the degree to which threats are perceived.
However, distinguishing species that are intrinsically rare from those that have become rare
due to human activities is not possible (Stein et al., 2001) as most rare species are
predisposed to threat on account of habitat specialization, small population size, or narrow
geographic distribution (Rabinowitz, 1981; Kruckeberg and Rabinowitz, 1985). The scope
of this analysis includes G1 and G2 (imperiled) species, which are found in <5 and 6-20
populations worldwide, respectively. Species with ranks listed as G2G3 were also included
(<100 populations). Historically occurring species (GH) and those presumed extinct (GX),
however, are omitted since the intent of this paper is to provide current trends and
Taxonomic classification of the NatureServe database follows Kartesz (1999) although
botanical nomenclature follows Weakley (2006) for the area of analysis. Rare infraspecies
are included in analyses, but questionable taxa not recognized by Weakley were omitted.
Similarly, recent taxonomic revisions that have resulted in changes in global conservation
status ranks higher than G2G3 were also excluded. Consequently, a total of 224
Southeastern rare plants were the basis for all subsequent analyses. For each species, I
collected information regarding taxonomy, geographic range, conservation status, and
ecological attributes.
How are rare species distributed in the Southeast?
To examine species distribution patterns and endemism across the Southeast, I first
examined the aggregation of rare plants at the state scale. While many political and social
decisions regarding rare plant management occur at this level, states are, of course, artificial
constructs on larger, ecological landscapes (Master et al., 2001). More recently, the
conservation community has been leading conservation efforts beyond state boundaries in
order to capture both vulnerable species and ecological communities (TNC, 1996). An
ecoregion based approach targets geographically distinct assemblages of natural communities
that, to a large degree, share species, dynamics, and environmental conditions (Ricketts et al.,
2001). Accordingly, using data compiled by Ricketts and others (1999b), in addition to
county and ecoregional spatial data, I used a GIS to classify the 224 rare plants of this
analysis into eight terrestrial ecoregions (Fig. 2.1; Table 2.1). To examine the effect of area
on rare species diversity patterns at a finer resolution, I used species distribution data at the
county level from Weakley (2006), USDA PLANTS (2006), and NatureServe databases
number of rare species vs. county area were then performed for each ecoregion. Those
counties located in ecoregions not well-represented in the area of analysis (Mississippi
Lowland Forests and Northeastern Coastal Forests) were combined into ecoregions most
similar in composition.
Are rare plants clustered within particular habitat types?
Ecological information was used to assign rare plants to one of the 29 habitats defined
by Weakley (2005) for the 3301 native plant species of the Carolinas. This classification
scheme is based on vegetation classification data from Schafale and Weakley (1990),
NatureServe (2003; 2005), Faber-Langendoen and Tart (2001), and the Carolina Vegetation
Survey (2005). Each habitat consists of distinct species assemblages. Weakley (2005) also
lists a ruderal habitat with 264 native taxa and the habitat for 41 species was not determined,
but given that no rare species within the Southeast including the Carolinas fell within these
categories, they were omitted (see Appendix II for habitat delimiting criteria).
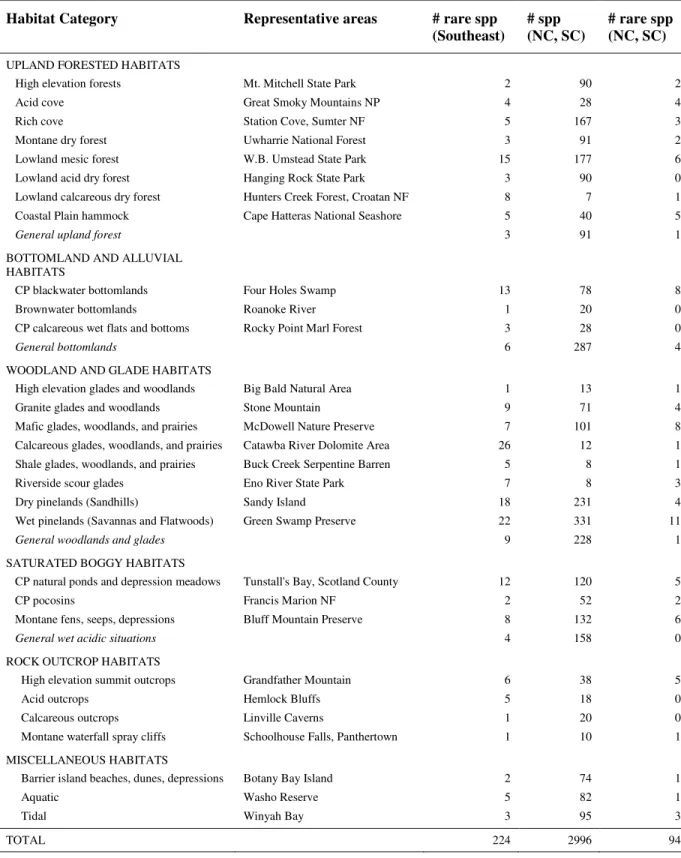
To get a general sense of species distributions across habitat types, this
characterization was first extrapolated to the entire coverage area and each species was
assigned to a single habitat type (Table 2.2). Because even rare species occupy a range of
habitat types, the four general habitat categories listed in Table 2.2 allow for a broad yet
meaningful analysis of environmental association patterns. For example, Malaxis bayardii
(Bayard's adder's-mouth orchid) occurs across a variety of habitats, including dry, open
upland forests and shale barrens (Weakley, 2006) and was therefore scored under the more
broad “General woodlands and glades” category. This particular analysis, however, is not
does broadly and quantitatively illustrate which habitats harbor exceptional numbers of rare
species.
To ascertain which habitats contain high numbers of rare species, a linear regression
of the number of rare species vs. the number of native species per habitat was carried out for
North and South Carolina native plants only. Representative natural areas in the Carolinas
for each habitat type are also listed (Table 2.2).
How is rarity distributed among taxonomic groups?
Several authors have investigated whether rare species are randomly distributed
across taxa and evidence indicates that rare species are clustered within certain groups
(Schwartz, 1993; Edwards, 1998; Schwartz and Simberloff, 2001; Pilgrim et al., 2004;
Domínquez Lozano and Schwartz, 2005). Studies suggest that patterns in rarity at the family
level accurately reflect patterns at lower taxonomic levels (Edwards, 1998). As a result, I
chose the family level to investigate patterns in the taxonomic distribution of rarity within the
Southeastern flora. To test the null hypothesis that rarity is independent of taxonomic group
size, a linear regression of the number of rare species vs. family size for the Southeast was
used.
Data analysis
All statistical analyses were performed using S-PLUS version 7.0 (Insightful Corp.,
Seattle, WA). Residual diagnostic analyses were performed to test the robustness of linear
regression models and to assess trends in residuals. Residual plots were also used to identify
the largest deviations from the model. Cook’s residual distance measure was used to test
whether particular observations are heavily influential or statistically significant outliers.
Results
How are rare species distributed in the Southeast?
At the state level, the highest concentration of rare and federally listed plant species
occur in Georgia (Table 2.3). Of rare species, Alabama had the highest proportion of
endemics (20%), followed by northeastern and Panhandle Florida (19%). At the ecoregional
scale, rare species diversity was greatest in Southeastern Conifer forests followed by
Appalachian/Blue Ridge Forests (Table 2.1). Middle Atlantic Coastal Forests ranked third in
terms of species numbers, indicating that the ecoregions of the Southeastern Coastal Plain are
exceptionally high in species diversity.
With respect to the effect of area on rare plant diversity, linear regressions were
positive and significant for nearly all ecoregions analyzed (Fig. 2.2), including
Appalachian/Blue Ridge Forests (n = 105, r2= 0.09, P = 0.002), Appalachian Mixed
Mesophytic Forests (n = 45, r2= 0.18, P = 0.003), Central U.S. Hardwood Forests (n = 50, r2
= 0.12, P = 0.01), Middle Atlantic Coastal Forests (n = 71, r2= 0.16, P < 0.001), and
Southeastern Conifer Forests (n = 124, r2= 0.04, P = 0.02). The species area relationship for
Southeastern Mixed Forests, however, was not statistically significant no matter which data
transformation was used (n = 137, r2< 0.001, P = 0.87). Although all regressions were
highly significant, the total amount of variation explained was relatively small, suggesting
the influence of other factors on rare plant diversity not tested here. Upon closer inspection,
however, there were several counties for each ecoregion that contained more species than
expected (Table 2.4). While many counties had high, positive deviations from linear models,
the counties listed in Table 2.4 were found to be exceptionally rich in rare species and
counties roughly correspond to the Apalachicola region of the Florida Panhandle, outer
coastal plain of North Carolina, the southern portion of the Blue Ridge and Cumberland
Plateau, and the Central Basin of Tennessee.
Are rare plants clustered within particular habitat types?
Nearly half (46%) of all Southeastern rare plants occur in woodland and glade
habitats, of which 25% are limited to calcareous glades, woodlands, or prairies, and 21% to
dry pinelands (Table 2.3). Upland forested habitats contain 49 rare species (22% of total), a
large proportion of which (31%) are restricted to lowland mesic forests. Similar species
numbers were recorded for bottomland and alluvial habitats and saturated boggy habitats (26
species each) as well as rock outcrop and miscellaneous habitats (13 and 10).
The relationship between the number of species per habitat vs. the number of rare
species for the Carolinas was positive and significant (n = 33, r2= 0.25, P < 0.01), indicating
that the number of rare species among habitat types is strongly correlated with species
diversity in general. The amount of variation explained by the relationship, however, is also
relatively low and suggests the significance of other factors correlated with rare species
distribution among habitat types. Several habitats for the Carolinas were poorly predicted by
the linear model. In particular, Coastal Plain blackwater bottomlands, wet pinelands, and
mafic glades woodlands and prairies were over-represented in rare species while general
woodlands and glades, and general wet acidic situations were under-represented.
How is rarity distributed among taxonomic groups?
A total of 69 plant families and 145 genera are represented among rare Southeastern
plants. Well-represented genera were Isoetes and Carex, with 10 and 8 species each. Rare
(Fig. 2.4). About 86 % of families had less than three rare species; the majority (49%) had
only one rare species recorded for the Southeast. Stacked histograms of the number of rare
species per the number of total native species in plant families show that while larger
families typically have more rare species, the relative proportion of rare species is repeatedly
higher in smaller families (Fig 2.5). This is especially evident in the Isoetaceae, where the
number of rare species is conspicuously high compared to other families of equivalent size.
Cook’s distance plots revealed three significantly influential outliers for the number
of rare species vs. the total number of species per family for the Southeast: Asteraceae (593
spp, 39 rare); Cyperaceae (495 spp, 17 rare); and Poaceae (403 spp, 8 rare). These outliers
were removed to improve resolution among the less species rich families. The latter two
families had fewer rare species than initially predicted by the model. Although the total
amount of variation explained by regression was slightly higher prior to omitting the outliers
(n = 69, r2= 0.77, P = 0.00), the relationship was remarkably significant (n = 66, r2= 0.59, P
< 0.0001) and most large families fall outside 95% confidence intervals for expected
numbers of rare species. A scatter diagram of the number of rare species per family size
illustrates two families that strongly deviated from the linear relationship: Isoetaceae and
Brassicaceae with 0.38 and 0.14 proportion rare (Fig. 2.6). A complete list of plant families,
inclusive species, and geographic range are recorded in Appendix II.
Discussion
Phytogeography and plant ecology of rarity
Examining species distribution patterns at the state level is broadly useful for
are used in inventory, establishing formal legal protection, and frequently form the basis of
conservation planning. The list of globally rare imperiled plant species reported here are
consistent with state patterns of endemism or imperilment observed elsewhere (Dobson et al.,
1997; Estill and Cruzan, 2001; Chaplin et al, 2001; Stein et al., 2001), suggesting that at most
spatial scales, areas rich in endemism and rare species are associated with site-specific
evolutionary patterns and process and unique habitats (Stohlgren et al., 2005). Although it is
beyond the scope of this study to examine every ecoregion in detail, I do give a brief
overview of the distinguishing features for those ecoregions especially rich in rare species
and the habitats in which they occur.
Appalachian/Blue Ridge Forests and Appalachian Mixed Mesophytic Forests
Southeastern ecoregions consistently rank among the most diverse both in terms of
species richness and rare plant composition, particularly the Appalachian/Blue Ridge Forests
ecoregion. Geologic stability, geographic and genetic isolation, disturbance, and variation in
topography and physiography have all led to a unique and rich assemblage of plants and is
arguably the most primitive flora in the world (White, 1984; Delcourt and Delcourt, 1998;
Kartesz and Farstad, 1999). In conjunction with Appalachian Mixed Mesophytic Forests,
Appalachian/Blue Ridge forests contain the highest amount of endemic flora in North
America (Stephenson et al., 1993; Ricketts et al., 1999b). In this study, slightly less than
30% of all Southeastern rare taxa are endemic to these two ecoregions. Many of these
species are relicts of an alpine or tundra flora following interglacial warming (White, 1984)
that have persisted in open, stable habitats. The majority of rare Appalachian plants (~ 44%)
occur in woodland and glade habitats, particularly calcareous glades, woodlands, and
physiographic province, falls out as an unexpectedly rich county in rare species. A botanical
“lost world” (Allison and Stevens, 2001), many species occur in “Ketona” glades recently
described by Allison (1994) and Allison and Stevens (2001). The unusual pure dolomite that
constitutes the Ketona Formation is unique to Bibb County. According to Baskin and Baskin
(2003), the Ketona glades of Bibb County are not true cedar glades which are dominated by
poverty dropseed (Sporobolus vaginiflorus) and infrequently found in the little bluestem
(Schizachyrium scoparium) dominated Ketona dolomite outcrops. The high concentration of
rare plants in Bibb County may also be partly a result of newly split species, particularly in
difficult genera such as Carex and Isoetes (Allison and Stevens, 2001). Similarly, of the
eight species reported for DeKalb County, AL six occur in glade habitats.
In spite of their infrequent occurrence, high elevation rock outcrop communities in
the Southern Appalachians also harbor high numbers of rare species that occur in few other
habitats in the region (Miller, 1986; Baskin and Baskin, 1988; Johnson, 1996; Wiser et al.,
1996; 1998). Wiser and others (1998) demonstrate the importance of site-scale parameters
such as potential solar radiation and soil-nutrient gradients in predicting rare species
distributions among high elevation rock outcrops. Similarly, Miller (1986) found elevation
diversity to be the best predictor of rare species richness, especially in Great Smoky
Mountains National Park. Other important rare plant habitats in the Southern Appalachians
include montane seepy habitats such as bogs (Pittillo, 1984) and other nonalluvial wetlands
(Murdock, 1994; Warren et al., 2004) as well upland forested habitats, which contained
Middle Atlantic Coastal Forests and Southeastern Conifer Forests
The Southeastern Conifer forests that span the coastal plain of Georgia, the Florida
Panhandle, Alabama and Mississippi rank highest in terms of tree diversity and endemism
(Ricketts et al., 1999b; Estill and Cruzan, 2001). Specifically, fire-maintained longleaf pine
(Pinus palustris) and wiregrass (Aristida stricta) communities contain some of the richest
herbaceous flora in the world (Noss and Peters, 1995) and some of the highest levels of
endemism in North America and the Southeast (Estill and Cruzan, 2001). Here, more than
one quarter of rare plants in the Southeast are restricted to this ecoregion. With the exception
of the Florida Panhandle and a few other areas, Southeastern Conifer Forests lack isolating
factors (e.g. mountains, isolated habitats) frequently associated with endemism (Kartesz and
Farstad, 1999). In contrast, large geographic extent, abundance of moisture, and intense light
levels may be responsible for producing the rich flora and endemics observed in this region.
The most species rich counties (including Liberty and Bay counties, FL), not only in
the Coastal Plain but in the entire Southeast, occur in the Apalachicola region of the Florida
Panhandle. The species diversity observed for the Southeastern Coastal Plain is likely due to
the high incidence of rare species in these counties. The vegetation of the Panhandle consists
of mixed-hardwood hammocks where rare species such as the Florida Torreya (Torreya
taxifolia) and the Florida yew (Taxus floridana) persist on protected bluffs along the
Apalachicola River. Other major vegetation types include more open Pinus palustris
dominated sandhills, savannas and flatwoods; the species richness of these habitats is
well-documented here and elsewhere (Walker, 1993; Gray, 2003). Again, woodland and glade
habitats are especially rich in rare species, containing roughly 40% of all rare plants in the
pinelands. Nearly 20% of Southeastern Coastal Plain rare plants, however, occur in
bottomland and alluvial habitats as well as saturated boggy habitats. Coastal Plain
blackwater bottomlands in particular had more rare species than predicted by linear
regression for the Carolinas. Rare species richness was also high in Coastal Plain natural
ponds and depression meadows. Vegetation composition and dynamics in these habitats are
principally controlled by hydrologic processes (Edwards and Weakley, 2001) and spatial and
temporal variation in water level influences species composition along hydrologic gradients.
Central U.S. Hardwood Forests
Broadleaf deciduous trees dominate the Central Hardwood Forest ecoregion, which is
one of the most diverse in North America for herbaceous plants and shrubs (Ricketts et al.,
1999b). However, approximately 75% of rare plant species in this ecoregion occur in glade
habitats. Most (80%) of the rare plants located in the most species rich counties of the
Central Basin of Tennessee are associated with woodland and glade habitats. Of these, 75%
are associated with calcareous substrates or “cedar glades”; high levels of endemism and
near-endemism in Southeastern cedar glades are well known (Kral, 1973; Baskin and Baskin,
1999; 2003). These habitats, usually dominated by herbaceous species, are characterized by
limestone or dolomite rock outcroppings over shallow soils and are located in Tennessee,
Kentucky, and northern Alabama (Baskin and Baskin, 1999). Other distinguishing features
include high irradiance, extreme variation in soil moisture and high soil temperatures in the
summer. According to Weakley (2005), the clustering of rare species in woodland and glade
habitats is largely attributed to distinct, specialized substrates (e.g. calcareous, serpentine,
and mafic rocks). Furthermore, the open nature of these provides ideal conditions for
are frequently found in these habitats. Habitat specialization likely accounts for the
under-representation of rare plants in general habitat categories.
Taxonomic patterns of rarity
In plants, evidence suggests that smaller taxonomic groups consistently contain fewer
than expected numbers of rare species (Schwartz and Simberloff, 2001; Pilgrim et al., 2004;
Domínguez Lozano and Schwartz, 2005). Recent studies have demonstrated that unlike
other taxonomic groups, small plant families consistently contain fewer rare plant species
than expected while rare plants are proportionately over-represented in larger families
(Schwartz and Simberloff, 2001; Domínguez Lozano and Schwartz, 2005). In the Southeast,
rarity was not evenly distributed among plant families and corroborates previous findings.
Schwartz and Simberloff (2001) suggest that differential rates of speciation and extinction
among families may be correlated with rarity and high speciation in large groups, for
example, is associated with high rates of rarity. Alternatively, groups that experience high
rates of extinction are likely to lose their rare species first, leaving the more common
congeners as the remaining representatives of smaller lineages (Schwartz and Simberloff,
2001). Another explanation for these patterns may be due to differences in taxonomic
treatment (Schwartz and Simberloff, 2001), which can artificially inflate rare species lists
(Isaac et al., 2004). The over-representation of Isoetaceae, for example, may be a result of
taxonomic splitting. The reliance on threatened species lists is fundamental to conservation
and priority setting. A recent study, however, showed that hotspots of endemism shift
spatially with changing species concepts (Peterson and Navarro-Siguenza, 1999), indicating
Nonetheless, the conservation implication of the findings presented in this paper
suggests two somewhat contrasting strategies. First, if capturing phylogenetic diversity is the
conservation objective (see Rodrigues and Gaston, 2002) then attention might be directed
towards those groups with the highest number of rare species, particularly if the diversity of
lineages is greatest in these groups due to high rates of speciation. In contrast, taxonomic
distinctiveness is not limited to the boundaries of any particular family, suggesting that
conservation should maximize the number of families with higher rates of rarity. For
instance, there is only one native species in the Southeast representing the Illiaceae family,
Illicium parviflorum, which is globally rare and restricted to two states. Loss of the species
means loss of the lineage. This is true for several families with relatively high proportions of
rare species, including Taxaceae, Diapensiaceae, Calycanthaceae and Loganiaceae.
It is important to note, however, that there is no consistency across regions or
continents as to which families will have more or less rare species (Edwards and Westoby,
2000) and conservation of particular groups will have to be context-dependent. And, while
the identification of areas for conservation must balance the needs of multiple taxa, given
that inventory data for vascular plants is more complete than other taxonomic groups,
measures of species richness based on plant data will continue to guide conservation
Figures
Figure 2.2Scatter diagrams for the number of species per county area for: (A) Southeastern Conifer Forests; (B) Middle Atlantic Coastal Forests; (C) Appalachian/Blue Ridge Forests (D) Appalachian Mixed Mesophytic Forests; and (E) Central US Hardwood Forests.Solid lines indicate a linear fit and dashed lines represent 95% confidence intervals.
500 1000 1500 2000 2500 3000 3500
county area (km2) 0.0 0.2 0.4 0.6 0.8 1.0 lo
g10
(# ra re sp e c ie s)
-0.0179 + 0.0002*x
D
2.7 2.9 3.1 3.3 3.5 3.7
log10(county area) 0.2 0.5 0.8 1.1 1.4 lo
g10
(# ra re sp e c ie s) A
-0.6563 + 0.3835*x
300 600 900 1200 1500 1800 2100
county area (km2) 0.0 0.2 0.4 0.6 0.8 lo
g10
(# ra re sp e c ie s) E
-0.0351 + 0.0002*x
2.6 2.8 3.0 3.2 3.4
log10(county area) 0.1 0.3 0.5 0.7 0.9 lo
g10
(# ra re sp e c ie s) C
-1.2944 + 0.5252*x
200 700 1200 1700 2200 2700 3200
county area (km2)
-0.1 0.1 0.3 0.5 0.7 0.9 lo
g10
(# ra re sp e c ie s)
0.0126 + 0.0002*x
Figure 2.3 A scatter diagram for the number of rare species per habitat type in the Carolinas (n = 33). Solid
line indicates a linear fit and dashed lines represent the 95% confidence interval.
0 50 100 150 200 250 300
# species/habitat 0
2 4 6 8 10
#
ra
re
sp
e
c
ie
s
Figure 2.4 A frequency histogram of the number of rare plants per plant family for the Southeast (n = 70) is
strongly skewed to the right. Most families (86%) have 3 or fewer rare species.
1 2 3 4 5 6 7 8 9 10 11 12 13+
# rare species 0
10 20 30
F
am
il
y
fr
e
q
u
en
c
Figure 2.5 Stacked histograms of distribution of rare species among plant families for the Southeast. The height
of the bottom segment in each stack is the number of rare species and the height of the top segment is the number of total native species per plant family. Families are listed in increasing size. While larger families typically have more rare species, the relative proportion of rare species is repeatedly higher in smaller families.
Plant families
0 40 80 120 160 200
#
sp
e
c
ie
s
Figure 2.6 A scatter diagram for the number of rare species per family size in the Southeast. Three extreme
outliers were removed for improved resolution: Asteraceae, Cyperaceae, and Poaceae. Solid line indicates a linear fit and dashed lines represent the 95% confidence interval.
0 40 80 120 160 200
# species/family 0
4 8 12
#
ra
re
sp
e
c
ie
s
Tables
Table 2.1 Rare species diversity among Southeastern terrestrial ecoregions.
Ecoregion Area (km2) # plant spp # rare spp
Northeastern Coastal Forests 89691 1695 5
Appalachian/Blue Ridge Forests 159266 2398 78
Appalachian Mixed Mesophytic Forests 18300 2487 60
Central U.S. Hardwood Forests 296019 2332 24
Mississippi Lowland Forests 112284 1468 1
Southeast Mixed Forests 347803 3363 57
Middle Atlantic Coastal Forests 133855 1488 52
Table 2.2 The number of rare and native plants found in Southeastern habitats defined by Weakley (2005).
Representative natural areas are listed for the Carolinas (after Schafale and Weakley, 1990).
Habitat Category Representative areas # rare spp
(Southeast) # spp(NC, SC) # rare spp(NC, SC)
UPLAND FORESTED HABITATS
High elevation forests Mt. Mitchell State Park 2 90 2
Acid cove Great Smoky Mountains NP 4 28 4
Rich cove Station Cove, Sumter NF 5 167 3
Montane dry forest Uwharrie National Forest 3 91 2
Lowland mesic forest W.B. Umstead State Park 15 177 6
Lowland acid dry forest Hanging Rock State Park 3 90 0
Lowland calcareous dry forest Hunters Creek Forest, Croatan NF 8 7 1
Coastal Plain hammock Cape Hatteras National Seashore 5 40 5
General upland forest 3 91 1
BOTTOMLAND AND ALLUVIAL HABITATS
CP blackwater bottomlands Four Holes Swamp 13 78 8
Brownwater bottomlands Roanoke River 1 20 0
CP calcareous wet flats and bottoms Rocky Point Marl Forest 3 28 0
General bottomlands 6 287 4
WOODLAND AND GLADE HABITATS
High elevation glades and woodlands Big Bald Natural Area 1 13 1
Granite glades and woodlands Stone Mountain 9 71 4
Mafic glades, woodlands, and prairies McDowell Nature Preserve 7 101 8
Calcareous glades, woodlands, and prairies Catawba River Dolomite Area 26 12 1
Shale glades, woodlands, and prairies Buck Creek Serpentine Barren 5 8 1
Riverside scour glades Eno River State Park 7 8 3
Dry pinelands (Sandhills) Sandy Island 18 231 4
Wet pinelands (Savannas and Flatwoods) Green Swamp Preserve 22 331 11
General woodlands and glades 9 228 1
SATURATED BOGGY HABITATS
CP natural ponds and depression meadows Tunstall's Bay, Scotland County 12 120 5
CP pocosins Francis Marion NF 2 52 2
Montane fens, seeps, depressions Bluff Mountain Preserve 8 132 6
General wet acidic situations 4 158 0
ROCK OUTCROP HABITATS
High elevation summit outcrops Grandfather Mountain 6 38 5
Acid outcrops Hemlock Bluffs 5 18 0
Calcareous outcrops Linville Caverns 1 20 0
Montane waterfall spray cliffs Schoolhouse Falls, Panthertown 1 10 1
MISCELLANEOUS HABITATS
Barrier island beaches, dunes, depressions Botany Bay Island 2 74 1
Aquatic Washo Reserve 5 82 1
Tidal Winyah Bay 3 95 3
Table 2.3 State occurrences of rare, endemic, and federally listed vascular plant species. The total number of
species data is from Stein et al. (2000). Extirpated species were excluded from analysis. Federally listed rare species include Endangered, Threatened, and Candidate species.
State Total # species # rare # endemic # federally listed
Georgia 2986 112 13 26
Alabama 2851 87 17 18
North Carolina 2743 78 8 22
Florida 2995 74 14 12
South Carolina 2543 54 2 17
Virginia 2546 41 3 10
Tennessee 2376 47 7 16
West Virginia 1876 18 1 5
Mississippi 2314 20 0 3
Kentucky 2050 15 2 8
Maryland 2226 16 1 4
Delaware 1669 8 1 4
Table 2.4 Counties with exceptional rare floras within Southeastern terrestrial ecoregions. These counties
represent the highest squared residual deviations in linear regressions for the number of rare species vs. county area.
Ecoregion County County area (km2) # rare spp
Southeastern Conifer Forests Liberty Co., FL 2208 26
Bay Co., FL 1910 20
Gadsen Co., FL 1345 18
Middle Atlantic Coastal Forests Onslow Co., NC 1979 9
New Castle Co., DE 1178 6
New Hanover Co., NC 431 4
Appalachian/Blue Ridge Forests Carter Co., TN 934 8
Henderson Co., NC 962 7
Rabun Co., GA 968 8
Appalachian Mixed Mesophytic Forests Bibb Co., AL 1635 10
McCreary Co., KY 1113 5
Morgan, Co., TN 1339 5
Central US Hardwood Forests Rutherford Co., TN 1583 8
References
ALLISON, J.R. 1994. A botanical “lost world” in central Alabama. In J.S. Fralish, R.C. Anderson, J.E. Ebinger, and R. Szafoni [eds]., Proceedings of the North American Conference on Savannas and Barrens 323-327. Environmental Protection Agency, Great Lakes National Program Office, Chicago, IL.
ALLISON, J.R. AND T.E. STEVENS. 2000. Vascular flora of Ketona dolomite outrcops in Bibb County, Alabama. Castanea 66: 154-2005.
ABBITT, R.J.F., J.M. SCOTT, AND D.S. WILCOVE. 2000. The geography of vulnerability: incorporating species geography and human development patters into conservation planning. Biological
Conservation 96: 169-175.
ANDELMAN, S.J. AND W.F. FAGAN. 2000. Umbrellas and flagships: efficient conservation surrogates or expensive mistakes? Proceedings of the National Academy of Sciences (USA) 97: 5954-5959.
BASKIN, J.M. AND C.C. BASKIN. 1988. Endemism in rock outcrop plant communities of unglaciated Eastern United states: an evaluation of the roles of edaphic, genetic and light factors. Journal of Biogeography 15: 829-840.
BASKIN, J.M. AND C.C. BASKIN. 1999. Cedar glades of the Southeastern United States. Savannas, barrens, and rock outcrop plant communities of North America 206-219. Cambridge University Press, Cambridge, UK.
BASKIN, J.M. AND C.C. BASKIN. 2003. The vascular flora of cedar glades of the Southeastern United States and its phytogeographical relationships. Journal of the Torrey Botanical Club 130: 101-118.
BASKIN, J.M., D.H. WEBB, AND C.C. BASKIN. 1995. A floristic plant ecology study of the limestone glades of Northern Alabama. Bulletin of the Torrey Botanical Club 122: 226-242.
CAROLINA VEGETATION SURVEY. Vegetation of the Carolinas. 2005.
CHAPLIN, S.J., R.A. GARRARD, H.M. WATSON, L.L. MASTER, AND S.R. FLACK. 2000. The geography of imperilment: targeting conservation toward critical biodiversity areas. In B.A. Stein, L.S. Kutner, and J.S. Adams [eds.], Precious heritage: the status of biodiversity in the United States 159-199. Oxford University Press, New York, NY.
DELCOURT, P. A. AND H.R. DELCOURT. 1998. Paleoecological insights on conservation of biodiversity: a focus on species, ecosystems, and landscapes. Ecological Applications 8: 921-934.
DOBSON, A.P., J.P. RODRIQUEZ, W. M. ROBERTS, AND D. S. WILCOVE. 1997. Geographic distribution of endangered species in the United States. Science 275: 550-553.
DOMÍNQUEZ LOZANO, F.D. AND M.W. SCHWARTZ. 2005. Patterns of rarity and taxonomic group size in plants. Biological Conservation 126: 146-154.
EDWARDS, W. 1998. Rarity within taxonomic lineages and the use of taxa above the level of species. Ecography 21: 625-629.
EDWARDS, W. AND M. WESTOBY. 2000. Families with highest proportions of rare species are not consistent between floras. Journal of Biogeography 27: 733-740.
ESTILL, J.C. AND M.B. CRUZAN. 2001. Phytogeography of rare plant species endemic to the Southeastern United States. Castanea 66: 3-23.
FABER-LANGENDOEN, D. AND D. TART. 2001. Proposal for revisions to the national standards for physiognomic levels of vegetation classification in the United States. Federal Geographic Data Committee, Vegetation Subcommittee, Washington, D.C.
FIEDLER, P.L. 1986. Concepts of rarity in vascular plant species, with special reference to the genus Calochortus Pursh (Liliaceae). Taxon 35: 502-518.
FIEDLER, P.L. AND J. J. AHOUSE 1992. Hierarchies of cause: toward an understanding of rarity in vascular plant species. Conservation biology: the theory and practice of nature conservation preservation and management 23-48. Chapman and Hall, New York, NY.
GRAY, J.B., T.R. WENTWORTH, AND C. BROWNIE. 2003. Extinction, colonization, and persistence of rare vascular flora in the longleaf pine-wiregrass ecosystem: Responses to fire frequency and population size. Natural Areas Journal 23: 210-219.
GROSSMAN, D.H., K.L. GOODIN, AND C.L. REUSS. 1994. Rare plant communities of the conterminous United States. The Nature Conservancy, Arlington, VA
IMM, D.W., H.E. JR. SHEALY, K.W. MCLEOD, AND B. COLLINS. 2001. Rare plants of Southeastern hardwood forests and the role of predictive modeling. Natural Areas Journal 21: 36-49.
ISAAC, N.J.B., J. MALLETT, AND G. M. MACE. 2004. Taxonomic inflation: its influence on macroecology and conservation. Trends in Ecology and Evolution 19: 464-469.
JOHNSON, B.R. 1996. Southern Appalachian rare plant reintroductions on granite outcrops. Restoring diversity, strategies for reintroduction of endangered plants Island Press, Washington, D.C.
KARTESZ, J.T. 1999. A synonymized checklist and atlas with biological attributes for the vascular flora of the United States, Canada, and Greenland. In J. T. Kartesz and C. A. Meacham [eds.], Synthesis of the North American flora, Version 1.0 North Carolina Botanical Garden, Chapel Hill.
KEITH, D.A., M.A. MCCARTHY, H. REGAN, T. REGAN, C. BOWLES, C. DRILL, C. CRAIG, B. PELLOW, M.A. BURGMAN, L.L. MASTER, M. RUCKELSHAUS, B. MACKENZIE, S.J. ANDELMAN, AND P.R. WADE. 2004. Protocols for listing threatened species can forecast extinction. Ecology Letters 7: 1101-1108.
KRAL, R. 1973. Some notes on the flora of southern states, particularly Alabama and middle Tennessee. Rhodora 75: 366-410.
KRUCKEBERG, A.R. AND D. RABINOWITZ. 1985. Biological aspects of endemism in higher plants. Annual Review of Ecology and Systematics 16: 447-479.
KUNIN, W.E. AND K. GASTON. 1993. The biology of rarity: patterns, causes and consequences. Trends in Ecology and Evolution 8: 298-301.
LAWLESS, P.J., J.M. BASKIN, AND C.C. BASKIN. 2006. Xeric prairies of eastern United States: review and synthesis. Botanical Review 72: 235-272.
LOEHLE, C. 2006. Endemic plant distributions in eastern North America: implications for conservation. Journal of Forestry 104: 415-418.
MASTER, L.L., B.A. STEIN, L.S. KUTNER, AND G.A. HAMMERSON. 2001. Vanishing assets: Conservation status of U.S. species. In B.A. Stein, L.S. Kutner and J.S. Adams [eds.], Precious heritage: the status of biodiversity in the United States 93-118. Oxford University Press, New York, NY.
MILLER, R.I. 1986. Predicting rare plant distribution patterns in the southern Appalachians of the Southeastern USA. Journal of Biogeography 13: 293-311.
MILLS, M.H. AND M.W. SCHWARTZ. 2005. Rare plants at the extremes of distribution: broadly and narrowly distributed species. Biodiversity and Conservation 14: 1401-1420.
MURDOCK, N.A. 1994. Rare and endangered plants and animals of Southern Appalachian wetlands. Water, Air and Soil Pollution 77: 385-405.
NATURESERVE. 2003. A working classification of terrestrial ecological systems in the conterminous United States. International terrestrial ecological systems classification. NatureServe, Arlington, VA.
NATURESERVE. 2005. International ecological classification standard: terrestrial ecological classifications. NatureServe, Arlington, VA.
NATURESERVE. 2006. NatureServe Explorer: an online encyclopedia of life. NatureServe, Arlington, VA.
http://www.natureserve.org/explorer
NOSS, R.F., E.T. LAROE III, AND J.M. SCOTT. 1995. Endangered ecosystems of the United States: a preliminary assessment of loss and degradation. Department of Interior, National Biological Service, Washington, D.C.
NOSS, R.F. AND R.L. PETERS. 1995. Endangered ecosystems: a status report on America's vanishing habitat and wildlife. Defenders of Wildlife, Washington, D.C.
OWEN, W. The history of native plant communities in the South. 2002 In D.N. Weir and J.G. Greis [eds.], Southern Forest Resource Assessment. U.S. Department of Agriculture, Forest Service, Southern Research Station, Asheville, NC.
PATTERSON, K.D., D.J. ALLARD, AND S. LANDAAL 1994. Rare plant communities of the United States: Southeastern region. Rare plant communities of the conterminous United States: an initial survey. The Nature Conservancy, Arlington, VA.
PEARMAN, P.B., M.R. PENSKAR, E.H. SCHOOLS, AND H.D. ENANDER. 2006. Identifying potential indicators of conservation value using natural heritage occurrence data. Ecological Applications 16: 186-201.
PETERSON, A.T. AND A.G. NAVARRO-SIGUENZA. 1999. Alternate species concepts as bases for determining priority conservation areas. Conservation Biology 13: 427-431.
PILGRIM, E.S., M.J. CRAWLEY, AND K. DOPHIN. 2004. Patterns of rarity in the native British flora. Biological Conservation 120: 161-170.
PITTILLO, J.D. 1994. Vegetation of three high-elevation Southern Appalachian bogs and implications of their vegetational history. Water, Air and Soil Pollution 77: 333-348.
Ecological Monographs 21: 269-300.
QIAN, H. 1999. Spatial pattern of vascular plant diversity in North American north of Mexico and its floristic relationship with Eurasia. Annals of Botany 83: 271-283.
RABINOWITZ, D. 1981. Seven forms of rarity. In H. Synge [ed.], The biological aspects of rare plant conservation. 205-217. Wiley, Chichester, U.K.
REGAN, T.J., L.L. MASTER, AND G.A. HAMMERSON. 2004. Capturing expert knowledge for threatened species assessments: a case study using NatureServe conservation status ranks. Acta Oecologica 26: 95-107.
RICKETTS, T.H., E. DINERSTEIN, D.M. OLSON, AND C. LOUCKS. 1999a. Who's where in North America? BioScience 49: 369-381.
RICKETTS, T.H., E. DINERSTEIN, D.M. OLSON, C.J. LOUCKS, W. EICHBAUM, D. DELLASALA, K. KAVANAGH, P. HEDAO, P.T. HURLEY, K.M. CARNEY, R. ABELL, AND S. WALTERS 1999b. Terrestrial ecoregions of North America: a conservation assessment. Island Press, Washington, D.C.
RODRIGUES, A.S.L. AND K.J. GASTON. 2002. Maximising phylogenetic diversity in the selection of networks of conservation areas. Biological Conservation 105: 103-111.
SCHAFALE, M.P. AND A.S. WEAKLEY. 1990. Classification of the natural communities of North Carolina, third approximation. North Carolina Natural Heritage Program, Raleigh.
SCHEMSKE, D.W., B.C. HUSBAND, M.H. RUCKELSHAUS, C. GOODWILLIE, I.M. PARKER, AND J.G. BISHOP. 1994. Evaluating approaches to the conservation of rare and endangered plants. Ecology 75: 584-606.
SCHWARTZ, M.W. 1993. The search for patterns among rare plants: are primitive species more likely to be rare? Biological Conservation 64: 121-127.
SCHWARTZ, M.W. AND D. SIMBERLOFF. 2001. Taxon size predicts rates of rarity in vascular plants. Ecology Letters 4: 464-469.
SHARITZ, R.R. 2003. Carolina Bay wetlands: unique habitats of the Southeastern United States. Wetlands 23: 550-562.
STEIN, B.A., L.S. KUTNER, G.A. HAMMERSON, L.L. MASTER 2001, AND L.E. MORSE. State of the states: geographic patterns of diversity, rarity, and endemism. In B.A. Stein, L.S. Kutner and J.S. Adams [eds.], Precious heritage: the status of biodiversity in the United States. 119-157. Oxford University Press, New York, NY.
STEPHENSON, S.L., A.N. ASH, AND D.F. STAUFFER 1993. Appalachian oak forests. In W.H. Martin, S.G. Boyce, and A.C. Echternacht [eds.], Biodiversity of the Southeastern United States: upland terrestrial communities, vol. 2, John Wiley and Sons, Inc., New York, NY.
STEWART, C.N. AND E.T. NILSEN. 1993. Association of edaphic factors and vegetation in several isolated Appalachian peat bogs. Bulletin of the Torrey Botanical Club 120: 128-135.
communities in the south Atlantic and eastern Gulf Coastal Plain, USA. Biological Conservation 68: 235-246.
THORNE, R.F. 1992. Classification and geography of the flowering plants. The Botanical Review 58: 225-348.
TNC. Conservation by design: a framework for mission success. 1996. The Nature Conservancy, Arlington, VA.
USDA. 2006. NRCS, The PLANTS database. National Plant Data Center, Baton Rouge, LA.
http://www.plants.usda.gov
WALKER, J. 1993. Rare vascular plant taxa associated with longleaf pine ecosystems: patterns in taxonomy and ecology. Proceedings of the Timbers Fire Ecology Conference 18: 105-125.
WALKER, J. Sensitive plant communities. 2001. In J. Dickson [ed.], Wildlife of the southern forests. 48-71. Hancock House Publishers, Blaine, WA.
WARREN, R.J., J.D. PITTILLO, AND I.M. ROSSELL 2004. Vascular flora of a Southern Appalachian fen and floodplain complex. Castanea 69: 116-124.
WEAKLEY, A.S. 2005. Change over time in our understanding of the flora of the Southeastern United States: implications for plant systematics, bioinformatics, and conservation. Ph.D. dissertation, Duke University, Durham, NC, USA.
WEAKLEY, A.S. Flora of the Carolinas, Virginia, and Georgia, and surrounding areas. 2006. Working draft of 9 August. University of North Carolina at Chapel Hill.
WHITE, P.S. 1984. Impacts of cultural and historic resources on natural diversity: lessons from Great Smoky Mountain National Park in North Carolina and Tennessee. In J.L. Cooley and J.H. Cooley [eds.], Natural diversity in forest ecosystems 120-132. Institute of Ecology, Athens, GA.
WHITE, P.S. AND R.I. MILLER. 1998. Topographic models of vascular plant richness in the Southern Appalachian high peaks. Journal of Ecology 76: 192-199.
WHITE, P.S., S.P. WILDS, G.A. THUNHORST, J.M. ALDERMAN, M. BARNETT-LAWRENCE, J.W. GIBBONS, T.C. GIBSON, D. S. LEE, M.R. PELTON, D. PENROSE, AND J.D. WILLIAMS. 1988. Southeast. In Mac, M. J., Opler, P. A., Haeker, C. E., and Doran, P. D. [eds.], Status and trends of the nation's biological resources. 1 and 2. U.S. Department of Interior, U.S. Geological Survey, Reston, VA.
WILCOVE, D.S., D. ROTHSTEIN, J. DUBOW, A. PHILLIPS, AND E. LOSOS. 1998. Quantifying threats to imperiled species in the United States. BioScience 48: 607-615.
WISER, S.K., R.K. PEET, AND P.S. WHITE. 1996. High-elevation rock outcrop vegetation of the Southern Appalachian Mountains. Journal of Vegetation Science 7: 703-722.