doi:10.1093/ntr/ntw105 Review Advance Access publication April 15, 2016
© The Author 2016. Published by Oxford University Press on behalf of the Society for Research on Nicotine and Tobacco. All rights reserved. For permissions, please e-mail: [email protected].
2047
Review
Systematic Review and Meta-analysis
of the Association Between Exposure to
Environmental Tobacco Smoke and Periodontitis
Endpoints Among Nonsmokers
Aderonke A. Akinkugbe BDS, MPH
1,2, Gary D. Slade PhD, BDSc
2,
Kimon Divaris PhD, DDS
1,3, Charles Poole ScD
11Department of Epidemiology, Gillings School of Global Public Health, University of North Carolina at Chapel Hill, Chapel Hill, NC; 2Department of Dental Ecology, School of Dentistry, University of North Carolina at Chapel Hill, Chapel Hill, NC; 3Department of Pediatric Dentistry, School of Dentistry, University of North Carolina at Chapel Hill, Chapel Hill, NC Corresponding Author: Aderonke A. Akinkugbe, BDS, MPH, Department of Epidemiology, Gillings School of Global Public Health, 2101 McGavran-Greenberg Hall, CB #7435, Chapel Hill, NC 27599, USA. Telephone: 919-537-3278;
E-mail: [email protected]
Abstract
Objective: A systematic review was conducted to summarize the epidemiological evidence on environmental tobacco smoke (ETS) exposure and prevalent periodontitis endpoints among nonsmokers.
Methods: We searched PubMed, EMBASE, Web of Science, Pro-Quest dissertations, and confer-ence proceedings of a dental research association. We included studies from which prevalconfer-ence odds ratios (POR) could be extracted for periodontitis determined by examiner measurements of clinical attachment level (CAL) and/or probing pocket depth (PD) or self-report of missing teeth. Studies determined ETS exposure by self-report or biomarker (cotinine) levels.
Results: For studies reporting CAL and/or PD (n = 6), associations were stronger with cotinine-measured exposure (n = 3; random effects POR [95% prediction interval] = 1.63 (0.90, 2.96)) than self-reported exposure (n = 3; random effects POR = 1.15 (0.68, 1.96)). There was no meaningful dif-ference in summary estimate for studies reporting CAL and/or PD endpoint (n = 6; random effects POR = 1.34 (0.93, 1.94)) as opposed to tooth loss (n = 2; random effects POR = 1.33 (0.52, 3.40)). Conclusions: There appears to be a positive association between exposure to ETS and prevalent periodontitis endpoints among nonsmokers, the magnitude of which depended mostly on the method of ETS assessment.
Introduction
Exposure to environmental tobacco smoke (ETS) through “passive” or “involuntary” smoking was named a public health problem in the 1986 Surgeon General’s report on the adverse health effects of invol-untary smoking.1 ETS is a mixture of sidestream smoke given off by a burning cigarette and mainstream smoke exhaled by a smoker. Active smoking is known to negatively affect the periodontal health of smokers,2–5 and because ETS has chemical constituents similar to inhaled mainstream smoke, it may likewise have adverse effects on the periodontal health of nonsmokers. Nicotine, a major constituent of mainstream smoke, induces a peripheral vasoconstrictive effect that minimizes oxygen delivery to tissues,6 a consequence of which is impairment of periodontal health. In addition to nicotine, in vitro and animal experimental studies have demonstrated likely harmful effects of numerous other compounds in ETS including ammonia, nitrogen, and sulfur oxides on periodontal tissues.
Detrimental effects of ETS on the periodontium may be hard to extrapolate from the effects of active mainstream smoke because, on the one hand, concentrations of dangerous chemical components in ETS are lower than levels in mainstream smoke.7,8 On the other hand, non-smokers may be more sensitive to ETS than non-smokers because long-term exposure to cigarette smoke in smokers might result in physiological adaptations that decreases sensitivity to ETS.8 A further problem is that former smokers may carry “scars” from previous episodes of periodon-tal destruction caused during their period as active smokers, yet those scars are reflected in periodontal measures of clinical attachment level for years after cessation of smoking. In other words, clinical attachment level (CAL) is an irreversible measure of periodontitis history. Lastly, as the category of active smokers unexposed to ETS will be empty, it is worthwhile to conduct studies of potential adverse effects of ETS on human health among nonsmokers or examine the association among nonsmokers in studies that include both smokers and nonsmokers, as this controls confounding by active and/or former smoking.
Unlike active smoking, the body of evidence for the ETS expo-sure–periodontitis endpoints association in humans is limited. A recent systematic review by Javed et al.9 stated that the association was inconclusive and called for additional studies. A feature of that study was its inclusion of both epidemiological and in vitro studies. However, no attempts were made to explore the sources of hetero-geneity among the studies reviewed. Specifically, by quantitatively assessing differences in effect estimates for epidemiologic studies separate from in vitro studies and possibly differential publication by study location. Substantive conclusions and future studies will be better informed by exploration of differences among published studies as well as possible publication bias.
Our goal was to systematically review the epidemiological lit-erature investigating the association between ETS exposure and prevalent periodontitis endpoints in nonsmokers and to quantita-tively evaluate evidence of the association. Similar to Javed et al.9 we reviewed studies where periodontitis was classified by examiner-assessed measures of probing pocket depth (PD) and/or clinical attachment level (CAL) and also included studies of self-reported assessments of tooth loss. We justify the latter on two grounds: (a) by necessity, PD and CAL measurements are made on teeth that have not been lost due to disease, thereby underestimating the degree of periodontal disease experienced in a person’s lifetime and (b) PD and CAL measurements are “surrogate” clinical endpoints of periodonti-tis, whereas tooth loss is a “true” clinical endpoint of periodontitis.10 When possible, we placed studies on a common quantitative footing by estimating a similar measure of association namely the
prevalence odds ratio (POR). We then examined and described observed heterogeneity, investigated funnel plot asymmetry for signs of publication bias or other influences and, when appropriate, pro-vided summary estimate(s) of the association.
Methods
Search Strategy and Selection Criteria
We searched PubMed, EMBASE, Web of Science, as well as ProQuest databases for dissertations. We also searched conference abstracts of a dental research association (American Association for Dental Research [AADR]). To identify relevant articles in PubMed, the following search terms were applied to Medical Subject Headings and free text words: (Periodontal Diseases OR periodontal OR periodontitis OR tooth loss) AND (Passive smok* OR passive cig-arette smok* OR passive tobacco smok* OR secondhand smok* OR second hand smok* OR second hand cigarette smok* OR sec-ondhand tobacco smok* OR smoking, passive OR environmental tobacco smoke OR Tobacco Smoke Pollution OR secondary smok* OR Involuntary smok*). The initial search performed on December 21, 2013 and updated on March 20, 2015 included English lan-guage, epidemiologic studies ever published. We screened titles and abstracts retrieved by the search and, subsequently reviewed full-text of selected articles. Study data were abstracted from full reports and discrepancies were resolved through discussion to reach a consen-sus. Reference lists from identified articles were also reviewed in an attempt to identify additional studies.
Included studies were cross-sectional in the sense that ETS expo-sure and prevalent periodontitis endpoints were assessed concurrently or baseline ETS exposure was assessed against prevalent periodonti-tis at some point during follow-up. These studies were restricted to never-smokers, and assessment of ETS was made via self-report or salivary, urinary, or serum cotinine levels. Cotinine, a metabolite of nicotine is estimated to have a half-life of 15–20 hours and is con-sidered the most accurate biochemical measure of smoking.11,12 We excluded a study that used exhaled carbon monoxide as a surrogate for ETS,13 because carbon monoxide is not specific to ETS and has a short half-life of about 3–5 hours in sedentary individuals and 1 hour in active individuals.11 For the assessment of periodontitis, we included studies that reported measures of probing PD and CAL or classifications based on combinations of these measures. PD is the distance from the free gingival margin to the base of the periodontal pocket, while CAL is the difference between PD and gingival recession (defined as the distance from the free gingival margin to the cemen-toenamel junction). Both measures form criteria in a case classifica-tion created by the Centers for Disease Control and the American Academy of Periodontology (CDC-AAP), namely severe periodon-titis defined as ≥2 interproximal sites with CAL of ≥6 mm (not on the same tooth) AND ≥1 interproximal sites with PD of ≥5 mm and moderate periodontitis defined as ≥2 interproximal sites (not on the same tooth) with CAL of ≥4 mm OR ≥2 interproximal sites (not on the same tooth) with PD of ≥5 mm.14,15 We also included studies of self-reported tooth loss16,17 and salivary markers of periodontitis.18,19
No additional inclusion criteria were imposed and we placed no restrictions on case definition or cutpoint for defining periodontitis or categories of self-reported or biomarker levels of ETS exposure.
Extraction of Results and Study Characteristics
study design, study date, geographic location, sample size, age and gender distribution, percent exposed to ETS, percent with periodon-titis endpoint, exposure/outcome assessment, measure of associa-tion, and adjustment covariates.
Meta-analysis
Studies deemed appropriate to be meta-analyzed were first placed on a common quantitative footing by estimating a common measure of association. Specifically, we estimated the natural log (ln) of the respec-tive POR with the corresponding 95% confidence intervals (CIs). We preferred covariate-adjusted estimates because we assumed they were less confounded than the unadjusted estimates. Indeed, among studies that reported both adjusted and unadjusted estimates,20–23 our assessment of the validity-precision trade-off 24 favored adjust-ment in all except one (see Supplementary Table S4).20 Nonetheless, we used unadjusted estimates when they were the only estimates available, calculating them ourselves when necessary. Therefore, we assessed adjusted (ie, author reported) versus unadjusted (calculated by us) POR estimates as a study characteristic. We estimated POR as opposed to prevalence ratios because several eligible articles provided estimates of the odds ratios and not enough data were provided for us to estimate the corresponding prevalence ratio or difference measures. The prevalence of periodontitis endpoints in the studies we meta-ana-lyzed ranged from about 3% to 31%, therefore, the POR is an over-estimate of the corresponding PR in some but not all of the studies.
We investigated whether nonsmokers “exposed” to ETS had simi-lar prevalence odds of periodontitis endpoints as nonsmokers “unex-posed” to ETS. When studies reported POR estimates across ETS categories,16,17,25 we calculated a single estimate for the exposed group in two ways. First, we created a single category for the exposed group from the raw numbers by collapsing the levels of exposure and esti-mated an unadjusted POR estimate for the exposed group. Second, we used the Greenland and Longnecker’s covariance corrected gener-alized least squares trend (GLST) estimation26 to generate one contin-uous POR trend estimate. This was implemented using Stata’s GLST command.27 To each ETS category, we assigned values equal to that category’s median value. To the upper unbounded ETS category, we added the lower value of the bound to the width of the next highest category.28 Afterward, we multiplied the natural log (ln) of the esti-mated trend with the respective mean level of ETS exposure reported in each study to generate a single estimate for the exposed group.
Although the study by Arora et al.16 provided adjusted stratum-specific POR estimates, stratum-stratum-specific sample sizes were not pro-vided, therefore, neither of the methods described above could be used to estimate a single unadjusted POR estimate for the exposed group. Instead, we used the reported adjusted POR for those exposed to ETS for ≥6 hours in the main analysis and substituted with the POR estimate for those exposed for 1–5 hours in a sensitivity analysis.
From 10 publications14–17,20–23,25,29 and two conference abstracts30,31 systematically reviewed, eight16–23,25,31 were eligible for meta-analysis. Reports were excluded for two main reasons, and two studies18,19 were ineligible for both reasons. First, we excluded three reports18,19,30 that were conducted in the same sample as studies already included.20,22 Second, we excluded three reports that could not be placed on the same quantitative footing as the rest, that is, we could not obtain POR for CAL and/or PD or tooth loss because these studies either reported mean (SE) levels of CAL and/or PD,29 odds ratio for change in CAL from baseline,19 or mean (SE) for sali-vary biomarkers related to periodontitis but not on actual measures of CAL and/or PD.18
Funnel plots of ln(POR) versus SE (ln POR) were visually exam-ined for asymmetry and quantitatively assessed using the rank cor-relation test of Begg and Mazumdar,32 the regression–based test of Egger et al.,33 and the Duval and Tweedie34 trim-and-fill imputation method. We assessed overall heterogeneity between studies using Cochran’s Q statistic and used the estimated between study vari-ance—tau squared (τ2) derived by restricted maximum likelihood from an intercept-only random effects meta-regression model to cal-culate (1) the 95% population effects interval, which is the central interval within which 95% of the true values are estimated to lie (2) the opposite effects proportion, which is the estimated proportion of populations with estimated odds ratios on the opposite side of the null from the estimated mean of the random effects distribution and (3) the limits of 95% prediction intervals (PIs), 95% of which would cover the true value to be estimated in the next study in hypothetical repetitions of the entire literature-generating process.
We further investigated specific study characteristics. Specifically, we investigated the method of ETS ascertainment (self-report vs. cotinine), study location (United States vs. elsewhere), whether study adjusted for diabetes (yes/no), whether study adjusted for oral hygiene practices (yes/no), and whether study was restricted to pregnant/postpartum women (yes/no) and source of POR estimate (author reported in original paper vs. estimated in this paper). We conducted stratified and meta-regression analyses by categories of these study characteristics. Each meta-regression estimated a ratio of the average random effects PORs from studies grouped by particular study characteristics but only for study characteristics with at least two studies per stratum. To obtain stratified estimates, we ran the meta-regression model for each study characteristic twice, the second time with the study characteristic coding reversed. The correspond-ing intercepts formed the respective stratified analysis estimate. The limited number of studies precluded us from conducting a multiple meta-regression, therefore we assessed each study characteristic one at a time. Study characteristics analysis was conducted only for stud-ies reporting CAL and/or PD (n = 6)20–23,25,31 and not for those report-ing tooth loss (n = 2) because of the too few number of studies.
Sensitivity Analysis
When studies reported separate estimates for self-reported home and work exposure to ETS,17,21 we included home exposure in the main analysis and explored work exposure in a sensitivity analysis. Likewise, when two studies were conducted in the same sample of study population,22,30 we included the full-text article22 in the main analysis and substituted with conference abstract30 in sensitivity analysis. For the Arora et al.16 study, the reported adjusted stratum-specific POR estimate for ≥6 hours of exposure was included in the main analysis and substituted with the adjusted estimate for 1–5 hours of exposure in sensitivity analysis. Lastly, we included the unadjusted POR we estimated by collapsing across categories of ETS in the main analysis and substituted with the estimate derived from the GLST estimation in a sensitivity analysis. All analyses were per-formed in STATA v.11 (Stata Corporation LP, College Station, TX).
Results
Description of Studies Selected Studies
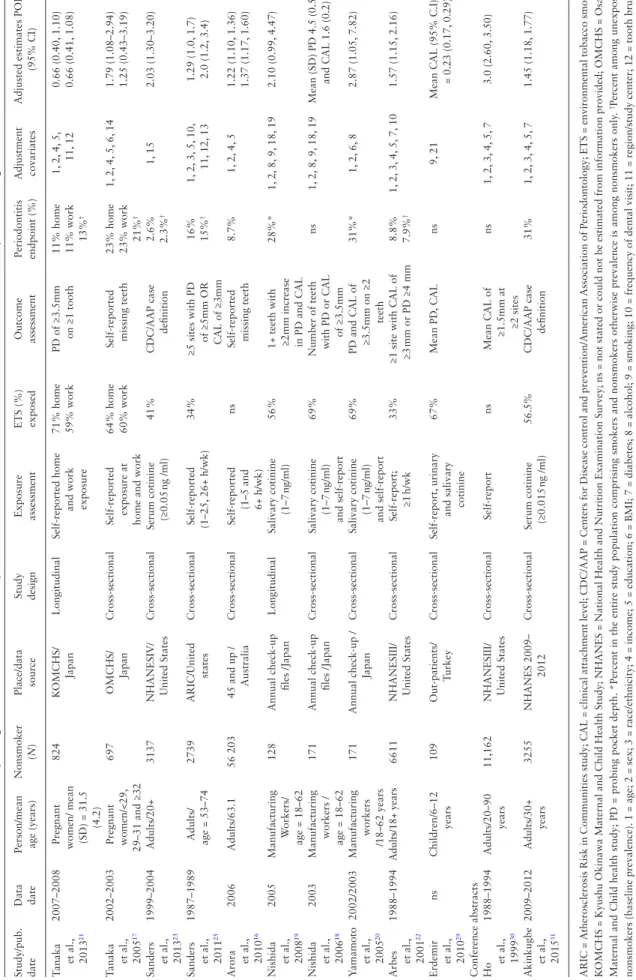
because one was a systematic review,9 two were narratives,11,35 two were dissertations already published in peer-reviewed journals,36,37 one study38 presented results from a larger study,23 two were letters to the editor,39,40 one used exhaled carbon monoxide as the expo-sure variable,13 and four studies where the outcome was neither CAL and/or PD nor tooth loss.41–44 Of the three conference abstracts reviewed,30,31,45 one was excluded because of incomplete data report-ing.45 In total, 10 observational full-text articles16–23,25,29 and two con-ference abstracts30,31 were systematically reviewed and are presented in Table 1 with a detailed description in Supplementary Table S2. Eight of these were eligible for meta-analysis, six reporting meas-ures of CAL and/or PD were meta-analyzed separately from the two reporting tooth loss.16,17 One29 was excluded only because it could not be placed on the same quantitative footing as the rest, another30 was excluded only because it was conducted in the same sample of study population as a study already included,22 and two18,19 were excluded for both reasons.
Study and Population Characteristics
Study setting, assessment of ETS, and criteria for defining periodon-titis endpoint differed across studies (Table 1 and Supplementary Table S2). With regard to study population, nonsmokers were identi-fied as those who reported smoking <100 cigarettes22,23,30,31 or <400 cigarettes25 in a lifetime or self-reported their status as never having smoked. The 12 final reports provided data on 75,498 nonsmok-ers in nine study populations (Supplementary Table S2). Eleven of the 12 reports were cross-sectional, 10 of these 11 were cross-sec-tional in the sense that ETS exposure and periodontitis endpoints were assessed concurrently, while one21 was cross-sectional in the sense that baseline ETS exposure was assessed against prevalent periodontitis status at follow-up. The 12th report19 was longitudi-nal in the sense that baseline ETS level was assessed against change from baseline CAL parameters. For studies that reported on percent exposed to ETS, from a total of 16 143 nonsmokers, 7582 (47%) were exposed. Two studies17,21 were restricted to a population of
pregnant/postpartum women, and one was conducted in children <12 years old.29 Age ranged from a minimum of 6 years29 to a maxi-mum of 106 years.16
Exposure Assessment
Six studies16,17,21,22,25,30 assessed ETS using self-report, four used coti-nine levels,18,19,23,31 and two20,29 used both methods. The study by Sanders and Slade23 set the threshold for ETS exposure at ≥0.05 ng/ ml of serum cotinine, while three studies18–20 set the threshold at 1–7 ng/ml of salivary cotinine. For self-reported ETS exposure, one study dichotomized ETS,21 while others categorized exposure as number of hours exposed at home or work; 1–5, ≥6 hours/week16 1–25, ≥26 hours/week,25 ≥1 hour/week,22 and current <10 hours/day, current ≥10hours/day.17
Outcome Assessment
Two studies16,17 reported tooth loss as the outcome of interest while nine used measures of CAL and/or PD to classify disease based on various classification criteria.19–23,25,29–31 Two studies23,31 character-ized periodontitis endpoint using the CDC-AAP criteria, while dif-ferent thresholds such as PD ≥3.5mm on at least one tooth,21 CAL and PD of ≥3.5mm on at least 2 teeth,18,20 and ≥5 sites with PD or CAL of ≥3mm25 were used by other studies. In addition, the studies by Nishida et al.18,19 also reported on the levels of salivary biomark-ers of periodontitis.
Measure of Association
Table 1
.
Characteristics of 1
2 Studies R
epor
ting the
Association Between Exposure to En
vironmental
Tobacco Smok
e and P
eriodontitis Endpoints Among Nonsmok er s Study/pub. date
Data date Person/mean age (years)
Nonsmoker
(
N
)
Place/data source Study design Exposure assessment ETS (%) exposed Outcome assessment Periodontitis endpoint (%) Adjustment covariates
Adjusted estimates POR
(95% CI)
Tanaka
et al., 2013
21
2007–2008
Pregnant women/ mean (SD) = 31.5
(4.2)
824
K
OMCHS/ Japan
Longitudinal
Self-reported home
and work exposure 71% home 59% work
PD of ≥3.5mm
on ≥1 tooth
11% home 11% work 13%
† 1, 2 , 4 , 5 , 11, 12 0.66 (0.40, 1.10) 0.66 (0.41, 1.08) Tanaka et al., 2005 17 2002–2003
Pregnant women/<29,
29–31 and ≥32
697
OMCHS/
Japan
Cross-sectional
Self-reported exposure at home and work 64% home 60% work Self-reported missing teeth 23% home 23% work 21%
† 1, 2, 4, 5, 6, 14
1.79 (1.08–2.94) 1.25 (0.43–3.19)
Sanders et al., 2013 23 1999–2004 Adults/20+ 3137
NHANESIV/ United States
Cross-sectional
Serum cotinine (≥0.05
ng /ml) 41% CDC/AAP case definition 2.6% 2.3% † 1, 15 2.03 (1.30–3.20) Sanders et al., 2011 25 1987–1989
Adults/ age = 53–74
2739
ARIC/United
states
Cross-sectional
Self-reported (1–25,
26+ h/wk)
34%
≥5 sites with PD
of ≥5mm OR CAL of ≥3mm 16% 15% † 1, 2, 3, 5, 10, 11, 12, 13 1.29 (1.0, 1.7) 2.0 (1.2, 3.4) Arora et al., 2010 16 2006 Adults/63.1 56 203
45 and up / Australia
Cross-sectional
Self-reported
(1–5 and 6+ h/wk)
ns
Self-reported missing teeth
8.7% 1, 2 , 4 , 5 1.22 (1.10, 1.36) 1.37 (1.17, 1.60) Nishida et al., 2008 19 2005 Manufacturing W orkers/ age = 18–62 128 Annual check-up files /Japan Longitudinal Salivary cotinine (1–7 ng/ml) 56%
1+ teeth with ≥2mm increase in PD and C
AL 28%* 1, 2, 8, 9, 18, 19 2.10 (0.99, 4.47) Nishida et al., 2006 18 2003 Manufacturing
workers / age = 18–62
171 Annual check-up files /Japan Cross-sectional Salivary cotinine (1–7 ng/ml) and self-report 69%
Number of teeth with PD or C
AL of ≥3.5mm ns 1, 2, 8, 9, 18, 19
Mean (SD) PD 4.5 (0.5)
and C
AL 1.6 (0.2)
Y
amamoto et al.,
2005 20 2002/2003 Manufacturing workers /18–62 years 171
Annual check-up /
Japan Cross-sectional Salivary cotinine (1–7 ng/ml) and self-report 69%
PD and C
AL of
≥3.5mm on ≥2
teeth 31%* 1, 2 , 6 , 8 2.87 (1.05, 7.82) Arbes et al., 2001 22 1988–1994 Adults/18+ years 6611
NHANESIII/ United States
Cross-sectional
Self-report;
≥1
h/wk
33%
≥1 site with C
AL of
≥3
mm or PD ≥4 mm
8.8% 7.9% † 1, 2, 3, 4, 5, 7, 10 1.57 (1.15, 2.16) Erdemir et al., 2010 29 ns Children/6–12 years 109 Out-patients/ Turkey Cross-sectional Self-report, urinary
and salivary cotinine
67% Mean PD , C AL ns 9, 21 Mean C
AL (95% C.I)
= 0.23 (0.17,
0.29)
Conference abstracts Ho
et al., 1999 30 1988–1994 Adults/20–90 years 11,162
NHANESIII/ United States
Cross-sectional
Self-report
ns
Mean C
AL of
≥1.5mm at ≥2 sites
ns 1, 2 , 3 , 4 , 5 , 7 3.0 (2.60, 3.50) Akinkugbe et al., 2015 31 2009–2012 Adults/30+ years 3255 NHANES 2009– 2012 Cross-sectional
Serum cotinine (≥0.015
ng /ml) 56.5% CDC/AAP case definition 31% 1, 2 , 3 , 4 , 5 , 7 1.45 (1.18, 1.77) ARIC = Atherosclerosis Risk in Communities study; C AL = clinical attachment level; CDC/AAP = Centers for
Disease control and prevention/American
Association of Periodontology;
ETS
=
environmental tobacco smoke;
K
OMCHS
=
Kyushu Okinawa Maternal and Child Health Study; NHANES
=
National Health and Nutrition Examination Survey; ns
=
not stated or could not be estimated from information provided; OMCHS
=
Osaka
Maternal and Child health study; PD
=
probing pocket depth.
*Percent in the entire study population comprising smokers and nonsmokers otherwise prevalence is among nonsmokers only
.
†Percent among unexposed
nonsmokers (baseline prevalence).
1 = age; 2 = sex; 3 = race/ethnicity; 4 = income; 5 = education; 6 = BMI; 7 = diabetes; 8 = alcohol; 9 = smoking; 10 =
frequency of dental visit; 11
=
region/study center; 12
=
tooth brush
-ing frequency; 13
=
HR
T use; 14
=
gestational age; 15
=
survey year/cycle; 16
=
working hours; 17
=
eating breakfast; 18
=
cotinine levels; 19
=
number of teeth with probing depth ≥3.5
mm; 20
=
number of teeth with
been considered for meta-analysis. First, reporting OR for change in CAL and PD19 or mean level of CAL.29 Second, for studies conducted in the same sample of study participants,18–20,22,30 two were excluded because one was a conference abstract30 and one reported results on salivary markers of periodontitis but not on the actual measures of CAL and/or PD18 and the last although already excluded for report-ing change in CAL19 was also excluded because it was conducted in the same study sample as a study already included.20 Therefore, we restricted meta-analysis to eight studies.16,17,20–23,25,31 Six of which adjusted POR for the ETS exposure was reported by the authors and two17,25 for which we estimated a single unadjusted POR for ETS exposure. Of these eight studies, six reported measures of CAL and/or PD as the outcome and were meta-analyzed separately from the two that reported tooth loss16,17 as the outcome of interest.
Findings of Studies That Were Ineligible for Meta-analysis
Findings from studies18,19,29 that were ineligible for the main or sen-sitivity analysis of our meta-analysis were in the general direction of a positive association between ETS exposure and periodontitis endpoints. Specifically, exposure to ETS was associated with greater mean attachment loss at baseline, a greater loss of periodontal attachment 2 years after follow-up and higher levels of salivary biomarkers related to periodontitis (see Supplementary Text, for a detailed report and discussion of these results).
Meta-analysis Funnel Plot Analysis
Funnel plot was created only for the six studies where CAL and/or PD was measured to determine periodontal status. Although the funnel plot gave a visual appearance of missing estimates on the left of the plot, the Begg and Egger tests both yielded P values of .9. The trim-and-fill method imputed one hypothetically missing result on the left of the fun-nel plot. However, this imputation did not change the overall estimated mean of the random effects distribution very much (from 1.34 to 1.30).
Overall Heterogeneity and Study Characteristics
Among the six studies reporting measures of CAL and/or PD, three assessed ETS using self-report and four were conducted in the United States (Table 1). The homogeneity test P value was 0.03, and a forest plot of the study specific POR and 95% CI for each study included in the meta-analysis is displayed in Figure 2.
There were positive associations between ETS and periodontitis and high homogeneity test P values for studies with the following characteristics: studies that assessed ETS with cotinine, studies from the United States, studies that adjusted for diabetes, and studies that did not control for oral hygiene practices. Therefore, the correspond-ing mean of the random effects distribution rangcorrespond-ing from 1.24 to 1.53 (Table 2) was the same as the fixed effect summary POR.
Combining the six estimates reporting CAL and/or PD, the estimated random effects POR (95% PI) comparing nonsmokers exposed to ETS to unexposed nonsmokers was 1.34 (95% PI = 0.93, 1.94). The estimated variance of the random effects distribution (τ2) was 0.04808; therefore, we estimated the 95% population effects interval as (0.87, 2.06). Nine percent of populations were estimated to have odds ratio on the opposite side of the null from the ran-dom effects mean, that is, the opposite effects proportion. For the two studies that reported periodontitis endpoint of tooth loss, we estimated the random effects POR (95% PI) comparing exposed-to-unexposed nonsmokers as 1.33 (95% PI = 0.52, 3.40).
Sensitivity Analyses
For studies that reported POR estimate separately for self-reported ETS exposure at home and work,17,21 home exposure estimate was included in the primary analysis, while work exposure was sub-stituted for home exposure in a sensitivity analysis. Because this alternative estimate was similar with respect to point and interval estimate as the home exposure estimate, the substitution did not appreciably affect the results. The estimated variance of the ran-dom effects distribution (τ2) was the same as in the main analysis
CAL,PD Arbes (2001) Yamamoto (2005) Sanders (2011) Sanders (2013) Tanaka (2013) Akinkugbe (2015) Subtotal
Tooth−loss Tanaka (2005) Arora (2010) Subtotal Study
1.57 (1.15, 2.15) 2.87 (1.05, 7.83) 1.23 (0.99, 1.52) 1.60 (1.05, 2.44) 0.66 (0.40, 1.09) 1.45 (1.18, 1.78) 1.34 (1.08, 1.68)
1.15 (0.79, 1.67) 1.37 (1.17, 1.60) 1.33 (1.15, 1.54) POR (95% CI)
1
.3 .5 2 4 8
Prevalence odds ratio and 95% confidence interval (log scale)
(0.04808). Likewise, for tooth loss studies, substituting the ≥6 hours exposure estimate with 1–5 hours exposure, estimate from the Arora et al.16 study did not appreciably affect the results. The estimated random effects POR (95% PI) = 1.26 (0.72, 2.19). Lastly, substitut-ing the ssubstitut-ingle exposure estimate derived by collapssubstitut-ing crude num-bers for studies that reported POR estimates across ETS categories, with the GLST estimate (see Methods section), also did not appreci-ably affect the results of the stratified analysis and meta-regression (Supplementary Table S3). We estimated the variance of the random effects distribution (τ2) using the GLST estimates as 0.04744.
Discussion
Findings from this systematic review and meta-analysis indicate a positive association between exposure to ETS and prevalent peri-odontitis endpoints among nonsmokers. Despite the systematic review by Javed et al.,9 calling for additional studies, no peer-reviewed article has been published since then. For most of the studies reviewed, the results were consistent with a positive ETS-periodontitis association, although the magnitude and our precision in estimating it varied according to study characteristics. A princi-pal source of heterogeneity among studies related to the method of assessing ETS exposure. Consistent with our expectation, stud-ies assessing ETS exposure with cotinine (n = 3), irrespective of whether it was serum or salivary cotinine, produced stronger asso-ciations compared with estimates based on self-reported ETS expo-sure. Although three cotinine studies is too few to draw a definitive conclusion, this finding supports using biomarkers as opposed to self-report in assessing ETS, an exposure that is subject to both recall and social desirability biases. Indeed, a more strongly posi-tive association with cotinine is consistent with less bias toward the null from non-differential exposure misclassification (Table 2
and Supplementary Table S3). Although two of the three cotinine studies used serum and the third salivary cotinine levels, previous reports have found cotinine levels in serum and saliva to correlate well with one another.46,47
We observed no meaningful difference in the estimated mean of the random effects distribution with respect to how periodontitis was assessed (CAL and/or PD vs. tooth loss). However, studies based on measures of CAL and/or PD (n = 6) were somewhat heterogene-ous as indicated by the difference in precision of the 95% CI (1.08, 1.68; confidence limit ratio [CLR] = 1.56) and the 95% PI (0.93, 1.94; prediction limit ratio [PLR] = 2.08). However, in addition to having too few studies to definitely conclude heterogeneity, it is also difficult to assess whether the apparent differences in PORs are due to the biological actions of ETS on the periodontium or inconsisten-cies in CAL and/or PD thresholds in defining a case of periodontitis. Although we included studies of tooth loss, we acknowledge that tooth loss can also result from other dental conditions like dental caries and orthodontic extractions. Because the reasons for miss-ing teeth were not reported in any of the studies we reviewed, we assumed tooth loss was not a result of periodontal attachment loss and meta-analyzed it separately from CAL and/or PD. Indeed, analy-sis of all-cause tooth loss as opposed to cause-specific tooth loss will at best decrease statistical efficiency, an acceptable price to pay for obtaining unbiased estimates.48
There were different combinations of variables assessed as poten-tial confounders in the studies we reviewed. While all adjusted for age, only a handful were adjusted for periodontitis risk factors like diabetes22,31 and oral hygiene practices.21,25 Diabetes is recognized as one of the more important risk factors for periodontitis,49–51 and in line with our expectation, studies that did and did not adjust for diabetes produced different stratified POR estimates (Table 2
and Supplementary Table S3). However, adjustment for diabetes produced slightly higher POR estimate. This was surprising as we expected the direction of bias to be up and away from the null in studies that did not adjust for diabetes because adjustment for dia-betes will remove some of the effects of diadia-betes on periodontitis. Nonetheless, we interpreted this result cautiously, because only two studies adjusted for diabetes compared with four that did not, hence we were unable to assess diabetes as a study characteristic in depth. Oral hygiene practices are reported as a risk indicator for Table 2. Stratified Analysis and Meta-regression of Six Observational Studies20–23,25,31 Investigating the Relationship Between Exposure to
Environmental Tobacco Smoke and Periodontitis (CAL and/PD) Among Nonsmokers
Study characteristic N studies Homogeneity P value Random effects POR (95% PI) Ratio of PORs (95% CI)*
Exposure
Self-report 3 0.02 1.15 (0.68, 1.96) 1.0
Cotinine 3 0.4 1.63 (0.90, 2.96) 1.42 (0.64, 3.15)
POR for exposed
Estimated here 1 — 1.23 (0.43, 3.52) —
Reported by authors 5 0.02 1.38 (0.80, 2.40)
Study location
Others 2 0.01 0.90 (0.35, 2.32) 1.0
United States 4 0.5 1.40 (1.04, 1.89) 1.56 (0.58, 4.22)
Diabetes adjusted
No 4 0.02 1.24 (0.69, 2.23) 1.0
Yes 2 0.7 1.50 (0.76, 2.98) 1.21 (0.49, 2.99)
Oral hygiene practices
Yes 2 0.03 1.04 (0.65, 1.65) 1.0
No 4 0.6 1.57 (1.10, 2.24) 1.51 (0.84, 2.71)
Pregnant/postpartum only
Yes 1 — 0.66 (0.31, 1.39) —
No 5 0.4 1.42 (1.17, 1.71)
periodontitis,52 but this finding is not universal.53 As expected, stud-ies that did not adjust for oral hygiene practices produced slightly stronger associations than studies that adjusted for oral hygiene practices (Table 2 and Supplementary Table S3).
Contrary to our expectation, the stratified POR derived from adjusted estimates reported by the original authors (n = 5) were higher compared with the unadjusted summary POR we estimated (n = 1). This was surprising for the same reasons cited above, namely non-adjustment will produce a POR that is biased up and away from the null. Given the slight heterogeneity in estimates reported by the authors (95% CI = [1.02, 1.87], 95% CLR = 1.83 and 95% PI = [0.80, 2.40], 95% PLR = 3.0), it is probable that the respective adjusted estimates may be noncomparable due in part to differences in adjustment covariates.
Studies from the United States (n = 4), on average, produced stronger associations than studies from elsewhere (n = 2). A plau-sible reason for this may be preferential publication of studies with positive associations in the United Studies more so than elsewhere. Studies conducted among pregnant/postpartum women produced inverse association though highly imprecise compared with studies not restricted to this population. It is likely that any associated gin-givitis and/or periodontitis in this population may have been a result of pregnancy.
Pollutants in active mainstream smoke are reported to suppress host defense mechanisms by reducing the functional capability, that is, the chemotactic and phagocytic capabilities of leukocytes and macrophages,54 thereby promoting periodontal disease initiation and progression. Although the pollutants in ETS are at a lower con-centration than levels in active mainstream smoke, it is possible that the periodontal pathologic effects of these pollutants are occurring through similar mechanisms, thus explaining the elevated markers of periodontitis among exposed nonsmokers as reported by two of the studies18,19 that were ineligible for the primary or sensitivity analysis of our meta-analysis.
There were several limitations to the studies we reviewed. The first is with respect to study design and analytic method. In principle, stronger evidence would come from prospective cohort studies that determine ETS at enrollment and relating it to subsequent events of periodontitis. Among the cross-sectional studies we reviewed, a more appropriate estimate for meta-analysis would have been the prevalence difference. From studies that reported prevalence of periodontitis endpoints among unexposed nonsmokers (ie, baseline prevalence), three reported prevalence estimates of 2.3%,23 7.9%,22 and 21% (Table 1).17 Using the summary POR estimate of 1.54 from the cotinine studies, and these baseline prevalence estimates, we estimated the respective PDs for periodontitis endpoints comparing exposed-to-unexposed nonsmokers to be approximately 1%, 4%, and 8%. Thus, if there was an intervention that removed ETS, the preceding PDs correspond to values of 100, 25, and 13, respectively, for numbers needed treat.
Second, we considered two distinct endpoints of periodontitis— probing derived measures (CAL and/or PD) and tooth loss. Although the summary estimates revealed only small POR differences between studies that differed according to these endpoints, there were too few studies to be certain. A third problem is that the definition of nonsmokers was not homogeneous across the studies. Specifically, nonsmokers were identified as smoking less than <400 cigarettes in a lifetime in one study25 and <100 cigarettes in a lifetime in oth-ers,22,23,30,31 while the rest of the studies were based on the levels of salivary cotinine among those who self-reported as never-smokers.
Therefore, the direction of bias from this measurement error would be upward, if, for instance, ETS-exposed persons were more likely than not to be active smokers misclassified as nonsmokers. Likewise, it appears that no consensus exists with respect to the threshold for nonexposure to ETS among nonsmokers. Studies used values of <7 ng/ml of salivary cotinine,18–20 <0.05 ng/ml,23 and <0.015ng/ml31 serum cotinine after determining they were nonsmokers based on self-report. Although serum and salivary cotinine levels are corre-lated, levels in saliva are reported to be about 10%–40% higher than serum levels.46,47 Thresholds used in these studies were vastly differ-ent and not in the range of a 10%–40% difference. Although pre-vious investigations have used serum cotinine level of ≤14ng/ml as indicative of ETS exposure among nonsmokers,55 this value has since been discarded because of the limited indoor smoke-free laws and the corresponding high levels of exposure to ETS at the time of that report. A recent US study found serum cotinine levels to differ by race/ethnicity and reported thresholds of ≤6ng/ml for blacks, ≤5ng/ ml for whites, and ≤1ng/ml for Hispanics and an overall threshold of ≤3ng/ml for the entire US population of nonsmokers.47
For this meta-analysis, we could only examine ETS exposure as binary because exposure categories varied among studies, thus preclud-ing us from investigatpreclud-ing the exposure more finely. Dichotomization disregards variability in exposure and may have produced exposure misclassification, as those recently exposed are included in the same group as those exposed for longer periods, thus either diluting or exaggerating exposure effects based on what the true effect may be.
This systematic review provides a summary of the published observational epidemiological literature with its corresponding limitations. Methodological weaknesses were present to some extent in all the studies we reviewed, and there was little variability in study samples. Many of the respective studies were conducted either among Japanese (n = 5) or among Americans (n = 5), and all were from developed economies. In addition to this, correct infer-ences from some of the studies may have been limited by their small samples.
Lastly, there is a potential upward bias, such that publica-tions with positive association were more likely as opposed to null or inverse associations to be published as indicated by the visual appearance of funnel plot asymmetry. Although there were high P values from our funnel plot analysis, they are not reassuring because the Begg test, for instance, is reported to have moderate power with 50 studies.32 Additionally, our funnel plot analysis can be misleading because from eight eligible studies, we created a funnel plot from the six that reported on CAL and/or PD, while it is recommended to conduct a funnel plot analysis with at least 10 studies.56
Conclusion
Supplementary Material
Supplementary Text and Tables S1–S4 can be found online at http:// www.ntr.oxfordjournals.org
Funding
This work was supported by the National Institute of Health NRSA T90 Training grant NIH/NIDCR (5T90DE021986) to AA.
Declaration of interests
None declared.References
1. U.S. Department of Health and Human Services. The Health Consequences
of Involuntary Smoking: A Report of the Surgeon General. Washington, DC: U.S. Department of Health and Human Services, Centers for Disease Control and Prevention, Coordinating Center for Health Promotion, National Center for Chronic Disease Prevention and Health Promotion, Office on Smoking and Health; 1986: 87–8398. www.ncbi.nlm.nih.gov/ books/NBK44324/. Accessed August 7, 2014
2. Do LG, Slade GD, Roberts-Thomson KF, Sanders AE. Smoking-attributable periodontal disease in the Australian adult population. J Clin Periodontol. 2008;35(5):398–404. doi:10.1111/j.1600051X.2008.01223.x
3. Thomson WM, Broadbent JM, Welch D, Beck JD, Poulton R. Cigarette smoking and periodontal disease among 32-year-olds: a prospective study of a representative birth cohort. J Clin Periodontol. 2007;34(10):828–834. doi:10.1111/j.1600-051X.2007.01131.x
4. Tomar SL, Asma S. Smoking-attributable periodontitis in the United States: findings from NHANES III. National Health and Nutrition
Examination Survey. J Periodontol. 2000;71(5):743–751. doi:10.1902/
jop.2000.71.5.743
5. Susin C, Oppermann RV, Haugejorden O, Albandar JM. Periodontal attachment loss attributable to cigarette smoking in an urban
Brazilian population. J Clin Periodontol. 2004;31(11):951–958.
doi:10.1111/j.1600-051x.2004.00588.x
6. Baab DA, Oberg PA. The effect of cigarette smoking on gingival blood
flow in humans. J Clin Periodontol. 1987;14(7):418–424. doi:10.1111/
j.1600-051X.1987.tb01547.x
7. Jinot J, Bayard S. Respiratory health effects of passive smoking: EPA’s weight-of-evidence analysis. J Clin Epidemiol. 1994;47(4):339–349; dis-cussion 351-333. doi:10.1016/08954356(94)90154–6
8. Glantz SA, Parmley WW. Passive smoking and heart disease.
Epidemiology, physiology, and biochemistry. Circulation. 1991;83(1):1–
12. doi:10.1161/01.CIR.83.1.1
9. Javed F, Bashir Ahmed H, Romanos GE. Association between environmen-tal tobacco smoke and periodonenvironmen-tal disease: A systematic review. Environ
Res. 2014;133c:117–122. doi:10.1016/j.envres.2014.05.008
10. Hujoel PP, Leroux BG, DeRouen TA, Powell LV, Kiyak HA. Evaluating the validity of probing attachment loss as a surrogate for tooth mortality in a clinical trial on the elderly. J Dent Res. 1997;76(4):858–866. doi:10.1177 /00220345970760040701
11. Walter C, Kaye EK, Dietrich T. Active and passive smoking: assessment
issues in periodontal research. Periodontol 2000. 2012;58(1):84–92.
doi:10.1111/j.1600-0757.2011.00417.x
12. Eramo S, Tassi C, Negri P, Manta M, Fraschini M, Pedetta F. ELISA
analy-sis of salivary cotinine in smokers. Minerva Stomatol. 2000;49(4):163–
168. PMID:11040542.
13. Chatrchaiwiwatana S, Ratanasiri A. Association between exhaled carbon
monoxide and oral health status in active and passive smokers. J Med
Assoc Thai. 2011;94(5):601–609. PMID:21675451.
14. Page RC, Eke PI. Case definitions for use in population-based
surveil-lance of periodontitis. J Periodontol. 2007;78(7 Suppl):1387–1399.
doi:10.1902/jop.2007.060264
15. Eke PI, Page RC, Wei L, Thornton-Evans G, Genco RJ. Update of the
case definitions for population-based surveillance of periodontitis. J
Periodontol. 2012;83(12):1449–1454. doi:10.1902/jop.2012.110664 16. Arora M, Schwarz E, Sivaneswaran S, Banks E. Cigarette smoking and
tooth loss in a cohort of older Australians: the 45 and up study. J Am Dent Assoc. 2010;141(10):1242–1249. doi:http://dx.doi.org/10.14219/jada. archive.2010.0052
17. Tanaka K, Miyake Y, Sasaki S, et al. Active and passive smoking and tooth loss in Japanese women: Baseline data from the Osaka Maternal and
Child Health Study. Ann Epidemiol. 2005;15(5):358–364. doi:10.1016/j.
annepidem.2004.12.005
18. Nishida N, Yamamoto Y, Tanaka M, et al. Association between passive smoking and salivary markers related to periodontitis. J Clin Periodontol. 2006;33(10):717–723. doi:10.1111/j.1600-051X.2006.00982.x 19. Nishida N, Yamamoto Y, Tanaka M, et al. Association between
invol-untary smoking and salivary markers related to periodontitis: a 2-year
longitudinal study. J Periodontol. 2008;79(12):2233–2240. doi:10.1902/
jop.2008.080149
20. Yamamoto Y, Nishida N, Tanaka M, et al. Association between passive and active smoking evaluated by salivary cotinine and
periodontitis. J Clin Periodontol. 2005;32(10):1041–1046.
doi:10.1111/j.1600-051X.2005.00819.x
21. Tanaka K, Miyake Y, Hanioka T, Arakawa M. Active and passive
smok-ing and prevalence of periodontal disease in young Japanese women. J
Periodontal Res. 2013;48(5):600–605. doi:10.1111/jre.12044
22. Arbes SJ, Jr., Agustsdottir H, Slade GD. Environmental tobacco smoke
and periodontal disease in the United States. Am J Public Health.
2001;91(2):253–257. doi:10.2105/AJPH.91.2.253
23. Sanders A, Slade G. State cigarette excise tax, secondhand smoke
exposure, and periodontitis in US nonsmokers. Am J Public Health.
2013;103(4):740–746. doi:10.2105/AJPH.2011.300579
24. Greenland S, Pearce N. Statistical foundations for model-based
adjust-ments. Annu Rev Public Health. 2015;36:89–108. doi:10.1146/
annurev-publhealth-031914-122559
25. Sanders AE, Slade GD, Beck JD, Agustsdottir H. Secondhand smoke and periodontal disease: atherosclerosis risk in communities study. Am J Public Health. 2011;101(Suppl 1):S339–S346. doi:10.2105/ajph.2010.300069 26. Greenland S, Longnecker MP. Methods for trend estimation from
sum-marized dose-response data, with applications to meta-analysis. Am J
Epidemiol. 1992;135(11):1301–1309. PMID:1626547
27. Orsini N, Bellocco, R, Greenland S. Generalized least squares for trend estimation of summarized dose-response data. Stata J. 2006;6(1):40–57. www.statajournal.com/article.html?article=st0096. Accessed October 13, 2014.
28. Il’yasova D, Hertz-Picciotto I, Peters U, Berlin JA, Poole C. Choice of exposure scores for categorical regression in meta-analysis: a case study
of a common problem. Cancer Causes Control. 2005;16(4):383–388.
doi:10.1007/s10552-004-5025-x
29. Erdemir EO, Sonmez IS, Oba AA, Bergstrom J, Caglayan O. Periodontal
health in children exposed to passive smoking. J Clin Periodontol.
2010;37(2):160–164. doi:10.1111/j.1600-051X.2009.01510.x
30. Ho A, Grossi S, Genco RJ. Assessment of passive smoking and risk for periodontal disease [abstract]. J Dent Res. 1999;78:542. doi:10.1177/002 2034599078S101
31. Akinkugbe AA, Slade GD. Environmental Tobacco Smoke is Associated With Periodontitis in U.S. Non-smokers. Boston, MA: American Association for Dental Research; 2015. https://live.blueskybroadcast.com/bsb/client/_new_ default.asp?action=SEARCH&Client=404900. Accessed June 20, 2015. 32. Begg CB, Mazumdar M. Operating characteristics of a rank
correla-tion test for publicacorrela-tion bias. Biometrics. 1994;50(4):1088–1101.
doi:10.2307/2533446
33. Egger M, Davey Smith G, Schneider M, Minder C. Bias in meta-analy-sis detected by a simple, graphical test. BMJ. 1997;315(7109):629–634. doi:http://dx.doi.org/10.1136/bmj.315.7109.629
35. Johnson GK, Guthmiller JM. The impact of cigarette smoking on
peri-odontal disease and treatment. Periodontol 2000. 2007;44:178–194.
doi:10.1111/j.1600-0757.2007.00212.x
36. Sutton JD. Environmental Tobacco Smoke and Periodontitis in U.S. Non-smokers [1496640]. Ann Arbor, MI: ProQuest Dissertations and Theses, The University of North Carolina at Chapel Hill; 2011. http://search.pro-quest.com/docview/883119479?accountid=14244. Accessed December 21, 2013.
37. Agustsdottir H. Hormone Replacement Therapy, Active and Passive Smoking, and Periodontal Disease [9993265]. Ann Arbor, MI: ProQuest Dissertations and Theses, The University of North Carolina at Chapel Hill; 2000. http://search.proquest.com/docview/304608948?accountid=14244. Accessed December 21, 2013.
38. Sutton JD, Ranney LM, Wilder RS, Sanders AE. Environmental
tobacco smoke and periodontitis in U.S. non-smokers. J Dent Hyg.
2012;86(3):185–194. PMID: 22947841
39. Tomar SL. Involuntary exposure to cigarette smoke may increase risk for progression of periodontitis. J Evid Based Dent Pract. 2009;9(4):229–230. doi:10.1016/j.jebdp.2009.05.008
40. Secondhand smoke may increase periodontal disease risk. J Am Dent Assoc. 2001;132(4):440, 444. doi:http://dx.doi.org/10.14219/jada.archive.2001.0198 41. Sridharan S, Ganiger K, Satyanarayana A, Rahul A, Shetty S. Effect of
environmental tobacco smoke from smoker parents on gingival pigmenta-tion in children and young adults: a cross-secpigmenta-tional study. J Periodontol. 2011;82(7):956–962. doi:10.1902/jop.2010.100479
42. Kum-Nji P, Meloy L, Herrod HG. Environmental tobacco smoke expo-sure: prevalence and mechanisms of causation of infections in children. Pediatrics. 2006;117(5):1745–1754. doi:10.1542/peds.2005-1886 43. Azar R, Richard A. Elevated salivary C-reactive protein levels are
associ-ated with active and passive smoking in healthy youth: A pilot study. J Inflamm (Lond). 2011;8(37). doi:10.1186/1476-9255-8-37
44. Sadaoka S, Yagami K, Maki S. Nicotine in cigarettes promotes
chromogra-nin A production by human periodontal ligament fibroblasts. Arch Oral
Biol. 2013;58(8):1029–1033. doi:10.1016/j.archoralbio.2013.02.012
45. Beklen A, Uckan D, Memet GT. Periodontal disease of secondhand
smok-ing patients. Tob Induc Dis. 2014;12. doi:10.1186/1617-9625-12-S1-A11
46. Benowitz NL. Cotinine as a biomarker of environmental tobacco smoke
exposure. Epidemiol Rev. 1996;18(2):188–204.
doi:10.1093/oxfordjour-nals.epirev.a017925
47. Benowitz NL, Bernert JT, Caraballo RS, Holiday DB, Wang J. Optimal serum cotinine levels for distinguishing cigarette smokers and nonsmok-ers within different racial/ethnic groups in the United States between
1999 and 2004. Am J Epidemiol. 2009;169(2):236–248. doi:10.1093/aje/
kwn301
48. Hujoel PP. Endpoints in periodontal trials: the need for an
evidence-based research approach. Periodontol 2000. 2004;36(1):196–204.
doi:10.1111/j.1600-0757.2004.03681.x
49. Mealey BL, Oates TW. Diabetes mellitus and periodontal diseases. J
Periodontol. 2006;77(8):1289–1303. doi:10.1902/jop.2006.050459 50. Mealey BL. Periodontal disease and diabetes. A two-way street. J Am Dent
Assoc. 2006;137(Suppl.):26S–31S. doi:http://dx.doi.org/10.14219/jada. archive.2006.0404
51. Taylor GW, Borgnakke WS. Periodontal disease: associations with
dia-betes, glycemic control and complications. Oral Dis. 2008;14:191–203.
doi:10.1111/j.1601-0825.2008.01442.x
52. Amarasena N, Ekanayaka AN, Herath L, Miyazaki H.
Tobacco use and oral hygiene as risk indicators for
periodon-titis. Community Dent Oral Epidemiol. 2002;30:115–123.
doi:10.1034/j.1600-0528.2002.300205.x
53. Merchant A, Pitiphat W, Douglass CW, Crohin C, Joshipura K. Oral
hygiene practices and periodontitis in health care professionals. J
Periodontol. 2002;73(5):531–535. doi:10.1902/jop.2002.73.5.531 54. Haffajee AD, Socransky SS. Relationship of cigarette smoking to the
subgingival microbiota. J Clin Periodontol. 2001;28(5):377–388.
doi:10.1034/j.1600-051x.2001.028005377.x
55. Jarvis MJ, Tunstall-Pedoe H, Feyerabend C, Vesey C, Saloojee Y.
Comparison of tests used to distinguish smokers from nonsmokers. Am J
Public Health. 1987;77(11):1435–1438. doi:10.2105/AJPH.77.11.1435 56. Higgins JPT, Green S, eds. Cochrane Handbook for Systematic Reviews