Non-targeted analysis of placentas from preeclamptic patients identifies links to acetaminophen and molecular alterations relevant to cell death
Celeste Carberry
Honors Thesis ENHS
Department of Environmental Sciences and Engineering
Gillings School of Global Public Health
The University of North Carolina at Chapel Hill
Spring, 2020
Approved:
__________________________________ Dr. Julia Rager (Advisor)
__________________________________ Dr. Rebecca Fry (Reader)
ABSTRACT
Preeclampsia is a serious pregnancy disorder that is thought to result from the dysregulation of
placental function and can be detrimental to both the mother and developing fetus. Preeclampsia
impacts up to 8% of all pregnancies worldwide, yet the factors contributing to the development
of this disease remain largely unknown. This study set out to test the hypothesis that
understudied xenobiotic chemicals are capable of reaching the human placenta and disrupting
critical pathways relevant to placental cell health and preeclampsia. Placentas from a previously
established cohort of patients with normotensive and preeclamptic pregnancies were analyzed
using non-targeted approaches to identify unknown molecular features. A total of 29 molecular
features that represent 27 unique chemicals were statistically associated with preeclampsia
disease status. One of the identified chemicals showing the largest increase in concentration was
acetaminophen. Concentrations of acetaminophen were found to be associated with altered
expression of 27 genes and 57 miRNAs and altered methylation status of 18 genes relevant to
preeclampsia among the same samples. Acetaminophen-associated genes showed enrichment for
cell compromise and death-related signaling, which were further characterized through in vitro
testing with immortalized trophoblasts. This research provides novel evidence towards
characterizing chemicals in the placental and identified APAP as one of the most significantly
associated compounds related to preeclampsia. Mechanistic findings showed changes in
signaling relevant to placental cell damage and death that may be relevant to preeclampsia
ACKNOWLEDGEMENTS
TABLE OF CONTENTS
Page
List of Tables 4
List of Figures 4
Introduction 5
Material and Methods 7
Results 22
Discussion 33
References 40
List of Tables
Table No. Description Page
1 27 chemicals, represented by 29 molecular features, identified with abundance levels associated with preeclamptic (PE) vs. normotensive (CT) pregnancies.
24
2 Biological functions and diseases enriched amongst
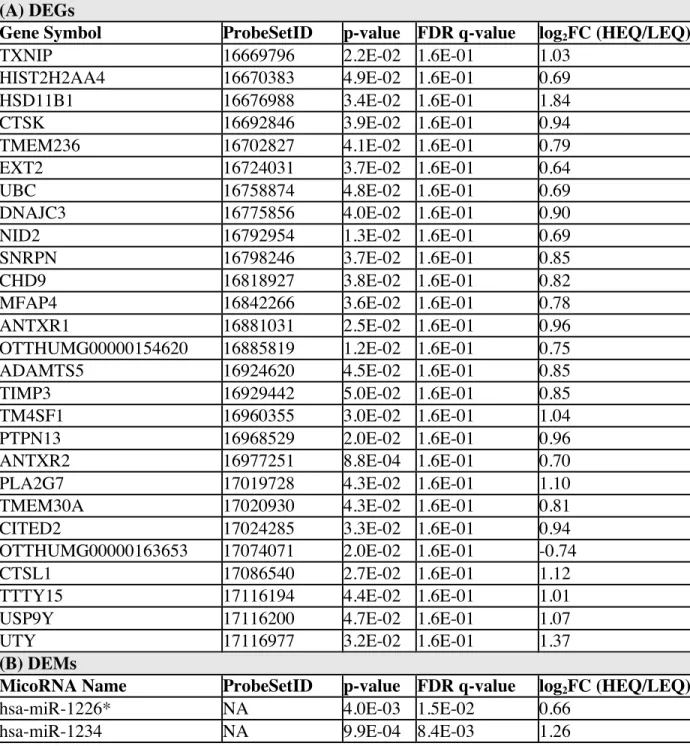
preeclampsia-relevant differentially expressed genes (DEGs), differentially expressed microRNAs (DEMs), and differentially methylated genes (DMGs) associated with acetaminophen levels in placenta tissues.
29
List of Figures
Figure No. Description Page
1 Molecular features detected in placenta samples and associated with Preeclampsia
23
2 APAP was measured at significantly increased levels in tissues from preeclamptic vs. normotensive pregnancies through two analytical approaches
27
3 Integrated -omic networks showing APAP-associated changes relevant to cell death
30
4 Characterization of PARP expression in APAP Etoposide treated SVneo cells.
31
5 Analysis of apoptotic, late-stage apototic/necrotic, and dead SVneo cells
32
6 Gene expression analysis of APAP treated placental cells shows 5 significant genes differentially expressed when compared to control group
INTRODUCTION
Chemical exposures during pregnancy can significantly impact maternal and fetal health,
with potential to lead to serious pregnancy outcomes such as preeclampsia [1]. Preeclampsia
impacts up to 8% of all pregnancies worldwide, and causes yearly deaths of ~70,000 women and
~500,000 fetuses, globally [2, 3]. This condition is typically diagnosed by elevated maternal
blood pressure and maternal proteinuria after approximately 20 weeks of gestation, and often
forces premature delivery due to maternal risk associated with high blood pressure and
compromised blood flow to the fetus [4]. There is a current knowledge gap surrounding potential
risk factors that may impact preeclampsia case status, with expanding evidence supporting the
potential role of certain pharmaceuticals and environmental chemicals [1, 5, 6]. Furthermore, the
complete etiology and mechanistic events associated with this disease remain to be fully
established.
Chemical exposures that occur during pregnancy contribute to the maternal and fetal
‘exposome’: the non-genetic factors that may influence pregnancy-related health outcomes [7].
Exposures during pregnancy may include complex mixtures of chemicals, a portion of which
have been shown to reach the placental barrier. For example, various classes of chemicals such
as pharmaceuticals, metals, per- and polyfluoroalkyl substances, phenols, pesticides, flame
retardants, and toxins have been measured in maternal serum, cord blood, or placental tissue
[8-13]. Still, the majority of chemicals to which humans are exposed to remain largely understudied
in relation to toxicological health outcomes, especially with regard to maternal and fetal health
outcomes [1]. This research gap is of particular concern given the increased vulnerability of
pregnant women and developing fetuses to potential adverse health outcomes associated with
While the etiology of preeclampsia is thought to be multifactorial, it is well established
that preeclampsia onset occurs as a result of placental dysfunction [14]. As the barrier between
the maternal and fetal exposome, the placenta is responsible for the active transport of nutrients
and oxygen to the developing fetus, and the transfer of waste and other potentially harmful
elements out [15]. This is achieved in part via the invasion and remodeling of the uterine
vasculature via trophoblasts, one of the primary cell types in the placenta [16]. However,
improper placental implantation due to failure of spiral artery transformation may result in
inadequate blood flow and thus has been linked to preeclampsia [17]. The ability of chemicals to
reach the placenta and potentially disrupt critical mechanisms of placental health makes it is
necessary to evaluate this target tissue and better understand links between xenobiotic exposures,
mechanistic biological responses, and pregnancy outcomes such as preeclampsia.
This study set out to test the hypothesis that understudied xenobiotics are capable of
reaching the human placenta and disrupting critical pathways relevant to placental cell health and
preeclampsia. Using non-targeted measures within placentas collected from preeclamptic and
normotensive patients, we sought to identify potential chemicals in the placenta that are
associated with preeclampsia, focusing on those captured by the Agilent Personal Compound
Database and Library (PCDL). APAP was identified as one of the chemicals most significantly
increased in concentration in tissues from preeclamptic patients and selected for follow-up
confirmation, analysis, and in vitro testing. Genomic and epigenomic profiling of the same placental tissues identified altered cell signaling relevant to cell death mechanisms associated
with APAP, which were further characterized in immortalized trophoblasts. These methods
provide a proof-of-concept for testing chemicals of toxicological interest from non-targeted
METHODS
Cohort description and placenta sample collection
The cohort included in this study consisted of women recruited from the University of North
Carolina (UNC) hospitals and have been described previously [5, 18, 19]. In brief, participants
consented to study participation at the time of delivery and consisted of 36 women (17
normotensive patients and 19 preeclamptic patients). Patients with preeclampsia were identified
as those exhibiting sustained de novo hypertension (>140/90 mmHg) and proteinuria (³ 300 mg
of protein within a 24-hour urine collection or a urine protein/creatinine ratio of ³ 0.3mg/dL),
that developed at ³ 20 weeks of pregnancy, in accordance with the preeclampsia syndrome
definition by the American Congress of Obstetricians and Gynecologists. For study inclusion,
preeclamptic patients also had to show either blood pressure >160/110 mmHg, severe neurologic
complications, or lab abnormalities consistent with HELLP (hemolysis, elevated liver enzymes,
low platelet count). Subjects were excluded if they had confounding conditions, including
pre-diabetes, pre-diabetes, and gestational diabetes. This research was approved by the Institutional
Review Board at the University of North Carolina (#11–2054).
Demographic data have been summarized and published previously [18], and are recapitulated
here in Supplemental Table S1. The majority of participants were non-smokers with primipara. Participants consisted of a variety of races, the majority of which were African American (42%)
or Caucasian (31%). The mean age across the study cohort was 28.3 years. The distributions of
demographic variables were compared between preeclamptic cases vs. controls, as previously
detailed [18], and gestational age was the only variable that significantly differed between the
patients delivered on average at 38.6 weeks (p<0.01) (Supplemental Table S1). Placenta samples were collected after delivery, and full-thickness placental biopsies were acquired,
avoiding peripheral areas as well as areas of obvious infarction. Biopsies were immediately flash
frozen in liquid nitrogen and stored at -80°C until further processing.
Placental tissue processing for chemical analyses
Placenta samples were prepared for chemical analyses by first isolating an approximately
0.5-gram cross section slice from the middle of each sample. Samples without tissues or analyte were
extracted in parallel as a method blank. Chemicals were separated from tissue via solid-liquid
extraction by first adding room temperature H2O: acetonitrile 1:1 to each placenta sample.
Placenta samples were disrupted and homogenized using a TissueRuptor (Qiagen), vortexed
vigorously for 5 minutes, and placed in a centrifuge at 4000 rpm for 5 minutes. The resulting
supernatant was collected and a second round of solid-liquid extraction was performed using
acetonitrile with 2% formic acid. Samples were vortexed and centrifuged again, and both
supernatants combined. The combined supernatants were run through solid filtration through a
Captiva EMR-lipid column, allowing gravity elution and collection of eluates of which 1.0 mL
was transferred to a liquid chromatography and mass spectrometry vial. For non-targeted
chemical analysis, 20uL of 1.25ug/mL tracer was added to 1.0 mL of post-filtration eluate for
Non-targeted analysis of chemicals in placenta extracts
Liquid extracts of placenta samples were analyzed via liquid chromatography mass spectrometry
(LCMS) using an Agilent 1290 Infinity II ultra-high-performance liquid chromatograph
(UHPLC) coupled to an Agilent 6546 high-resolution quadrupole time-of-flight (Q-TOF) mass
spectrometer with a dual AJS electrospray ionization source. Source parameters were as follows:
drying gas temperature = 300°C; drying gas flow = 9 L/min; nebulizer gas = 35 psi; sheath gas
temperature = 350°C; sheath gas flow = 11 L/min; Vcap = 3500V (3000V in negative mode);
nozzle voltage = 0V (2000V in negative mode); and fragmentor = 100 V. An Agilent Zorbax
Eclipse Plus C8 (2.1 µm x 100 mm, 1.9 µm). UHPLC column was used for compound separation
(part number: 959758-906) and the column temperature was set to 40°C. Mobile phases
consisted of (A) deionized water (Millipore MilliQ Water System) with 0.1% formic acid
(Fisher) and (B) 90:10 acetonitrile (Alfa Aesar):deionized water with 0.1% formic acid for
LCMS analyses run in positive ionization mode. For analyses run in negative ionization mode,
mobile phases were identical with the addition of 0.5 mM ammonium fluoride (Fluka) to both
mobile phases. The flow rate was set at 0.5 mL/min, and mobile phases were ramped with the
following gradient: 0-1 min = 5% B; 1-7 min 5-80% B ramp; 7-9 min = 80-90% B ramp; 9-10
min = 90-100% B ramp; 10-12 min = 100% B; and 12-13.5 min = 5% B. Each sample extract
was analyzed in full scan mode (MS1) with triplicate injections (2 µL) in each ionization mode.
A fully randomized run sequence was used, which included replicates of solvent blanks, method
blanks, and pooled QC samples. For MS1 analysis, the scan range was 100-1000 m/z with a scan
speed of 2 spectra/sec. A reference solution consisting of purine,
(TFA) was infused into the source during each run to auto-correct mass drift. Data-dependent
acquisition MS2 (auto MSMS) was also performed on each sample extract in both positive and
negative ionization modes, cycling between collision energies of 10, 20, and 40 eV. MS2 data
were acquired with the following settings: scan range 40-1000 m/z; 6 max precursors per cycle;
minimum threshold 3000 counts; scan speed 5 spectra/sec, medium isolation width (4 m/z);
active exclusion enabled after 3 MS2 spectra; exclusion release time 0.2 minutes. MS2 exclusion
lists were used to exclude ions corresponding to compounds in the reference solution.
HRMS data processing
MS1 and MS2 feature data were processed separately using a combination of vendor software
and an NTA web application (hereafter, the “WebApp”) developed by the US EPA.
MS1 Data Processing
Agilent Profinder software (v.10) was first used to recursively extract and align MS1 molecular
features across all study samples, pooled QC samples, and method blanks. Here, molecular
features represent associated m/z peaks corresponding to an unknown compound. All molecular
features observed in ESI+ mode were initially assumed to be [M+H]+ ion species, and all
molecular features observed in ESI- mode were initially assumed to be [M-H]- ion species.
Under these assumptions, grouped m/z peaks for a given feature reflect isotopologue peaks, but
not fragment, neutral loss, additional adduct (e.g., [M+Na]+), or multimer peaks. The retention
time (RT) and predicted monoisotopic mass for each molecular feature, along with the observed
raw intensity of that feature in each study sample and blank, was included in an MS1 output
Separate MS1 output tables for ESI+ and ESI- mode data were loaded into the NTA WebApp,
along with a file containing experimental and intrinsic property information for the spiked tracer
compounds. For the current application, the NTA WebApp performed a series of data processing
procedures to enable subsequent statistical analysis and feature identification. These steps
include: 1) duplicate feature removal; 2) statistical parameter estimation; 3) data filtering; 4)
blank subtraction; 5) feature flagging; and 6) tracer compound identification.
For step 1, the NTA WebApp identified and removed superfluous molecular features generated
via recursive extraction and alignment. For step 2, the NTA WebApp calculated the mean,
median, standard deviation, and coefficient of variation (CV) of intensity values, along with the
number of hits across sample and blank replicates, for each feature. These statistical parameter
estimates were used in Step 3 of WebApp processing for data filtering. Specifically, in Step 3, it
was required that any given feature, in any given sample, be observed in 2/3 injection replicates
with a coefficient of variation ≤ 0.80. Sample-specific intensity values not meeting these criteria
were dropped for that sample only. Any feature not meeting these criteria across all samples was
dropped from the full dataset. Furthermore, any feature not having a single median sample
intensity ≥ 3× the median blank intensity was dropped from the full dataset.
After data filtering (Step 3), the median feature intensities for the method blanks were subtracted
from the median feature intensities for the individual samples. All blank-subtracted values <0
were set to 0. After blank subtraction (Step 4), a series of calculations was performed by the
WebApp to flag individual features based on observed characteristics (Step 5). For example,
as [M+H]+ or [M-H]- ion species during initial processing) were flagged for further manual
review. Finally, in Step 6, the WebApp extracted all processed data for the spiked tracer
compounds. Calculations for these compounds (i.e., mass error and RT deviation) were the basis
for QA/QC evaluation of method performance.
MS2 Data Processing
Reference MS2 spectra from six Agilent Personal Compound Database and Library (PCDL)
databases (Environmental water screening, Pesticides, Forensic toxicology, Veterinary drugs,
Metlin, and Extractables and leachables) were combined into a composite PCDL. For tentative
chemical candidate identification, experimental MS2 spectra were searched against the
composite PCDL using Agilent MassHunter Qualitative Analysis software (version B.10) with
forward and reverse scoring thresholds of 0 and 20, respectively. Spectral matches were
manually reviewed in order to boost confidence in tentative compound identifications. Results
from MS2 spectral matching were mapped to processed MS1 features using match tolerances of
10 ppm for mass accuracy and 0.2 min for RT.
Statistical analysis to identify molecular features associated with preeclampsia
Processed feature data with tentative chemical identifications (based on PCDL matching) were
the basis for statistical hypothesis testing across preeclampsia and normotensive sample groups.
Statistical procedures were performed using SAS statistical software v.9.4 (Cary, NC). Processed
molecular feature data were not normally distributed. A non-parametric procedure was therefore
used to test for differences in feature intensities across groups. Specifically, the Wilcoxon
feature intensity was defined using a false discovery rate (FDR) corrected q-value <0.2 for
associations with preeclampsia. An additional filter was also applied to consider the magnitude
of change in feature abundance. For this filter, the overall median intensity was calculated for
both sample groups, and fold change (FC) in feature abundance was calculated dividing the
overall median intensity in preeclampsia patients by the overall median intensity in normotensive
patients. Features not measured in any normotensive patients were assigned a FC of 1000.
Likewise, features not measured in any preeclampsia patients were assigned a FC of 0.001.
Resulting FC values were log2-transformed, and then used to filter features by requiring FC ³ ±
log2(1.5).
Genomic and epigenomic profiling of the placental samples
Nucleic acids were extracted from the same placentas as used for the non-targeted analysis as
previously described [18, 19]. In brief, a subsection (approximately 0.2g) was sliced from each
frozen tissue samples on dry ice using a sterile dermal curette and washed in sterile 1x PBS to
remove any potential blood contamination. Samples were then immediately homogenized in
Buffer RLT containing b-mercaptoethanol using a TissueRuptor (Qiagen, Valencia, CA).
Nucleic acids were extracted from the resulting homogenate using the AllPrep
DNA/RNA/miRNA Universal Kit according to the manufacturer’s instructions (Qiagen), which
yielded RNA sequences 18 nucleotides and greater in length as well as DNA from the sample
tissue samples. Extracted DNA and RNA were quantified with a Nanodrop 1000
spectrophotometer (Thermo Scientific, Waltham, MA) and RNA integrity verified with a 2100
Genome-wide gene expression profiles were evaluated by labeling and hybridizing RNA
samples to the Affymetrix GeneChipTM Human Gene 2.0 ST array as previously described [18,
19]. This microarray assesses the relative expression levels of >25,000 mRNAs using 53,617
probesets. Resulting gene expression data were normalized by robust multi-chip average [20]
and log2-transformed prior to statistical evaluation. Genome-wide miRNA expression profiles
were evaluated by labeling and hybridizing RNA samples to the Agilent Human miRNA
Microarray (v16) as previously described [19]. This microarray assesses the relative expression
levels of 1347 miRNAs using 56,044 probesets. Resulting miRNA expression data were
collapsed according to individual miRNA using the median signal, normalized by quantiles, and
log2-transformed prior to statistical evaluation, as done previously [19, 21].
Genome-wide CpG methylation profiles were evaluated using the InfiniumÒ
HumanMethylation450 BeadChip array (Illumina, Inc., San Diego, CA) as previously described
[18]. This array assesses the CpG methylation levels of 486,428 sites across the DNA at single
nucleotide resolution. Prior to array hybridization, DNA was first bisulfite-converted using the
EZ DNA methylation kit (Zymo Research, Irvine, CA). Resulting methylation array data were
produced as b values, where b = intensity of the methylated allele (M) / (intensity of the
unmethylated allele (U) + intensity of the methylated allele (M) + 100). Data were pre-processed
in accordance with an established 450k Chip Analysis Methylation Pipeline [22]. Probes within
sites of known single nucleotide polymorphisms were removed, as were probes with detection
p-values > 0.01 to control for probe quality, leaving 390,452 probes that were then quantile
All genomic and epigenomic data were analyzed for quality assessment and quality control using
standard measures [23], including visualizations of signal-to-noise ratio,
root-mean-square-deviation, MA plots, and principal component analysis to identify potential chip/batch/positional
effects and/or sample outliers. All array data were deposited into the National Center for
Biotechnology Information (NCBI) Gene Expression Omnibus repository and publicly available
under accession numbers GSE73374, GSE73375, and GSE84260 [24].
Statistical analysis to identify preeclampsia-relevant genomic and epigenomic alterations associated with APAP
To identify potential molecular changes associated with APAP, genomic and epigenomic
signature placenta tissue data were evaluated in relation to the chemical identified as high
priority through non-targeted analysis, APAP. APAP concentrations (log2-transformed) were
statistically related to gene expression, miRNA expression, and CpG methylation signatures
from the same placenta samples. The placental genomic and epigenomic signature data were first
filtered to focus on molecules with known association to preeclampsia based on our previously
published analyses (and thus referred to as ‘preeclampsia-relevant’) [18, 19]. Specifically, 730
genes (represented by 776 probesets with known gene-level annotations) and 631 miRNAs were
identified with expression levels in the placenta associated with preeclampsia within this cohort.
Similarly, 617 genes (represented by 695 probesets with known gene-level annotations) were
identified to contain CpG sites with differential methylation in the placenta associated with
Preeclampsia-relevant genes, miRNAs, and CpG sites were then evaluated in relation to APAP
concentrations across the placenta samples to identify potential associated genomic/epigenomic
alterations. Statistical approaches paralleled those that were previously implemented in the same
cohort [18, 19], wherein multivariable adjusted regression models were carried out. Potential
confounders (e.g., maternal age, gestational age, newborn sex, parity, and race) were examined
for potential association with both the independent and dependent variables. Each model
controlled for gestational age, as this was the only covariate significantly associated with
preeclampsia case status in this cohort (Supplemental Materials, Table S1), and it has published relationships with environmental exposures [25-28] and genomic/epigenomic
signatures in placental tissues [29-31]. Furthermore, this covariate was used in our previously
published analyses [18, 19].
Regression modeling was carried out in R (v3.6.0) using the lm function (stats v3.6.2) [32], with
APAP concentration as the independent variable and the genomic/epigenomic endpoints as
dependent variables. Resulting p-values were corrected for multiple test comparisons using the
q-value statistic through the qvalue function (v2.18.0) in R [33]. Significant differential
expression or methylation was defined using a false discovery rate (FDR) corrected q-value <0.2
(p-value <0.05) for associations with APAP concentration. Additional filters were applied to
consider the magnitude of change in expression or methylation. For these filters, the “highest
exposed quartiles” (HEQ) and “lowest exposed quartiles” (LEQ) were identified for APAP
exposure and used to calculate fold changes (FC) or beta differences, for expression and
methylation analyses, respectively. For the gene and miRNA expression analyses, a filter
levels across the HEQ over the average expression levels across the LEQ. For the CpG
methylation analyses, a filter requiring a beta difference ³ ± 0.10 was applied, where beta
difference was defined as the average beta values across the HEQ subtracted by the average beta
values across the LEQ. These calculations and statistical approaches are established and have
been implemented by our research team in previous investigations using human
genomic/epigenomic data [21, 34, 35]. Probesets (and their representative genes/miRNAs) that
met these statistical criteria were identified as significantly associated with APAP. Significant
genes/miRNAs were thus referred to as: differentially expressed genes (DEGs), differentially
expressed miRNAs (DEMs), and differentially methylated genes (DMGs).
Pathway and network enrichment analysis of genomic and epigenomic profiles associated with APAP from placenta tissues
Biological pathway and network enrichment analyses were carried out to further investigate the
biological implications of the genomic and epigenomic alterations associated with APAP. The
lists of DEGs, DEMs, and DMGs were evaluated separately for enrichment of canonical
pathways, as enabled through the Ingenuity Knowledge Database [36]. Over-represented
pathways were defined as those that contained more APAP-associated molecules than expected
by random chance, calculated from a right-tailed Fisher’s Exact Text [36]. Pathways with
enrichment p-values<0.05 were considered significant, and top-ranking pathways were identified
as those that were enriched within at least two of the three gene lists evaluated (i.e. two of the
three lists of DEGs, DEMs, or DMGs). Networks were also constructed based on known
protein-protein and other molecular interactions to further elucidate biological signaling that may be
DEGs, DEMs, and DMGs was used. Networks were ranked based on right-tailed Fisher’s Exact
test p-values, indicating the likelihood of observing a network containing at least the same
number of proteins encoded by APAP-associated genes by chance in comparison to random
selections of genes [36]. The methods used in this analysis parallel those from our previous
publications [21, 34, 37].
Chemical confirmation
To confirm the presence of APAP identified at increased concentrations in preeclamptic tissues,
a targeted analysis was carried out using an additional set of samples, labeled standards, and an
alternative MS platform. Specifically, an additional set of samples were excised from the same
placental tissues using the same extraction methods as previously described. Here, 25 μg/mL
(ppm) labeled APAP (acetaminophen-D4 solution, Millipore Sigma, Darmstadt, Germany) was
added at a volume of 20μL to each 0.5 grams of sample prior to extraction. Samples were rested
on ice for 30 minutes and then extracted. A method blank containing only labeled APAP, and a
solvent blank were included.
The homogenized samples containing d4-APAP were analyzed using a high-resolution
LC-MS/MS assay. Upon analysis, all sample extracts were dried in a CentriVap vacuum
concentrator (Labconco, MO, USA) and reconstituted in an equivalent volume of
acetonitrile:water (2:98, v/v). A Vanquish UHPLC system coupling to high-resolution Q
Exactive mass spectrometer was used (Thermo Fisher Scientific, MA, USA), featuring a 15-min
chromatographic separation on an Acquity HSS T3 column (Waters, Milford, MA, USA),
(m/z 152.0706à110.0600) and labeled d4-APAP (m/z 156.0957à114.0851) under an HCD NCE of 60. Internal standard quantitation was used to determine placental APAP concentration
levels, using two calibration curves that were respectively plotted for high APAP samples with
ASD/ISD ratio>0.2 (12 points, 0.5 pg-2 ng on column, R2=0.9998) and for low APAP samples
with ASD/ISD ratio<0.2 (5 points, 0.5-10 pg on column, R2=0.9979). The assay was sensitive
and robust during the analysis, with RSD<5% monitored for both d4-APAP and APAP/d4-APAP
ratios (n=5). As indicated by d4-APAP, sample recovery rates ranged from 87.8% to 130.6%
with a mean of 108.3%, and no observable matrix effects were seen throughout the LC-MS/MS
assay.
The LOD for this analysis was 0.5 µg APAP/kg tissue. When tissues showed APAP
concentrations below this LOD, values were imputed using the same approach as used in the
non-targeted analysis, resulting in values of 0.3535 µg APAP/kg tissue as measures of
concentration that were below the detection limit.
In vitro tests to further characterize molecular changes associated with APAP exposure Effects of APAP were further evaluated through the use of in vitro testing using the human
placental SVneo cell line, to specifically evaluate potential effects on cell death related
processes. Pure APAP and stock solutions were created by dissolving in Dimethyl sulfoxide
(DMSO). Cell culture media containing APAP treatments were prepared immediately before
application to cells. Pure etoposide and stock solutions were created by dissolving in Dimethyl
SVneo cell line, a well-established trophoblast lineage, was selected because they provide a
reliable model for placental function [41]. Trophoblasts lineages such as SVneos represent the
primary placental cell type and have been used extensively in research investigating cell
proliferation, migration, and invasion. SVneos are thus useful cells for investigation of abnormal
placentation and vascularization related to preeclampsia [42-44]. SVneo cells (ATCC) were
cultured in serum media (RPMI 1640, Gibco, Grand Island, NY) containing 10% fetal bovine
serum, 1% Sodium Pyruvate and 1% Pen/Strep.
Western blotting for in vitro testing
Western blot screening was performed with APAP-treated SVneo cells in order to evaluate
potential changes in protein expression involved in cell death signaling. Cells were harvested
following a 24 h treatment with 1M APAP, or 1 µM and 10µM etoposide. Whole cell lysates
were harvested in 150 µL of RIPA buffer (Fisher Scientific) and protein quantity was determined
using the Pierce Bicinchoninic Acid Method assay kit according to the manufacturer’s protocol
(Thermo Scientific). All western blot materials were from Bio-Rad Laboratories (Hercules, CA)
unless otherwise stated. Samples containing 25 µg of protein were combined with 2x Laemmli
sample buffer containing 5% b-mercaptoethanol and loaded onto Tris-HCl gels,
electrophoretically separated, and transferred to nitrocellulose membranes. After membranes
were blocked with 5% nonfat milk dissolved for 30 minutes at 37°C degrees, membranes were
incubated overnight at 4°C with primary antibodies to detect poly (ADP-ribose) polymerase
(PARP) antibody (9542), an apoptotic protein, from Cell Signaling Technologies at a 1:500
dilution. Following overnight incubation at 4°C, the membrane was washed and incubated in
1:500 dilution for 1 hour at room temperature. Antibody-protein complexes were then visualized
using Supersignal West Femto Maximal Sensitivity Reagent (Thermo Scientific) and an Imager
(C-Digit) with Image Studio Digits software.
Annexin V-FITC/Propidium Iodine Apoptosis Assay for in vitro testing
The Annexin V-FITC/Propodium Iodine Apoptosis Assay was used to evaluate potential effects
of APAP treatment on apoptosis signaling in SVneo cells. Cells were treated with serum media +
APAP at three doses (100 µg/mL, 200 µg/mL, and 1000 µg/mL) or serum media + Etoposide at
two doses (1 µg/mL and 10 µg/mL) in quadruplicates for each individual treatment
condition/dose. After 48 hours, cells were trypsonized and collected, spun down, and
resuspended in PBS to attain a concentration of ~2x10⁶ cells/mL. Cells were stained with
Annexin V-FITC and Propidium Iodine according to manufacter’s protocol (Nexcelom).
Annexin V binds to phosphatidylserine which is normally only found on the inner plasma
membrane in healthy cells, but during early apoptosis, is found externally. Propidium Iodide
solution permeates cells with compromised cell membranes and binds to DNA which allows for
differentiation between apoptotic, necrotic, and healthy cells. Cells were analyzed for
fluorescence of these dyes using the Cellometer Spectrum Image Cytometry System (Nexcelom).
Gene expression for in vitro testing
Gene expression profiles relevant to placental cell health and death-relevant mechanisms were
evaluated in APAP-treated cells. At 48 hours post-seeding, cells were treated with serum media
+ APAP at 3 doses (100 µg/mL, 200 µg/mL, and 1000 µg/mL) or serum media + Etoposide at 2
After 24 and 48 hour time intervals, cells were collected for RNA in buffer RLT plus and
extracted using the Qiagen AllPrep DNA/RNA/miRNA Universal Kit and concentrated using a
Zymo Research clean and concentrator kit. Gene expression was measured using qPCR
performed with the Fluidigm Biomark HD platform though the UNC Chapel Hill School of
Medicine Advanced Analytics (AA) Core Facility, which simultaneously measured 48 genes and
48 TaqMan mRNA probes provided in Supplemental Materials Table S4. This list included genes that are demonstrated markers of apoptosis, cell cycle, proliferation, migration, and
literature-supported APAP induced changes in order to investigate possible mechanisms of
APAP-induced changes in cell death and cell signaling. Altered genes shown to be associated
with APAP and preeclampsia within the human placenta samples were also used to evaluate
potential similarities within in vitro-derived screening.
RESULTS
Chemicals identified in the placenta in preeclamptic pregnancies
This study implemented a non-targeted approach to identify molecular features within a set of
human placenta tissues from a cohort of preeclamptic (N=18) and normotensive (N=17)
pregnancies. Features were identified with high confidence as based on matching MS/MS
fragmentation data within the Agilent PCDL database. A total of 83 molecular features were
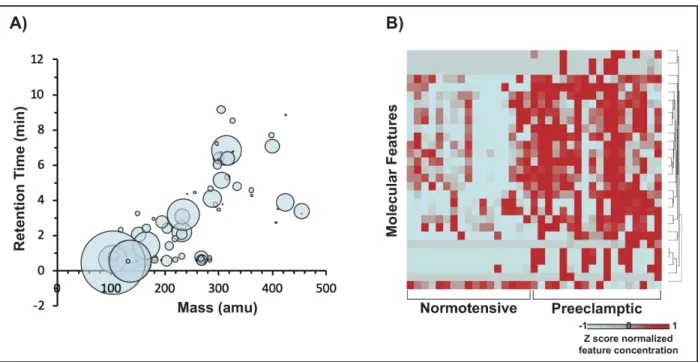
identified in at least one sample, representing 68 unique chemicals (Figure 1A). The distributions of feature abundances were evaluated for significant differential distributions
between preeclamptic vs. normotensive pregnancies. As a result, 29 features representing 27
unique chemicals were identified as showing significant differences in abundance levels between
Figure 1. Molecular features that mapped to chemicals within the PCDL database.
Table 1. 27 chemicals, represented by 29 molecular features, identified with abundance levels
associated with preeclamptic (PE) vs. normotensive (CT) pregnancies. Features are sorted by
lowest to highest p-value. Abbreviations: DSSTox, Distributed Structure-Searchable Toxicity; DTXSID, DSSTox Substance Identifier; FC, fold change; PCDL, Personal Compound and Database Libraries. Chemical Name from PCDL Database Chemi cal CASR N from PCDL Datab ase Chemical Name
from DSSTox DTXSID
Chemical Category / Descriptio n Formula Detection Frequency
log2FC
in Abunda
nce (Averag
e PE / Average CT) p-valu e (PE vs. CT) CT PE Tot
al
Palmityl-L-carnitine
2364-67-2 Palmitoyl-L-carnitine
DTXSID1010 19091 Ester Derivative involved in metabolism of fatty acids
C23H45NO4 17 18 35 1.99 2.60 E-04
Acetylcarnitine
3040-38-8 Acetyl-L-carnitine
DTXSID1040 956 Acylated ester of amino acid derivative
C9H17NO4 17 18 35 1.37 4.59 E-04
Adenosine
58-61-7 Adenosine
DTXSID1022
558 Nucleoside
C16H12FN2
O 17 18 35 2.38 5.04 E-04
Betaine
107-43-7 Betaine
DTXSID8022 666 Modified amino acid, used in food and pharmaceut icals
C5H11NO2 13 17 30 0.83 8.02 E-04
Acetaminophen (APAP)
103-90-2 Acetaminophen
DTXSID2020 006
Pharmaceut
ical C8H9NO2 3 15 18 1.32 1.23 E-03
Cefazolin
25953-19-9 Cefazolin
DTXSID2022 753
Pharmaceut ical
C14H14N8O
4S3 0 9 9 9.97 1.33 E-03
Cefazolin
25953-19-9 Cefazolin
DTXSID2022 753
Pharmaceut ical
C14H14N8O
4S3 0 10 10 9.97 2.50 E-03
Creatine
57-00-1 Creatine
DTXSID1040 451
Organic Compound, Supplement
C4H9N3O2 17 18 35 0.80 4.02 E-03
Inosine
58-63-9 Inosine
DTXSID2045
993 Nucleoside
C10H12N4O
5 17 18 35 0.83 4.02 E-03
L-Carnitine 461-06-3 Carnitine DTXSID3022744 Amino Acid Derivative
C7H15NO3 16 16 32 0.85 5.65E-03
Succinic acid
110-15-6 Butanedioic acid
DTXSID6023 602 Intermediat e Metabolite, Organic acid in foods and pharmaceut
Betaine
107-43-7 Betaine
DTXSID8022 666 Modified amino acid, used in food and pharmaceut icals
C5H11NO2 13 17 30 0.83 7.84 E-03 Benzododecinium (Ajatin) 10328-35-5 N-Benzyl-N,N- dimethyldodecan-1-aminium DTXSID6087
2947 Antiseptic C21H37N 17 18 35 1.22 7.92 E-03
Isobutyryl carnitine 25518-49-4 3-[(2-Methylpropanoyl)oxy ]-4-(trimethylazaniumyl)b utanoate DTXSID7094 8420 Mitochondr ial enzyme involved in fatty acid metabolism
C11H21NO4 17 18 35 0.95 9.34E-03
L-a-Hydroxyisovaleric acid 17407-55-5 2-Hydroxy-3-methylbutanoate DTXSID9093 8464 Metabolite, Organic Acid
C5H10O3 17 18 35 0.72 1.10 E-02
Methamphetamine
537-46-2 Methamphetamine
DTXSID8037 128
Pharmaceut
ical C10H15N 0 6 6 9.97 1.59 E-02
Clindamycin 18323-44-9 Clindamycin DTXSID2022836 Pharmaceutical C18H33ClN2O5S 0 6 6 9.97 1.59E-02
Inosine 58-63-9 Inosine DTXSID2045993 Nucleoside C10H12N4O5 17 18 35 0.65 1.64E-02
L-Tryptophan
73-22-3 L-Tryptophan
DTXSID5021 419
Amino Acid
C11H12N2O
2 16 18 34 0.64 2.24 E-02
Ondansetrone
99614-02-5 Ondansetron
DTXSID8023 393
Pharmaceut
ical C18H19N3O 2 8 10 2.43 2.54 E-02 Desmethyldiphenhy dramine 53499-40-4 2-(Diphenylmethoxy)- N-methylethan-1-amine--hydrogen chloride (1/1) DTXSID8096 8230 Pharmaceut ical derivative
C16H19NO 0 5 5 9.97 2.92 E-02
Diphenhydramine
58-73-1 Diphenhydramine
DTXSID4022 949
Pharmaceut
ical C17H21NO 0 5 5 9.97 2.92 E-02
Val Leu NA VAL-LEU DTXSID0087
4268 Metabolite
C11H22N2O
3 14 17 31 2.94 3.13 E-02
L-Glutamate
56-86-0 L-Glutamic acid
DTXSID5020
659 Amino acid C5H9NO4 17 17 34 0.60 3.51 E-02
Cortisone
53-06-5 Cortisone
DTXSID5022 857
Pregnane steroid hormone
C21H28O5 17 18 35 -0.85 4.68 E-02
3-Hydroxybutyric acid
300-85-6
Butanoic acid, 3-hydroxy- DTXSID6085 9511 Organic compound, preferred energy source during the early postnatal period
C4H8O3 17 18 35 0.85 5.03 E-02
Sphingosine 123-78-4
2-Aminooctadec-4-ene-1,3-diol
DTXSID9086
1763 Metabolite C18H37NO2 0 4 4 9.97 5.34 E-02
Sphingosine 123-78-4
2-Aminooctadec-4-ene-1,3-diol
DTXSID9086
1763 Metabolite C18H37NO2 17 18 35 0.73 6.19 E-02
Hypoxanthine 68-94-0 Hypoxanthine DTXSID8045983
Organic compound, protects against oxidant-induced cell injury
Of high pertinence to the current analysis, Palmityl-L-carnitine, Acetylcarnitine, Adenosine,
Betaine, and APAP were identified at abundance levels most significantly increased in
association with preeclampsia. Here we selected APAP as a chemical to prioritize for further
analyze using additional technologies and approaches due to the following lines of evidence: (1)
APAP showed significantly increased abundance levels in placentas from preeclamptic vs.
normotensive pregnancies (Figure 2A), and (2) APAP represents a pharmaceutical that is commonly taken during pregnancy [45, 46].
Given the confirmed presence of APAP in several placenta samples, observed molecular features
were also screened for the presence of N-acetyl-p-benzoquinone imine (NAPBQI), a known
toxic metabolite of APAP. A feature matching the monoisotopic mass and molecular formula of
NAPBQI was observed in the prefiltered ESI+ data files, but not in the WebApp processed data
files. This feature that matched NAPBQI’s monoisotopic mass and molecular formula appeared
in nearly every sample in both patient groups at very stable intensity levels, and thus did not
track with APAP levels. This feature was also present in the method blank samples at intensity
levels indistinguishable from those observed in study samples. As such, the feature in question
was determined to be a background feature and not related to APAP. Based on these results, the
data from the non-targeted analysis do not support the presence of NAPBQI in the placenta
APAP confirmation in placentas from preeclamptic pregnancies
The concentrations of APAP in placentas from this cohort were confirmed using targeted
approaches with an additional set of excised samples and an alternative MS platform, namely, a
high-resolution orbitrap LC-MS. This additional analysis integrated labeled standards to allow
for concentration derivations from these tissues. With this approach, APAP was measured at
concentrations ranging from below detection (0.5 µg APAP/kg tissue) to 3668 µg APAP/kg
tissue (average=442, standard deviation=997.5 µg APAP/kg tissue) (Figure 2B). These
concentrations notably correlated with the abundance measures derived from the non-targeted
analysis (Figure 2C).
Figure 2. APAP was measured at significantly increased levels in tissues from preeclamptic vs. normotensive pregnancies through two analytical approaches.
(A) Abundance levels were obtained using non-targeted approaches with high-resolution LC-qTOF and (B) confirmed using targeted approaches with high-resolution orbitrap LC-MS. (C) APAP concentrations were significantly correlated between these two approaches. (*) indicates a significant difference (p<0.01).
APAP-associated genomic and epigenomic disruptions in placenta
To identify potential genomic/epigenomic alterations associated with APAP, concentrations of
APAP were statistically related to gene, miRNA, and CpG methylation signatures within the
alterations associated with APAP. APAP concentrations were identified as associated with the
differential expression of 27 genes, differential expression of 57 miRNAs, and differential
methylation of 18 genes of relevance to preeclampsia (Supplemental Material Table S2).
To further investigate the functional implications of placental -omic alterations, biological
function enrichment analyses were carried out on the preeclampsia-relevant genes, miRNAs, and
CpG methylation sites with differential expression or methylation associated with APAP. Several
canonical pathways were identified as significantly associated with the APAP-associated -omic
alterations (Table 2), with organismal injury and abnormalities showing the most significant enrichment (ave p-value across all gene lists = 4.08 x 10⁻⁵). Other highly enriched functions
included cell death and survival (ave p-value = 1.81x10⁻⁴), cell compromise (ave p-value =
4.91x10⁻⁴), and cell cycle (ave p-value = 6.45x10⁻⁴). Protein-protein interaction networks were
also constructed based on known and predicted molecular interactions between the
APAP-associated gene lists and related biological signaling. The two most significant networks
constructed based on the multi-omic responses contained signaling relevant to cell compromise,
cell death and survival, and cell cycle (Figure 3A and 3B). Relevant proteins of interest within these networks included those encoded by genes with differential expression (e.g., thioredoxin
Table 2. Biological functions and diseases that are highly enriched amongst preeclampsia-relevant differentially expressed genes (DEGs), differentially expressed microRNAs (DEMs), and differentially methylated genes (DMGs) associated with acetaminophen levels in placenta tissues. The 20 top-ranking disease/function categories are listed, with the most significantly associated categories (on average) listed at the top.
Biological Function or Disease Category
Average p-value across DEGs, DEMs, and DMGs
DEGs p-value DEMs p-value DMGs p-value
Organismal Injury and Abnormalities
4.08E-05 1.54E-05 1.04E-12 1.07E-04
Cancer 4.14E-05 1.54E-05 1.76E-06 1.07E-04
Cell Death and Survival 1.81E-04 1.23E-04 NS 2.38E-04
Cellular Compromise 4.91E-04 2.14E-04 NS 7.67E-04
Reproductive System Development and Function
5.24E-04 2.80E-04 NS 7.67E-04
Hereditary Disorder 5.81E-04 2.83E-04 6.93E-04 7.67E-04 Inflammatory Disease 6.02E-04 1.04E-03 1.04E-12 7.67E-04 Inflammatory Response 6.02E-04 1.04E-03 1.04E-12 7.67E-04 Immunological Disease 6.07E-04 1.04E-03 1.42E-05 7.67E-04 Neurological Disease 6.07E-04 1.04E-03 1.42E-05 7.67E-04
Cell Cycle 6.45E-04 1.04E-03 4.92E-04 4.04E-04
Cellular Movement 7.66E-04 1.04E-03 4.92E-04 7.67E-04 Hair and Skin Development
and Function
8.25E-04 8.83E-04 NS 7.67E-04
Developmental Disorder 8.33E-04 1.04E-03 6.93E-04 7.67E-04 Cellular Assembly and
Organization
9.04E-04 1.04E-03 NS 7.67E-04
Cardiovascular Disease 9.07E-04 2.83E-04 NS 1.53E-03
Tissue Morphology 1.16E-03 7.85E-04 NS 1.53E-03
Ophthalmic Disease 1.29E-03 1.04E-03 NS 1.53E-03
Small Molecule Biochemistry 1.29E-03 1.04E-03 NS 1.53E-03
Figure 3. Integrated -omic networks showing APAP-associated changes relevant to cell compromise and cell death. The two most significant networks are displayed (A and B) showing likely interactions between genes, miRNAs, and CpG sites that were identified with differential expression or methylation associated with APAP.
Molecular testing of APAP-induced mechanistic changes in placenta cells
The ability of APAP to induce changes in cell death was evaluated through several approaches
using SVneo cells treated with APAP at concentrations ranging from 0 to 1000 uM. These
concentrations included those that were than measured in human tissues, as well as
concentrations higher than the measured concentrations. Specifically, when using a density of
1.05 g/cm3 estimated for the human placenta [47], the measured concentrations ranged from 0 to
25.5 uM. Kinase Peptidase microRNA Transcription Regulator Transmembrane Receptor Other Complex/Group
*
Cellular Death and Survival*
*
Cell Cycle Cell Compromise Increased Gene ExpressionDecreased miRNA Expression Increased miRNA Expression
Related Proteins Increased Gene Methylation
Decreased Gene Methylation
p < 10-42 p < 10-24
Apoptosis was first assessed in SVneo cells treated with APAP and Etoposide by assessing
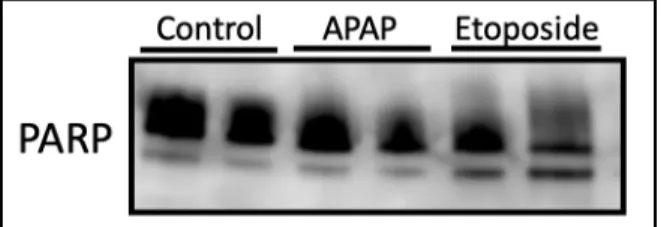
expression of PARP protein via western blot. The analysis of SVneo cells demonstrated that only
positive controls treated with the high-dose etoposide expressed PARP cleavage, with no
detectable cleavage among APAP-treated cells (Figure 4).
Figure 4. Characterization of PARP expression in APAP Etoposide treated SVneo cells. PARP antibody detected endogenous levels of full length PARP1 as well as the large fragment of PARP1 resulting from caspase cleavage indicating apoptosis in only the etoposide treatment group.
To further elucidate the relationship between APAP exposure and mechanisms of cell death of
SVneo cells using a more global approach, cells were analyzed using the Annexin
V-FITC/Propidium Iodine Apoptosis Assay. Pilot results of this assay showed no significant
changes in apoptosis among cells treated with APAP in comparison to the negative or positive
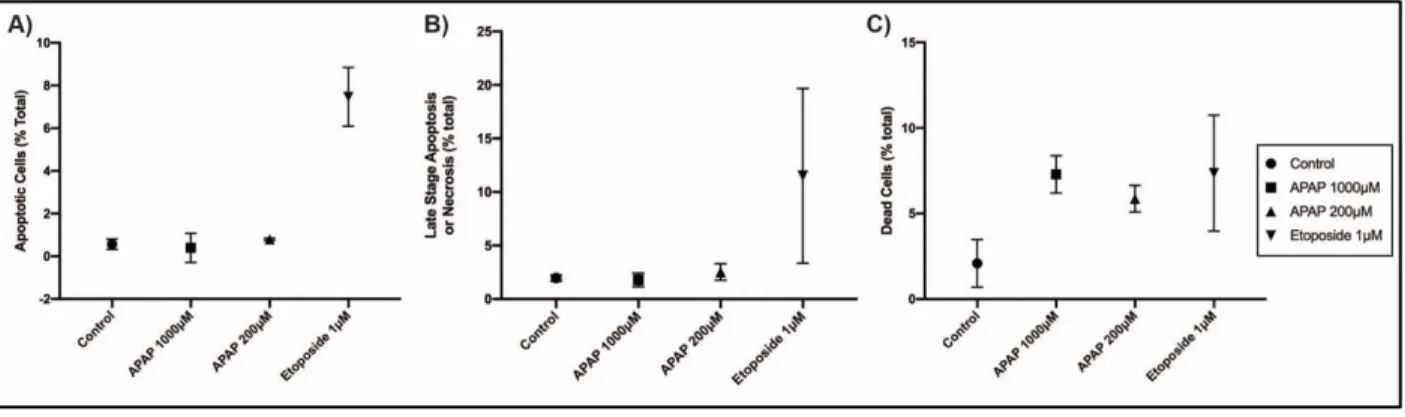
control in the 48 hours treatment (Figure 5A and 5B). However, the total percent of necrotic/dead cells among the APAP 1000μM and 200μM was significantly increased in
Figure 5. Analysis of apoptotic, late-stage apoptotic/necrotic, and dead SVneo cells A) Percent of apoptotic cells as characterized by being FITC Annexin-V positive and PI negative, B) ) Percent of late stage-apoptotic or necrotic as characterized by being both FITC Annexin-V positive and PI positive, and C) Percent of dead or necrotic cells as characterized by being FITC Annexin-V negative and PI positive
To further establish the relationship been APAP and biological processes such as cell cycle,
apoptosis, proliferation, migration, and cell death in-vitro, 48 genes were selected for expression analysis, 10 of which overlapped with those significantly associated with APAP among human
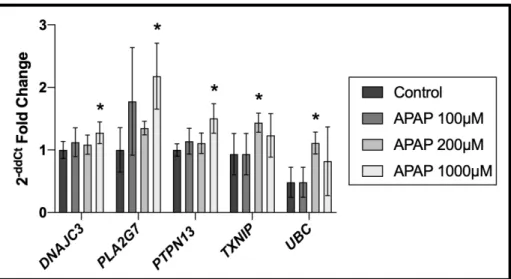
placental samples (Supplemental Material Table S3). Treatment of SVneo cells with 100 μM, 200 μM, and 1000 μM of APAP resulted in 13 genes found to be significantly differentially
expressed in APAP treated cells in comparison to the control group. Of high interest, the genes
DnaJ Heat Shock Protein Family Member C3 (DNAJC3), Phospholipase A2 Group VII (PLA2G7), Protein Tyrosine Phosphatase Non-Receptor Type 13 (PTPN13), Thioredoxin
Figure 6. Gene expression analysis of APAP treated placental cells shows 5 significant genes
differentially expressed when compared to control group(* indicates significance)
These findings have important implications for the role of APAP in cell death, cell cycle,
migration, and preeclampsia.
DISCUSSION
In the present study, we implement a non-targeted analysis of placentas from normotensive and
preeclamptic pregnancies to identify potentially understudied chemicals associated with this
serious pregnancy outcome. The evaluation of xenobiotic chemicals as part of the prenatal
exposome is of high interest, as exposure to xenobiotics during pregnancy is becoming
increasingly recognized as an important risk factor for pregnancy-relevant health outcomes such
as preeclampsia [1]. Our analysis identified 68 unique chemicals with high confidence among the
placenta samples, 27 of which were associated with preeclampsia. Among the chemicals
associated with preeclampsia, APAP was identified as a chemical of high interest due to its
significant increase in concentrations measured in samples from preeclamptic vs. normotensive
This serves as an important proof of concept and led to subsequent molecular testing of APAP in
placental cells evaluating potential mechanisms related to the onset or maintenance of
preeclampsia.
This study utilized placental tissue from normotensive and preeclamptic pregnancies to evaluate
potential relationships between chemical exposures and preeclampsia case status. Previous
studies have evaluated chemicals such as perfluoroalkyl and polyfluoroalkyl substances, lead,
and cadmium in maternal serum and/or fetal cord blood & related them to preeclampsia [48-50].
Few studies, however, have investigated chemical concentration in the placenta, representing an
important target tissue involved in preeclampsia etiology; and these studies have implemented
targeted approaches to evaluate select chemicals. For example, Laine et al. investigated a cohort
of 172 placental samples, 86 of which were from preeclamptic pregnancies, and found that
concentrations of cadmium in placental tissue were significantly associated with preeclampsia
case status [5]. Here, we implement a novel non-targeted method to expand the current
understanding of relationships between chemicals reaching the placenta and preeclampsia. This
method resulted in the detection and identification of 68 unique chemicals that contribute to the
growing knowledge of the placental exposome. Among these chemicals, 27 had concentrations
significantly associated with preeclamptic pregnancies. One of the chemicals identified with the
most significantly increased levels associated with preeclampsia was APAP, which was
prioritized for further evaluation.
To evaluate molecular changes associated with APAP, potential genomic and epigenomic
genomic and epigenomic alterations associated with APAP showed enrichment for important
cellular processes such as cell death and survival, cellular compromise, reproductive system
development and function, and cell cycle among others. Of pertinence to these signaling
changes, we identified increased expression of genes such as TXNIP and PTPN13, differential methylation of genes such as BAK1, and differential expression of miRNAs such as miR-132-3p and miR-193a-3p. Overexpression of TXNIP has been shown to reduce proliferation and induce apoptosis in beta-cells [51, 52]. Similarly, the protein encoded by BAK1 has been shown to be pro-apoptotic [53-55]. PTPN13 is also linked to the induction of apoptosis, as well as cell
proliferation and migration [56-58] An example miRNA, miR-193a-3p, had increased expression
significant with APAP and is of interest due to its potential ability to inhibit proliferation,
migration, and invasion of cells [59]. These example genetic and epigenetic-level changes
highlight potential mechanistic targets that may serve as a link between APAP and preeclampsia
disease etiology.
Previous studies also support an association between APAP and altered pregnancy-related health
outcomes such as preeclampsia. A large study consisting of 63,833 participants identified an
association between APAP use during third trimester and increased risk of preeclampsia [60].
Another study consistent with our findings reported that prenatal APAP exposure induced
placental damage in mice following injection with a dose 250 mg/kg APAP, comparable to a
dose slightly higher than the recommended single dose for humans [61]. These findings
warranted further mechanistic evaluation of APAP using more controlled study designs, as
Given cell death and survival was shown to be one of the most significantly enriched pathways
among our tissue samples, placental cells were treated in vitro and evaluated for several potential changes in cell death-relevant signals in order to further evaluate cell death resulting from
exposure to APAP in the placenta. For example, the expression of PARP protein was assessed. In
general, the PARP protein assists the maintenance of cell viability while cleavage of PARP
serves as a marker of cells undergoing apoptosis [62]. Though we found no evidence of PARP
cleavage among APAP treated cells, a non-specific approach utilizing FITC Annexin-V and PI
staining for investigating apoptotic versus necrotic death was also implemented to account for
other mechanisms of cell death that may be occurring. The results of this pilot experiment further
supported that apoptosis may not be occurring as result of APAP exposure, alone, in the SVneo
cell line. This finding is novel in that, to our knowledge, apoptosis resulting from APAP
exposure has not yet been testing within the SVneo cell line. Further testing utilizing larger
sample sizes and a more comprehensive range of dosing is required to draw definitive
conclusions. What remains to be tested is whether APAP was converted into its more toxic
metabolite, NAPBQI, within these cells under these conditions, and whether NAPBQI can
influence PARP expression and other apoptotic mechanisms directly in placental cells in vitro.
While the role of apoptosis in hepatocyte cytotoxicity resulting from APAP exposure is highly
debated, our findings are supported by previous studies that have found necrosis to be the
primary pathway of hepatotoxicity resulting from APAP overdose [63, 64]. For example, a
previous study in vivo evaluated hepatocyte injury after APAP treatment of 300 mg/kg in mice. Apoptotic and necrotic hepatocytes were quantified and the percent apoptotic cells remained
[65]. Our global analysis of apoptotic, late-stage apoptotic, and necrotic cells, supported a
general increase in necrotic cell deaths among placenta cells treated with APAP in comparison to
control groups. These results warranted further investigation into alternative pathways of
placenta cell death from APAP exposure through the utilization of gene expression analysis.
Our in-vitro gene expression analysis evaluated a panel of genes that play various roles in cell cycle, cell death, proliferation and other preeclampsia-relevant functions. The treatment and
analysis of placental cells provided further evidence that APAP is related to the differential
expression of several genes, 5 of which overlapped with those found to be differentially
expressed in placental tissue samples. The five genes, DNAJC3, PLA2G7, PTPN13, TXNIP, and UBChad increased expression among both placental tissue samples and in APAP treated SVneo
placental cells, demonstrating similar APAP-associated changes in vitro and in human placental cells. These genes play important roles in apoptosis, proliferation, and cell cycle [51, 52, 56-58,
66-72] and thus the altered expression of these genes have potential implications for the
relationship between APAP exposure and preeclampsia disease etiology.
As aforementioned, the metabolism of APAP into its toxic biproduct NAPBQI within the SVneo
cell-line remains to be tested. It is well established that APAP cytotoxicity in hepatocytes results
in part from the overabundance of highly reactive metabolite NAPBQI [64]. At non-toxic doses
glucuronide and sulfate conjugation enzymes effectively metabolize this compound but higher
doses, NAPBQI’s metabolic pathways become over-saturated and NAPQI is left to react with
NAPQI interacts with hepatocytes is by the irreversible formation of protein adducts leading to
oxidative injury and cell death by necrosis [74]. While we were unable to detect this highly
reactive metabolite among our placenta samples through analytical techniques, future studies
may evaluate acetaminophen–induced placental toxicity by measuring more stable metabolic
products of acetaminophen such as NAPQI-protein adducts to further characterize how
acetaminophen may influence placental cell health and survival.
Pregnant women are often advised to avoid nonsteroidal anti-inflammatory drugs and opioids
during pregnancy, thus APAP is left as one of the few pain killers approved for use during
pregnancy [75]. This cohort was a high-risk pregnancy cohort and thus it is possible patients
were experiencing more pain, leading to increased intake of APAP. Because severe headaches
are one of the most common symptoms of preeclampsia, reverse-causation remains a plausible
explanation for the significant difference in concentrations between preeclamptic vs.
normotensive patients [76]. This serves as an important proof of concept for our analytical
testing methods and establishes a protocol for future testing of other chemicals. With additional
toxicokinetic data supporting the ability of APAP to reach placental tissues, we have further
evidence supporting our finding that APAP is the chemical corresponding to the detected
molecular feature among placental samples [77, 78]. We also recognize this study is a pilot study
based on 36 subjects, however our findings remain robust as we analyzed each placenta sample
extensively, in high dimensionality using global approaches through chemical speciation,
genomic profiling, and epigenomic profiling within the same samples. The application of
stringent statistics to the relationships observed gives us high confidence in the data presented.
In conclusion, this research provides novel evidence towards characterizing chemicals in the
placental and identified APAP as one of the most significantly associated compounds related to
preeclampsia. Mechanistic findings showed changes in gene expression relevant to placental cell
damage and cell death that may be relevant to preeclampsia etiology and support the need for
further investigation. This study serves as an important foundation to further elucidate
REFERENCES
1. Rager, J.E., et al., Review of the environmental prenatal exposome and its relationship to maternal and fetal health. Reprod Toxicol, 2020.
2. Duley, L., The global impact of pre-eclampsia and eclampsia. Semin Perinatol, 2009. 33(3): p. 130-7.
3. English, F.A., L.C. Kenny, and F.P. McCarthy, Risk factors and effective management of preeclampsia. Integr Blood Press Control, 2015. 8: p. 7-12.
4. Sibai, B.M., Diagnosis and management of gestational hypertension and preeclampsia. Obstet Gynecol, 2003. 102(1): p. 181-92.
5. Laine, J.E., et al., Placental Cadmium Levels Are Associated with Increased Preeclampsia Risk. PLoS One, 2015. 10(9): p. e0139341.
6. Rosen, E.M., et al., Environmental contaminants and preeclampsia: a systematic literature review. J Toxicol Environ Health B Crit Rev, 2018. 21(5): p. 291-319.
7. Wild, C.P., Complementing the genome with an "exposome": the outstanding challenge of environmental exposure measurement in molecular epidemiology. Cancer Epidemiol Biomarkers Prev, 2005. 14(8): p. 1847-50.
8. Al-Saleh, I., et al., Heavy metals (lead, cadmium and mercury) in maternal, cord blood and placenta of healthy women. Int J Hyg Environ Health, 2011. 214(2): p. 79-101.
9. Arbuckle, T.E., et al., Umbilical cord blood levels of perfluoroalkyl acids and polybrominated flame retardants. Int J Hyg Environ Health, 2013. 216(2): p. 184-94.
10. Frederiksen, M., et al., Patterns and concentration levels of polybrominated diphenyl ethers (PBDEs) in placental tissue of women in Denmark. Chemosphere, 2009. 76(11): p. 1464-9. 11. Dewan, P., et al., Organochlorine pesticide residues in maternal blood, cord blood, placenta, and
breastmilk and their relation to birth size. Chemosphere, 2013. 90(5): p. 1704-10.
12. Mitro, S.D., T. Johnson, and A.R. Zota, Cumulative Chemical Exposures During Pregnancy and Early Development. Curr Environ Health Rep, 2015. 2(4): p. 367-78.
13. Pacifici, G.M. and R. Nottoli, Placental transfer of drugs administered to the mother. Clin Pharmacokinet, 1995. 28(3): p. 235-69.
14. Huppertz, B., Placental origins of preeclampsia: challenging the current hypothesis. Hypertension, 2008. 51(4): p. 970-5.
15. Garnica, A.D. and W.Y. Chan, The role of the placenta in fetal nutrition and growth. J Am Coll Nutr, 1996. 15(3): p. 206-22.
16. Maltepe, E. and S.J. Fisher, Placenta: the forgotten organ. Annu Rev Cell Dev Biol, 2015. 31: p. 523-52.
17. Roberts, J.M. and C. Escudero, The placenta in preeclampsia. Pregnancy Hypertens, 2012. 2(2): p. 72-83.
18. Martin, E., et al., Epigenetics and Preeclampsia: Defining Functional Epimutations in the Preeclamptic Placenta Related to the TGF-beta Pathway. PLoS One, 2015. 10(10): p. e0141294. 19. Brooks, S.A., et al., miRNAs as common regulators of the transforming growth factor (TGF)-beta
pathway in the preeclamptic placenta and cadmium-treated trophoblasts: Links between the environment, the epigenome and preeclampsia. Food Chem Toxicol, 2016. 98(Pt A): p. 50-57. 20. Irizarry, R.A., et al., Summaries of Affymetrix GeneChip probe level data. Nucleic Acids Res, 2003.
31(4): p. e15.
21. Rager, J.E., et al., Prenatal arsenic exposure and the epigenome: altered microRNAs associated with innate and adaptive immune signaling in newborn cord blood. Environ Mol Mutagen, 2014.
55(3): p. 196-208.