US PE/VC Benchmark
Commentary
Quarter and Year Ending December 31, 2013
©2014 Cambridge Associates LLC
www.CambridgeAssociates.com
In 2013, US private equity and venture capital turned in their best annual performance since 2006 and 1999, respectively. Strong returns from the large sectors, particularly fi nancial services in the private equity benchmark and information technology (IT) in venture, contrib-uted most to the indexes’ results. In the fi ve years between 2009 and 2013, private equity earned positive returns in all but three quarters and venture capital rose in all but two quarters, as indicated by the Cambridge Associates LLC benchmark indexes of the two alternative asset classes. While both private asset classes had strong absolute results in the fourth quarter of 2013, only venture capital outperformed public equities; for the year, neither private investment benchmark bested public equity returns. During the ten-year period ending in 2013, private equity signifi cantly outperformed venture capital and both private asset classes outpaced the public markets.
The Cambridge Associates indexes are derived from performance data compiled for funds that represent the majority of the institutional capital raised by private equity and venture capital partnerships. The Cambridge Associates LLC US Private Equity Index® includes funds raised between 1986 and 2013 and the Cambridge Associates LLC US Venture Capital Index® represents funds raised between 1981 and 2013.
This commentary reviews the indexes’ performance. Highlights of the fourth quarter and year are:
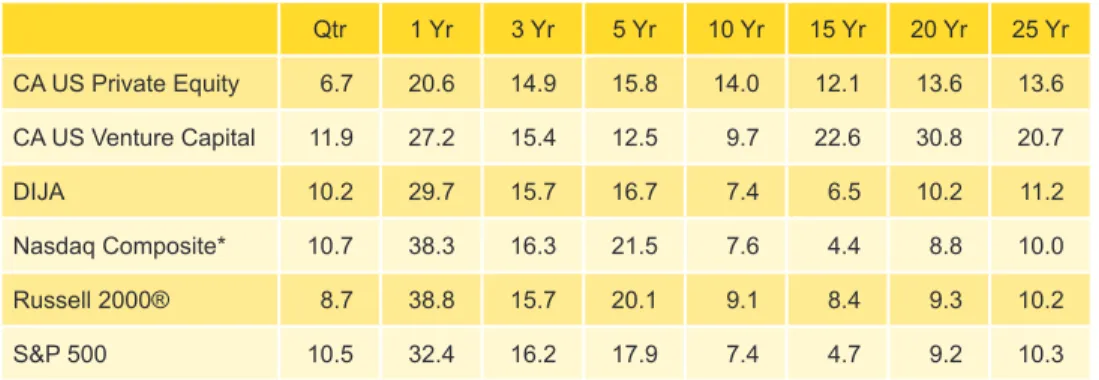
As detailed in Table 1, the private equity benchmark’s performance lagged large and small public companies in all periods over the fi ve years ending December 31, 2013, but it surpassed the public markets over longer time horizons. The venture capital index’s record against the public markets has been mixed over the past ten years, but over the long term, venture has signifi cantly outper-formed public equities.
The spread between the private equity and venture capital ten-year returns has narrowed to 4.3% after hitting a peak of 12.7% at the end of the third quarter 2010.
As of December 31, 2013, public companies accounted for 23.0% of both the private equity and venture capital indexes, representing a slight increase over the third quarter level for venture capital. The meaningful public company exposure in both indexes means that performance of the public markets could have a direct impact on the benchmarks’ return. Non-US company exposures in the indexes held steady during the fourth quarter, at 19.3% and 10.3% for the private equity and venture benchmarks, respectively.
The spread between the private equity and venture capital ten-year returns has narrowed to 4.3% after hitting a peak of 12.7% at the end of the third quarter 2010
Qtr 1 Yr 3 Yr 5 Yr 10 Yr 15 Yr 20 Yr 25 Yr
CA US Private Equity 6.7 20.6 14.9 15.8 14.0 12.1 13.6 13.6
CA US Venture Capital 11.9 27.2 15.4 12.5 9.7 22.6 30.8 20.7
DIJA 10.2 29.7 15.7 16.7 7.4 6.5 10.2 11.2
Nasdaq Composite* 10.7 38.3 16.3 21.5 7.6 4.4 8.8 10.0
Russell 2000® 8.7 38.8 15.7 20.1 9.1 8.4 9.3 10.2
S&P 500 10.5 32.4 16.2 17.9 7.4 4.7 9.2 10.3
Table 1. US Private Equity and Venture Capital Index Returns
Sources: Cambridge Associates LLC, Dow Jones & Company, Inc., Frank Russell Company, Standard & Poor’s, and Thomson Datastream.
Note: Because the US Private Equity and Venture Capital indexes are capital weighted, the largest vintage years mainly drive the indexes’ performance.
Private Equity Performance Insights
US public equity indexes soared in fourth quarter 2013, with many earning double-digit returns amid low interest rates and a slow but steadily growing economy. The Cambridge Associates LLC US Private Equity Index® also ended the year strongly, but it did not match public market counterparts. The index’s fourth quarter return was 6.7%, bringing its return for the year to 20.6%, a signifi cant increase over the prior year. In the fourth quarter, portfolio company valua-tions increased across all vintage years from 1998 through 2013; when combined, the funds from the index’s fi ve largest vintages saw asset values improve by more than $36 billion. In dollar terms, valuations grew most for consumer, energy, fi nancial services, health care, and IT companies; all were among the index’s large sectors.
According to Dealogic, 29 private equity–backed companies went public in the fourth quarter at a value of $14.5 billion, making it the best quarter of the year for private equity–backed initial public offer-ings (IPOs). During 2013, 83 private equity–backed companies went public, fetching $30.4 billion, an increase of 21 companies and almost $18 billion, respectively, from 2012 totals. Notable IPOs took place in a wide range of sectors; two of the three largest (Antero Resources and Plains GP) were oil & gas companies. Other examples include Hilton and SeaWorld.
Both fourth quarter and 2013 were fairly active periods for mergers & acquisitions (M&A) involving private equity–backed companies. Fourth quarter saw 197 M&A transactions, up from 171 in the third. The values of 60 of those deals (30.5%) were disclosed to the public, just about on par with the previous quarter’s 53 (31.0%). Based on publicly available values, the average transaction size fell from $408 million in third quarter to $384 million in fourth quarter. The 718 M&A transac-tions in 2013 were a decrease of 176 from the prior year. The values of 244 deals were disclosed to the public in 2013; the average size was $540 million. The average for the year was skewed higher by the larger-than-average deals consummated in fi rst quarter—excluding fi rst quarter, the average size of deals with disclosed values was $379 million. In 2012, the 330 transactions with publicly disclosed values averaged $315 million each.
Five vintage years, 2004 through 2008, represented nearly 80% of the private equity index’s value at the end of 2013 (Table 2). Returns for these fi ve vintages were higher in the fourth quarter than they were in
Fourth quarter was the best quarter of the year for PE-backed IPOs
Five vintage years, 2004 through 2008, represented nearly 80% of the private equity index’s value at the end of 2013
the third (particularly for the two largest vintage years), ranging from 3.0% for the 2004 funds to 7.6% for the 2007 funds. Throughout 2013, active IPO and M&A environments coupled with ebullient public markets helped drive realizations and boost unrealized valuations. During fourth quarter and for the full year, vintage year 2007 funds benefi ted most from elevated valuations in the energy sector, but write-ups in IT (second largest), consumer, and health care were also substantial. In the second largest vintage year, 2006, retail and fi nan-cial services led all other sectors with respect to valuation increases, representing more than 53% of the write-ups in the fourth quarter and nearly 44% for the year. For the year’s best-performing vintage, 2005, the consumer sector was by far the largest contributor to performance.
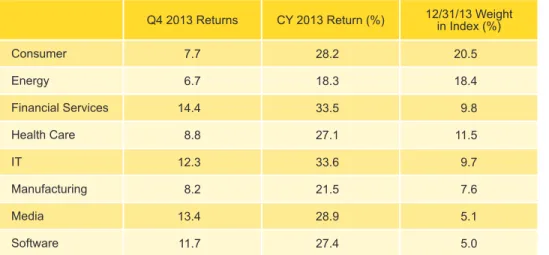
All Eight Key Sectors in the PE Index Earned Strongly Positive Returns for the Quarter; Financial Services Led. All eight sectors that represented at least 5% (“meaningfully sized”) of the index produced positive returns during the fourth quarter of 2013 (Table 3). The three largest sectors—consumer, energy, and health care— composed more than 50% of the index’s total value and returned between 6.7% and 8.8%. On a dollar-weighted basis, the three earned a gross return of 7.6%, underperforming the total benchmark’s gross performance by 1.3%. Among the eight meaningfully sized sectors, fi nancial services posted the highest return for the quarter; the 2006 and 2007 vintage years contributed most to the performance and accounted for more than 56% of the sector’s market value at year-end. Energy produced the fourth quarter’s lowest return, 6.7%, driven mostly by large write-ups in the vintage year 2007 and 2008 funds. During the quarter, nearly 75% of the capital deployed by fund managers was allocated to six sectors (from highest to lowest): energy, consumer, manufacturing, fi nancial services, health care, and IT. This percentage is in line with historical norms.
Among the eight meaningfully sized sectors in the private equity index, fi nancial services posted the highest return for the quarter
For the year, the best- and worst-performing sectors in the private equity index were IT and energy, respectively
Q4 2013 Returns CY 2013 Return (%) 12/31/13 Weight in Index (%)
2004 3.0 19.3 6.2
2005 6.4 23.3 14.6
2006 6.2 18.2 21.2
2007 7.6 23.1 27.6
2008 6.7 18.9 10.1
Table 2. Private Equity Vintage Year Returns: Net Fund-Level Performance
For the year, the best- and worst-performing sectors were IT and energy, respectively. Write-ups for IT companies in vintage years 2005 through 2008 were all greater than $1 billion and were the largest drivers of that sector’s return. Financial services companies, up 33.5% for the year, nearly matched the performance of the IT sector, with write-ups that were also dominated by vintage years 2005 through 2008. The 2007 vintage was by far the largest positive contributor to the annual perfor-mance for energy, the only large sector that did not produce a return greater than 20% for the year. The three largest sectors—consumer, energy, and health care—underperformed the benchmark’s total gross return by 1.5% and underperformed all other industries by 3.1%.
Distributions Hit a Record Level; Capital Contributions Were Lower for the Year. In the fourth quarter, managers in the US private equity index called $16.4 billion from limited partners and returned $41.6 billion, representing a 7.3% increase in contributions and a 31.0% increase in distributions from last quarter. In dollar terms, capital calls increased by $1.1 billion and distributions, which reached the second highest quarterly level seen in the 28 years that Cambridge Associates has tracked the industry, rose by nearly $10.0 billion.
Investors in funds launched in 2007, 2008, 2011, and 2012 contributed $10.7 billion, or 65% of the total capital called during the quarter; all four vintage years called more than $2.0 billion from their LPs. Conversely, each of the vintage years from 2004 through 2008 distrib-uted more than $4 billion in the quarter. Investors in funds launched from 2005 through 2007 received approximately $25.0 billion, or 60%
At $41.6 billion for fourth quarter, distributions from managers in the private equity index reached their second-highest quarterly level since inception
Fourth quarter was the eighth consecutive period where distributions were higher than contributions for managers in the private equity index
Q4 2013 Returns CY 2013 Return (%) 12/31/13 Weight in Index (%)
Consumer 7.7 28.2 20.5
Energy 6.7 18.3 18.4
Financial Services 14.4 33.5 9.8
Health Care 8.8 27.1 11.5
IT 12.3 33.6 9.7
Manufacturing 8.2 21.5 7.6
Media 13.4 28.9 5.1
Software 11.7 27.4 5.0
Table 3. Private Equity Sector Returns: Gross Company-Level Performance
of the capital distributed. Fourth quarter was the eighth consecutive period where distributions were higher than contributions.
During 2013, managers in the US private equity index called $56.3 billion from limited partners, $15.0 billion less than they called in 2012 and more than $20 billion less than they drew down in either 2011 or 2010 (Figure 1). Total distributions in 2013 reached $134.6 billion— the largest annual amount since the index’s inception. Distributions increased by 17% over totals hit in 2012, 43% from 2011, 87% from 2010, and 480% from 2009. Friendly credit markets and the public equity bull market enabled exits and recapitalizations that helped drive distributions to record highs. Those same macro factors helped to elevate purchase prices and leverage, leading to a year when distribu-tions outnumbered contribudistribu-tions by a 2.4 times multiple.
Last year was the third in a row but only the sixth since the inception of the private equity index in which distributions outpaced contribu-tions; the others were 1996, 2004, 2005, 2011, and 2012. From 2006 through 2010, when contributions surpassed distributions, private equity fund managers in the index called 1.5 times as much capital as they distributed; from 2011 through 2013, distributions outweighed contributions by a multiple of 1.7.
Total distributions in 2013 from managers in the private equity index reached $134.6 billion—the largest annual amount since the index’s inception
Figure 1. Private Equity Contributions and Distributions
2005–13
0 20 40 60 80 100 120 140 160
2005 2006 2007 2008 2009 2010 2011 2012 2013
U
S
D
olla
r
(b
illio
ns
)
Calendar Years
Venture Capital Performance Insights
In 2013, the venture capital index produced its best return since 1999, driven largely by its performance in the second half of the year. Exceptional returns among all of the key sectors, especially IT, drove the benchmark’s result. The IPO market, healthy in three of the four quarters, had its best year in terms of number of public offerings since before the global fi nancial crisis. Contributions and distributions were lower in 2013 than in 2012; distributions outnumbered contributions for the year, hitting their second highest annual level since 2000. According to the National Venture Capital Association (NVCA) and Thomson Reuters, 81 venture-backed companies went public in 2013 for a total IPO offer value of nearly $11.1 billion. The number of venture-backed IPOs was up 65% from 2012 but the total offer value was almost half due to the outsized Facebook IPO in 2012. There were 390 venture-backed M&A deals in 2013, down almost 100 from 2012. For deals with values disclosed to the public, the average size of a venture-backed M&A transaction was $176.5 million, slightly higher than in 2012, when it was $171.9 million.
Fourth Quarter VC Performance Stellar; 2013 Strong Overall.
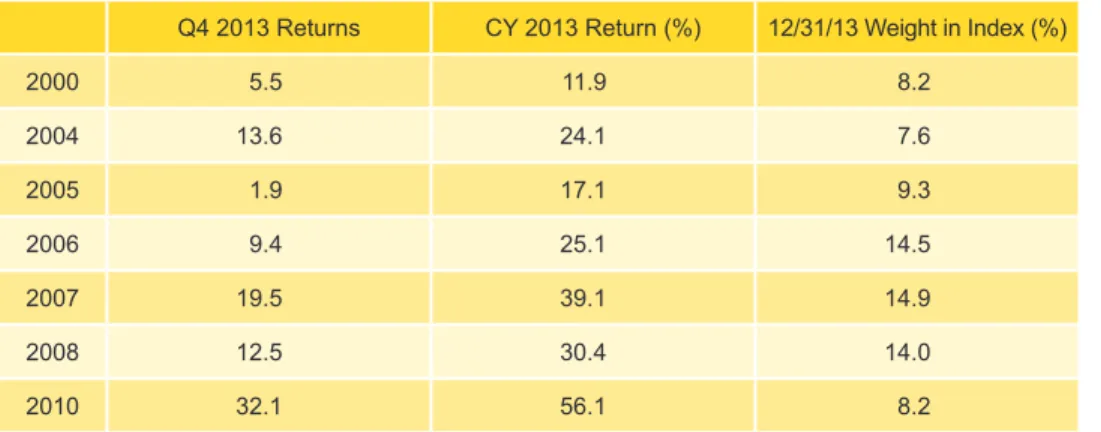
With each passing quarter in 2013, performance for the Cambridge Associates LLC US Venture Capital Index® improved, from a modest gain of 2.5% to start the year to an 11.9% return to end it. All of the meaningfully sized vintage years (see Table 4) posted returns of more than 5% in fourth quarter except vintage year 2005, and all had double-digit returns for the year. Vintage years 2007 and 2010, which accounted for 23.1% of the index, were the largest positive contribu-tors to fourth quarter performance due largely to the strong return and
In 2013, the venture capital index produced its best return since 1999, driven largely by its performance in the second half of the year
The IPO market, healthy in three of the four quarters, had its best year in terms of number of public offerings since before the global
fi nancial crisis
Q4 2013 Returns CY 2013 Return (%) 12/31/13 Weight in Index (%)
2000 5.5 11.9 8.2
2004 13.6 24.1 7.6
2005 1.9 17.1 9.3
2006 9.4 25.1 14.5
2007 19.5 39.1 14.9
2008 12.5 30.4 14.0
2010 32.1 56.1 8.2
Table 4. Venture Capital Vintage Year Returns: Net fund-Level Performance
size of the former and the exceptional return of the latter. Signifi cant write-ups in IT were the primary driver of performance in both the 2007 and 2010 funds, and while IT also helped the worst performing vintage in the quarter, 2005, the increase was much smaller and barely offset losses in other sectors. Remarkably, vintage year 2000 maintained its meaningful position in the index, representing 8.2%. At its peak in 2005, the vintage accounted for more than 40% of the benchmark.
IT Posted the Highest Fourth Quarter and Annual Returns in 2013.
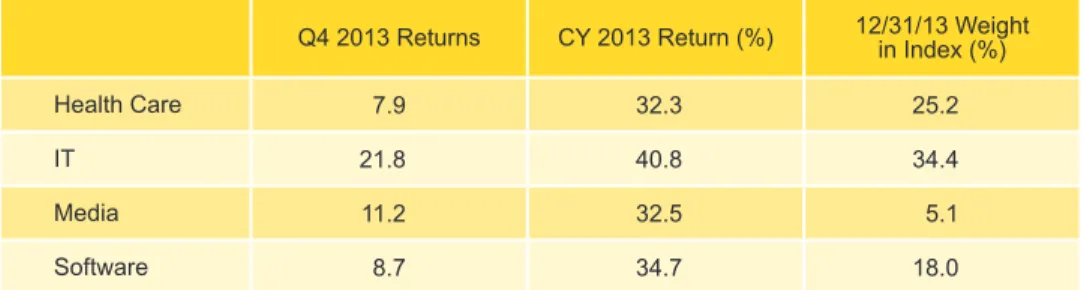
The venture capital index remained concentrated by sector, with the three largest—IT, health care, and software—accounting for nearly 78% of the index’s value (Table 5). With totals slightly higher than their long-term averages, over 76% of capital invested during fourth quarter went into companies in these sectors. Together, IT and health care companies garnered more than three times the dollars allocated to software. Among the large sectors, IT was the best-performing during the quarter, posting a 21.8% return, while health care’s 7.9% was the lowest. Four vintages, 2004, 2007, 2008, and 2010 saw bumps in IT valuations of more than $1.0 billion in the quarter; in health care, none saw any greater than $500 million.
For the year, the three largest sectors returned over 36.5%, outper-forming the total 2013 return for all portfolio companies by more than 3.7%. The outperformance was due to the IT gross return of 40.8%, by far the best among the top three sectors.
VC Calls and Distributions Increased Slightly from Prior Quarter Levels. In the fourth quarter, managers in the US venture capital index called just under $3.5 billion, an increase of $379 million, or 12.2%, from the previous quarter. Distributions also rose from the third quarter to the fourth, albeit by only 1.7%, to $6.5 billion. This marked the eighth consecutive quarter that distributions were higher than
For the venture capital index, over 76% of capital invested during fourth quarter went into companies in the health care, IT, and software sectors
Fourth quarter marked the eighth consecutive quarter where distributions were higher than contributions for managers in the venture capital index—a trend not seen since the 1990s
Q4 2013 Returns CY 2013 Return (%) 12/31/13 Weight in Index (%)
Health Care 7.9 32.3 25.2
IT 21.8 40.8 34.4
Media 11.2 32.5 5.1
Software 8.7 34.7 18.0
Table 5. Venture Capital Sector Returns: Gross Company-Level Performance
Managers in the US venture capital index called and distributed less capital in 2013 than they did in 2012
contributions. The venture industry had not experienced a similar LP cash fl ow trend since the 1990s.
Managers of funds raised in 2008, 2010, 2011, and 2012 called
approximately $2.3 billion, or roughly 66% of all capital called during the quarter. Each vintage called more than $400 million with the 2012 funds leading the way in calls equaling more than $975 million. Eight vintage years returned more than $400 million to investors during the quarter. Investors in the 2000 and 2006 vintage years each received more than $800 million in distributions and 31% of the total distributed.
Managers in the US venture capital index called and distributed less capital in 2013 than they did in 2012 (Figure 2). Contributions decreased 10.0% to $12.8 billion and distributions fell 3.6% to $21.5 billion. Distributions in 2013 were the fourth highest annual total of all-time, behind only 2012 and the bubble years of 1999 and 2000. ■
Figure 2. Venture Capital Contributions and Distributions
2005–13
0 5 10 15 20 25
2005 2006 2007 2008 2009 2010 2011 2012 2013
U
S
D
olla
r
(b
illio
ns
)
Calendar Years Contributions Distributions
About the Indexes
Cambridge Associates derives its US private equity benchmark from the
fi nancial information contained in its proprietary database of private equity
funds. As of December 31, 2013, the database comprised 1,125 US buyouts, private equity energy, growth equity, and mezzanine funds formed from 1986 to 2013, with a value of $638.2 billion. Ten years ago, as of December 31, 2003, the index included 528 funds whose value was $154.3 billion. Cambridge Associates derives its US venture capital benchmark from the
fi nancial information contained in its proprietary database of venture capital
funds. As of December 31, 2013, the database comprised 1,493 US venture capital funds formed from 1981 to 2013, with a value of $161.1 billion. Ten years ago, as of December 31, 2003, the index included 976 funds whose value was $43.3 billion.
The pooled returns represent the net end-to-end rates of return calculated on
the aggregate of all cash fl ows and market values as reported to Cambridge
Associates by the funds’ general partners in their quarterly and annual audited
fi nancial reports. These returns are net of management fees, expenses, and
performance fees that take the form of a carried interest.
Both the Cambridge Associates LLC US Venture Capital Index® and the Cambridge Associates LLC US Private Equity Index® are reported each week in Barron’s Market Laboratory section. In addition, complete historical data can be found on Standard & Poor’s Micropal products and on our website, www.cambridgeassociates.com.
Copyright © 2014 by Cambridge Associates LLC. All rights reserved.
This report may not be displayed, reproduced, distributed, transmitted, or used to create derivative works in any form, in whole or in portion, by any means, without written permission from Cambridge Associates LLC (“CA”). Copying of this publication is a violation of US and global copyright laws (e.g., 17 U.S.C. 101 et seq.). Violators of this copyright may be subject to liability for substantial monetary damages. The information and material published in this report is nontransferable. Therefore, recipients may not disclose any information or material derived from this report to third parties, or use information or material from this report, without prior written authorization. This report is provided for informational purposes only. The information presented is not intended to be investment advice. Any references to specifi c investments are for illustrative purposes only. The information herein does not consti-tute a personal recommendation or take into account the particular investment objectives, fi nancial situations, or needs of individual clients. This research is not an offer to sell or the solicitation of an offer to buy any security in any jurisdiction. Some of the data contained herein or on which the research is based is current public information that CA considers reliable, but CA does not represent it as accurate or complete, and it should not be relied on as such. Nothing contained in this report should be construed as the provision of tax or legal advice. Past performance is not indicative of future performance. Any information or opinions provided in this report are as of the date of the report, and CA is under no obligation to update the information or communicate that any updates have been made. Information contained herein may have been provided by third parties, including investment fi rms providing informa-tion on returns and assets under management, and may not have been independently verifi ed.
Cambridge Associates, LLC is a Massachusetts limited liability company with offi ces in Arlington, VA; Boston, MA; Dallas, TX; and Menlo Park, CA. Cambridge Associates Fiduciary Trust, LLC is a New Hampshire limited liability company chartered to serve as a non-depository trust company, and is a wholly-owned subsidiary of Cambridge Associates, LLC. Cambridge Associates Limited is registered as a limited company in England and Wales No. 06135829 and is authorized and regulated by the Financial Conduct Authority in the conduct of Investment Business. Cambridge Associates Limited, LLC is a Massachusetts limited liability company with a branch offi ce in Sydney, Australia (ARBN 109 366 654). Cambridge Associates Asia Pte Ltd is a Singapore corporation (Registration No. 200101063G). Cambridge Associates Investment Consultancy (Beijing) Ltd is a wholly owned subsidiary of Cambridge Associates, LLC and is registered with the Beijing Administration for