New Zealand
2012
Evaluating the Effectiveness and
Sensitivity of Forex Trading Robots
A thesis submitted in fulfillment of the requirements for the
degree of Master of computing
Yu Gu
Supervisor: Dr. Xiaohui Zhao
Associate Prof. Leon Fourie
Associate Prof. Hossein Sarrafzadeh
- 2 - | P a g e
Abstract
Robot trading, also known as algorithmic trading, has been widely used in financial markets in recent decades. The wide application of robot trading has brought significant benefits to transaction efficiency. A lot of developers have designed trading robots which can simulate their trading strategies, and they have claimed that these robots can keep making profits continuously in the place of human traders. However, their performance is usually not as satisfactory as human traders. Two factors could lead to this failure in trading: (1) programs cannot simulate all human behavior; and (2) most robots are over- sensitive, which may reduce their performance. To solve those problems, therefore, evaluating the effectiveness and
sensitivity of trading robots is necessary.
The contribution of this research includes a study of trading robots and their algorithms, trading robot experiment design, data analysis and improvements to program design. The study
focuses on the conceptual mechanism of trading robots, which includes trading applications and robots deployment.
This paper reports that forex trading robots are suitable for forex rates prediction. The evidence shows that trading robots can capture the underlying “rules” of the forex market trend by using time series, technical indicators and other factors. Traditional standards for robot trading analysis are used to evaluate the accuracy of forecasting currency price changes when traders are using their software for real trading. The results indicate that practical forecasting can be completed and paper profits be obtained, by using five different trading robots. However, the collection of sensitive analysis is incompatible with efficiency testing. Most testing results were
- 3 - | P a g e
collected by chart review, and the test results show that the effectiveness and sensitivity of robot trading are both interrelated and contradictory. The more sensitive trading robots take more trading opportunities, but this reduces performance.
Further research is discussed in this paper. In future work, more data segments will be required in the analysis, and all experimental data should be analyzed in different time frames on the currency of JPY / USD.
- 4 - | P a g e
Statement of Originality
This is to certify that the thesis is my own original work and it has been written by me. No part of this thesis has been submitted to any other institution other than Unitec as part of any other degree or diploma.
In addition, I certify that all information sources and literature used in the thesis are properly indicated. Any help and assistance that I have received in my research and the preparation of the thesis have been appropriately acknowledged.
Yu Gu
- 5 - | P a g e
Acknowledgements
First of All, I would like to express my sincere gratitude to my principal supervisor Dr. Xiaohui Zhao, as his solid knowledge and rigorous attitude inspired me to finish this thesis with an open and positive mind. His discussions have been very informative and useful. Without his kindness and considerable support throughout my research journey, this work would not have been possible.
I sincerely appreciate my co-supervisor Associate Professor Leon Fourie for his guidance, continuous support and critical evaluation of my study. I express my sincere thanks to him for agreeing to become my supervisor when I was critically in need of his expertise and guidance. During the entire course of the research, I have frequently consulted Associate Professor Hossein. I am very grateful for his support in all difficult situations. His suggestions have given me a lot of insight into this research. It has been a great privilege and joy to study under his guidance and supervision. I am also extremely grateful to Dr. Aaron Chen, who has kindly provided me with assistance and companionship in preparing this paper.
I would like to thank especially Margerat Fitzsimons, and my landladies Wendy and Jessica for their support in preparing the thesis and grammar checking. I sincerely thank all the people in the Department of computing of Unitec New Zealand, for their warm support and help.
Finally, I would like to thank my parents Mr Gu Guanda and Mrs Shen Tianqing for their love, support, and encouragement throughout the whole period of my study in so many ways. Without their support this work would never have been accomplished.
- 6 - | P a g e
Table of Contents
1. Introduction ... - 1 -
1.1. Robot trading on retail foreign exchange markets ... - 2 -
1.2. Motivation ... - 3 - 1.3. Research Goals ... - 4 - 1.4. Challenges of research ... - 6 - 1.5. Research Contributions ... - 6 - 1.6. Thesis Structure ... - 8 - 2. Background ... - 11 - 2.1. Forex elements ... - 12 -
2.1.1. Expression of currency pairs ... - 12 -
2.1.2. Trading sessions ... - 13 -
2.1.3. The calculation in foreign exchange market ... - 14 -
2.1.4. Leverage and fund management ... - 15 -
2.2. Technical indices ... - 16 -
2.2.1. Fundamental analysis ... - 16 -
2.2.2. Sentiment analysis ... - 20 -
2.2.3. Technical analysis ... - 20 -
2.3. Trading robot Evaluation methods ... - 23 -
2.3.1. Evaluation Criteria ... - 24 -
3. Algorithm of Trading robot ... - 26 -
3.1. Working mechanisms of trading robots ... - 26 -
3.2. Rules of risk control function ... - 27 -
3.2.1. Maximum 30% Drawdown ... - 27 -
3.2.2. Maximum 2% Loss of Each Trade ... - 28 -
3.2.3. Previews High / Low Strategy... - 30 -
3.2.4. ATR function ... - 32 -
3.3. Algorithm of fund management function ... - 33 -
3.4. Algorithm of market analysis function ... - 34 -
3.4.1. Moving average crossover ... - 34 -
- 7 - | P a g e
3.4.3. The Simple Indices combination ... - 38 -
3.4.4. The Cowabunga trading method... - 41 -
3.4.5. Dolphin trading method ... - 42 -
4. Experiments on Trading Robots ... - 47 -
4.1. Pre experiments creation ... - 47 -
4.2. Test environment setup ... - 50 -
4.2.1. Custom indicators design ... - 54 -
4.2.2. The Indicators filter design ... - 58 -
4.2.3. Modeling quality discussion ... - 60 -
4.3. Data gathering ... - 62 -
5. Evaluating the Effectiveness and Sensitivity of Trading Robots ... - 65 -
5.1. Measurement of trading robots... - 65 -
5.1.1. Involved indicators ... - 69 -
5.1.2. Evaluation process ... - 71 -
5.2. Prediction results and discussion ... - 73 -
5.2.1. Discussion on effectiveness ... - 73 -
5.2.2. Discussion on Sensitivity ... - 75 -
5.3. The relationship between effectiveness and sensitivity ... - 79 -
5.3.1. Interrelation ... - 79 -
5.3.2. Contradiction ... - 80 -
6. Approach for Improving Trading Robots ... - 81 -
6.1. Change indicators ... - 82 -
6.2. Session selection ... - 85 -
6.3. Parameter modification ... - 85 -
6.4. Evaluation of the improved program ... - 87 -
7. Conclusion and Future Work ... - 90 -
Bibliography ... - 93 - Appendix ... - 98 - Candle Sticks ... - 98 - Moving Average ... - 103 - MACD - 104 - RSI - 104 -
- 8 - | P a g e
List of Figures
Figure 2-1 Economic indicator selection window ... - 19 -
Figure 2-2 Candle sticks ... - 21 -
Figure 3-1 Stop level ... - 31 -
Figure 3-2 Bollinger Bands stop loss setting ... - 32 -
Figure 3-3 Moving average crossover... - 35 -
Figure 3-4 Stop loss setting of moving average crossover ... - 35 -
Figure 3-5 Simple indicators combination ... - 39 -
Figure 3-6 Using the simple indicators combination to capture the trend ... - 39 -
Figure 4-1 Working mechanism of MT4 terminal... - 53 -
Figure 4-2 Relationship between the candles stick update and the forex chart window ... - 56 -
Figure 0-1 Basic candlesticks ... - 98 -
Figure 0-2 Bullish Engulfing and Bearish Engulfing ... - 99 -
Figure 0-3 Tweezer Bottoms and Tweezer Tops ... - 100 -
Figure 0-4 Morning Star and Evening Star ... - 101 -
Figure 0-5 Three White Soldiers and Three Black Crows ... - 101 -
-- 9 -- | P a g e
List of Tables
Table 2-1 Currency pairs ... - 13 -
Table 2-2Trading session ... - 13 -
Table 2-3 The calculation for trading GBP / USD ... - 14 -
Table 2-4 Leverage and Lot ... - 16 -
Table 3-1 Maximum 30% drawdown ... - 27 -
Table 3-2 Minimum 2% loss calcualtion ... - 29 -
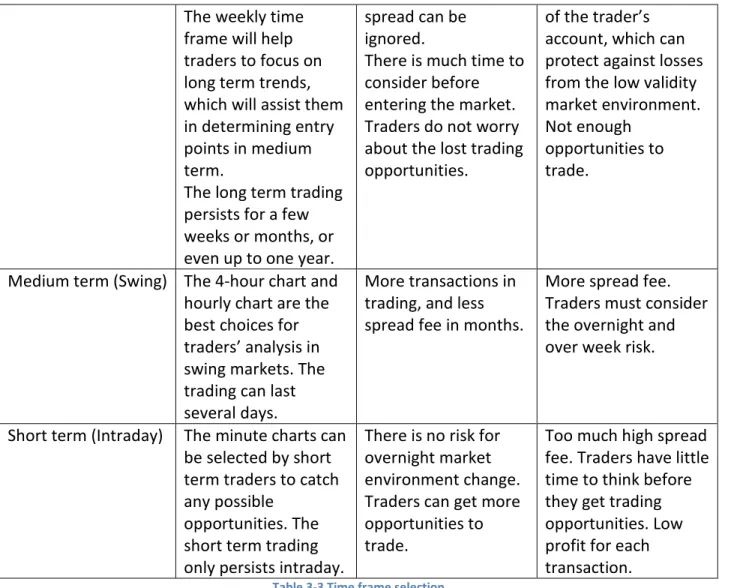
Table 3-3 Time frame selection ... - 43 -
Table 4-1 Pre experiment setting ... - 50 -
Table 4-2 Calculation of the Hurst exponent... - 50 -
Table 4-3 Trading robots selection ... - 52 -
Table 4-4 Three types of MQL4 scripts ... - 55 -
Table 4-5 Effect of modeling quality ... - 62 -
Table 4-6 Backward test ... - 63 -
Table 4-7 Forward test ... - 64 -
Table 5-1 Back test measurement ... - 67 -
Table 5-2 Forward test measurement ... - 68 -
Table 5-3 Indicators evaluation ... - 71 -
Table 5-4 Evaluation discussion ... - 75 -
Table 5-5 Sensitivity experiment ... - 76 -
Table 5-6 Effect of Market volatility ... - 77 -
Table 5-7 Effect of parameters modification ... - 78 -
Table 5-8 Effect of entry delay... - 78 -
Table 5-9 Interrelation analysis ... - 79 -
Table 5-10 Contradictory analysis ... - 80 -
Table 6-1 Factors that can influence the robot trading... - 82 -
Table 6-2 Backward test for an improved robot ... - 88 -
Table 6-3 Effectiveness evaluation for an improved robot ... - 89 -
Table 0-1 Concepts of triple candle chart... - 102 -
-- 1 -- | P a g e
1.
Introduction
The electronic foreign exchange (Forex) market is a global financial market for trading currencies and it was established in 1971. Since then, how one currency relates to another currency is expressed as foreign exchange, and it has naturally shifted from fixed to floating under the continuously trading environment. Unlike other markets, the foreign exchange market has a large trading volume, since it covers all the currency exchange transactions in the world. There is no physical trading location or a central market.
In the past, only large investment funds could trade currencies. This trading process is called “interbank” trading, and is established by large banks and major financial dealers. Spreads are generated from forex trading, and are presented by the gap between bids and ask. By the wide application of electronic forex trading, more and more retail foreign exchange brokers are providing individual trading services for ordinary traders. “Retail foreign exchange trading is a small segment of the large foreign exchange market.” (Wiki, 2011). Retail foreign exchange brokers earn money from spreads. Most of them are trust companies, small banks and other institutions. In the early 2000s, some software companies designed their own version of trading platforms. All this software includes trading interfaces and user terminals, and provides the functions to help traders design their own trading strategies.
Nowadays, trading robots are widely used in forex trading. Most of them are coded as programs, and they can automatically execute the trading by following trading signals. The greatest benefit of robot trading is the fast reaction to market sentiments. Usually, traders
- 2 - | P a g e
must waste time considering market sentiments and then make decisions. Trading robots can use pre-wired thinking and save time which can be used to handle many trading opportunities. Also, trading robots can avoid the psychological factors of human traders. There is no need to consider such factors as greed and fear influencing the trading results in robot trading.
1.1. Robot trading on retail foreign exchange markets
Robot trading, also known as algorithmic trading, has been widely used in financial markets in recent decades. It is “the use of computer programs for entering trading orders with the computer algorithm deciding on aspects of the order such as the timing, price, or quantity of the order, or in many cases initiating the order without human intervention.” (Wiki, 2011). In algorithmic trading applications, trading robots instead of humans analyze the historical data and make the decision to enter the trading.
Currently, a complex trading robot has three functions, viz., fund management, risk control and analysis. Fund management is a part the of investment strategy. In forex trading, fund
management is used to set the capital amount for each transaction. Unlike the fund
management function, the risk control function helps traders set a stop and loss level, and it is able to delete transactions that go in the opposite direction from the current market. The analysis function is used to capture trading opportunities, and it is always programmed by a variety of trading methods. However, most trading robots cannot capture all the market sentiments, and the historical data cannot present all future movements.
The major factor that causes trading robots to make mistakes is the nature of the forex market. The forex market is dynamic, and it is continuously moving within three types of market
- 3 - | P a g e
environments: up, down and sideways. Only real trading can make the change of price. Similar to other financial markets, changes in the forex rate is made by traders who are buying one currency and selling another, so historical data cannot determine future market movements. To fix the problems of trading robots, Jamie (2008) provides two forex trading analysis methods: fundamental analysis and technical analysis. Technical analysis is based on historical data
overview, which determines the future market movement. Fundamental analysis focuses on economic data and forecasts the potential market fluctuation. The economic information includes growth rates, interest rates and monetary policy, inflation, and unemployment. Jamie (2008) believes that both methods are important in forex trading analysis. He recommends that robot designers should pay more attention to collecting economic information, and that trading robots should be designed with a function that has the ability to close all transactions while the important economic messages are being released.
1.2. Motivation
The wide application of trading robots, including algorithmic trading, has brought considerable benefits to transaction efficiency. With regard to the effectiveness of forex trading, Martinez and Pappa (2009) assert that a profit system should have a high percentage of funds return rather than numbers of profitable orders. Nevertheless, in terms of the sensitivity aspect, Theodoros (2008) indicates that the robot should limit the number of noises, and that the total account could be increased but not be dependent on a profitable order percentage.
Many designers have developed trading robots, and have also claimed that these programs can replace human analysis and keep making profits by themselves. To evaluate the effectiveness
- 4 - | P a g e
and sensitivity of trading robots, it is important to grasp how these programs work. Generally, human traders consider many market factors before they place an order. In electronic financial trading markets, these factors can be categorized into technical index, timeframe and market environment. In this research, I plan to investigate how these trading robots make decisions to place orders against the categorized indicators.
From a practical perspective, I particularly evaluated the effectiveness and sensitivity of trading robots. The effectiveness of trading robots is defined as their capability to make profits through trading, so I will focus on the accuracy of trading strategies, the reduction of the loss rate and the increase of the total amount of the account. In regard to sensitivity, this research will concentrate on “noise” from the testing of trading robots. In particular, Siam and Esfahanipour (2008) indicate that trading robots should be equipped with optimization rules, a flexible policy configuration, dynamic trading and risk monitoring.
1.3. Research Goals
In order to cover the research topic, the research questions focus on the effectiveness and sensitivity of trading robots. As the trading analysis takes into account many market factors before they place an order, my research will target the following questions:
How does a trading robot respond to changing market conditions? How can the performance of these robots be evaluated?
How can the algorithms used by trading robots be improved to enhance their performance?
- 5 - | P a g e
The working mechanism of trading robots: A complex trading robot has three functions, which are fund management, risk control and analysis functions. In forex trading, the fund
management function is used to set capital of money for each transaction, the risk control function helps traders set the support and resistance level, and the analyses function is used to capture trading opportunities.
Effectiveness and sensitivity of trading robots: Two standards have been used in trading robots evaluation. They are effectiveness and sensitivity. As algorithmic trading is one of artificial intelligence, a trading robot can simulate human traders’ thinking under market changes. However, in some situations, the performance of trading robots is not as satisfactory as that of human traders. This is because of two factors: (1) computer programs cannot simulate all the mathematical algorithms that have been integrated into trading strategies, for example, the limitation of MQL4 programming influences the simulation of human behaviors; (2) Trading robots generate many noises, which reduce the percentage of profitable orders, and influence the trading performance. An effective robot should have a high percentage of funds return rather than numbers of profitable orders. In the sensitivity aspect, trading robots should limit the amount of noise, and the total account should be increased but not be dependent on a profitable order percentage. Thus, the relationship between effectiveness and sensitivity in robot trading is both interrelated and contradictory.
Designing an improved robot: This research conducts several factors that can influence the performance of trading robots. By improving those issues, the new robot can capture more trading opportunities and increase the success rate. After the new robot has been completely developed, a further effectiveness evaluation will be applied to this research.
- 6 - | P a g e 1.4. Challenges of research
The details of trading strategies are not within the scope of this study. Instead, this work aims to imitate the process of trading strategies using programs, and improve a variety of
implementation issues. The primary challenge of this research is the difficulty of applying fundamental analysis to robot programming. As market movement is decided by the publishing of economic events, this information is difficult to code as MQL4 to simulate human behaviors.
The second challenge is the simulation problem. In human trading, traders change their minds while following market environment changes. It is difficult for developers to code those complex behaviors into trading robots, and most robots cannot automatically change internal parameters. This will certainly influence the experiment results, and reduce the effectiveness of robots.
In addition, external factors also influence the robot trading experiment results. There are many retail forex trading brokers using MetaTrader networking services. However, using the same trading platform, different forex trading polices can make different experiment results. Firstly, each broker has their own spread policy, which could influence the transaction cost, and thus, the results in the deviation of effectiveness evaluation. Secondly, many retail forex
brokers cannot provide a complete set of historical market data. This could seriously influence the experiment result.
1.5. Research Contributions
The contribution of this research includes the algorithm of trading robots, the approach for trading robot tests, data analysis and a design for an improved program. The framework of this
- 7 - | P a g e
study provides basic information and a blueprint for operating procedures. In brief, each element of this framework is presented below.
Trading algorithm study: this study focuses on the trading robots mechanism, which includes trading applications and robots deployment. Therefore, evaluating methods to promote effectiveness and guard against sensitivity are a particular concern in this study. To deploy trading robots, MT4 system was studied.
Data gathering: Data gathering is the most important phase in this study. Gerald (2008) points out that future market movement can be determined by analyzing the histrionic data. Those data can be collected from document review, simulation tests and
development tests. Software documents can be a guide to robot design, programming and implementation. However, they only reflect basic concepts of characteristics. To further evaluate trading robots, simulation testing is necessary. Simulation testing is the method that continuously runs the trading robot in forex trading and captures the experiment results. This is a direct method to get the robots’ performance.
Development testing is more complex, since it develops the system to be used in both real and simulated environments in order to provide all needed functions and
comprehensive performance.
Data analysis and evaluation: There are three types of data collected in this research; internal parameter, performance data and transaction data. Checking performance is the first stage of data analysis. The raw result data will be filtered and sorted to extract the key indicators, such as profit, triggering events, trading times, frequencies, order amounts and order size. Chart review is the second stage of trading robot evaluation. At
- 8 - | P a g e
this stage of the data analysis, I intend to review the working procedure, which includes the three parts of placing an order: The pre-order procedure describes how a robot collects historic data, organizes time and selects a technical index. The ordering
procedure indicates the monitoring of the trading process, for the purpose of reducing possible risk. Decision marking parameters will also be important at this stage. In the pre-order procedure, the trading robot will select some technical index to follow the market trend. In different market environments, the trading robot will dynamically change parameters to follow a trend. Calculations of the NMSE and gradient have been applied in this research. They are important standards for evaluating the effectiveness of robot trading.
Trading robot improvement: After the previous analysis stages, a general result can be obtained. However, inference analysis can provide a further evaluation on robot reliability and accuracy, and an improved automatic trading robot can be generated. Compared with other trading robots, the new program improves many factors that can reduce the performance of the robot trading. Those factors are parameter modification, indicator modification, time frame selection and trading session selection. Furthermore, timeframe switcher was added to this program, which can filter out more trading
opportunities and improve the forecasting performance.
1.6. Thesis Structure
This thesis consists of 7 chapters, six of which are listed below.
Chapter 2 describes the research background of this study, and lists the details of economic concepts and trading strategies. This chapter briefly reviews the history of robot trading and
- 9 - | P a g e
the basic concepts of forex elements. Additional description of trading algorithms is given in this section, as they are essential parts of trading robots. Finally, to understand the process of trading robots evaluation, the simple concepts of effectiveness and sensitivity evaluation are introduced.
Chapter 3 introduces the process of forex trading and describes the working mechanism of trading robots. Firstly, Forex transaction by human traders can be divided into three steps and trading robots can simulate human traders’ behaviors and apply this mechanism in forex trading. Secondly, the communication between three basic functions has been created in trading robots. Those functions are fund management, risk control and trading strategies function. The final stage is getting profit from robot trading. This chapter picks up several trading robots, and explains their algorithms one by one. These algorithms have been programmed as MQL4 script, running in the MT4 trading platform.
Chapter 4 focuses on the experiment’s creation. Before the robot test, the pre-experiment is built for analyzing market environments. At this stage, only the value of the Hurst indicator is greater than 0.5 and the experiment result can proceed to further evaluation. The primary purpose of the experiment is to focus on the effectiveness and sensitivity evaluations. In the effectiveness area, the experimental data were presented as success rate and the increase of accounts. In the sensitivity test, the experimental data is completely conducted by chart review.
Chapter 5 analyses the experimental data that is generated from robot tests. The calculation of the NMSE and gradient was applied in this section. They are important standards for evaluating the effectiveness of the robot trading. To totally evaluate the effectiveness of the software, a
- 10 - | P a g e
concept of fund return is used in this evaluation. In the calculation of fund return, a positive result can be considered as the robot conducts trading efficiently. To evaluate the sensitivity of the software, noises become the most important standard. More noises generated in
experiments will lead to a higher loss in robot trading. Both effectiveness and sensitivity are important performance indicators for robot trading. The effectiveness evaluation focuses on a successful rate of transactions and the benefit of accounts, and the sensitivity evaluation concentrates on the number of transactions. This section indicates that effectiveness and sensitivity of robot trading are both interrelated and contradictory.
Chapter 6 designs an improved trading robot. The new program includes many factors that can reduce the performance of robot trading. Those factors are parameter modification, indicator modification, time frame selection and trading session selection. Furthermore, timeframe switcher has been added in this program, which can filter out more trading opportunities and improve the forecasting performance.
Chapter 7 is the final section which includes the discoveries of this research. The requirements of future work have been listed for further study.
- 11 - | P a g e
2.
Background
“In electronic financial markets, algorithmic trading or automated trading, also known as black-box trading or robot trading, is the use of computer programs for entering trading orders with the computer algorithm deciding on aspects of the order (such as the timing, price, or quantity of the order), or in many cases initiating the order without human intervention”. (Wikipedia, 2011)
Algorithmic trading started in early 1970s in financial markets, with symbols that the New York Stock Exchange (NYSE) adopted: Designated Order Turnaround (DOT) and the Opening
Automated Reporting System (OARS). The DOT system directly built a relationship between traders and trading desks, and executed electronic transactions at the trading. The OARS assisted traders to make decisions on settling orders.
Algorithmic trading was adopted by NYSE because MYSE market owned a value of more than 100 million dollars, with over 15 trading portfolios of baskets of orders. With such a large volume, computers are necessary to handle trading instead of humans. In the 1980s,
algorithmic trading was widely used in financial markets. Stock index arbitrage trading meant that traders bought (or sold) stocks such as S&P500 futures and simultaneously bought (or sold) a series of NYSE stocks, where the portfolio was highly relevant to the futures. The NYSE trading robot was enacted by a computer. When the direct spread was large enough to be profitable, the computer executed orders automatically.
In late 1980’s and 1990’s, the development of the telecom network made the financial market completely electronic. In the U.S. stock market, decimalization changes the minimum share
- 12 - | P a g e
price from 1/16 dollar to 0.01 dollars. This regulation changes market microstructure and reduces price spread, and thus reduces market liquidity. Papadamou and Stephanides (2005) consider that this probably promoted the development of algorithmic trading.
With more and more electronic trading, more algorithmic trading strategies have become possible. These strategies include arbitrage, statistical arbitrage, trend following and regression. Computers can effectively implement these trading strategies by monitoring different markets and analyzing the historical data.
2.1. Forex elements
2.1.1. Expression of currency pairs
In forex trading, products are described as currency pairs, and the trading process is exchanging one currency to another. For example, the exchange rate of the British pound and the U.S. dollar are formed as GBP/USD. Obviously the exchange rate is constantly fluctuating, and it is based on the stronger currency being addressed in the current currency pair.
Some currency pairs are traded by traders frequently, and are called major currency pairs,especially if one side of those currency pairs is the U.S dollar. There are seven major currency pairs that are traded every day in the world.
Currency Pairs Countries or regions of produce
Name of speech EUR / USD Europe / America Euro dollar
USD / JPY America / Japan Dollar yen
GBP / USD U.K. / America Pound dollar
USD / CHF America / Switzerland Dollar swissy USD / CAD America / Canada Dollar loonie AUD / USD Australia / America Aussie dollar
- 13 - | P a g e
NZD / USD New Zealand / America Kiwi dollar Table 2-1 Currency pairs
Other currency pairs that are traded in the forex market are called cross-currency pairs, when the currency pair does not include the U.S. dollar. For example, GBP / JPY is one of the cross-currency pairs.
2.1.2. Trading sessions
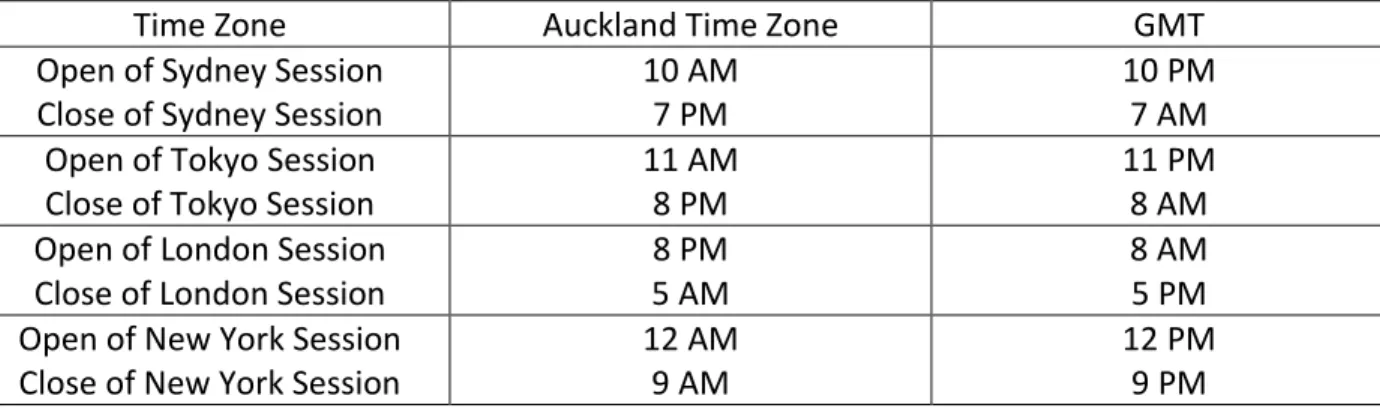
The foreign exchange market runs continuously within networks between banks for 24 hours. There is no physical trading location or central market. However, prices do not dramatically fluctuate whole day. The forex market trading sessions can be categorized into four major ones: the New York session, the London session, the Tokyo session and the Sydney session. The timetable of the four sessions is presented below. (Babypisps, 2011).
Time Zone Auckland Time Zone GMT
Open of Sydney Session Close of Sydney Session
10 AM 7 PM
10 PM 7 AM Open of Tokyo Session
Close of Tokyo Session
11 AM 8 PM
11 PM 8 AM Open of London Session
Close of London Session
8 PM 5 AM
8 AM 5 PM Open of New York Session
Close of New York Session
12 AM 9 AM
12 PM 9 PM Table 2-2Trading session
It can be seen from Table 2-2 that overlaps cross every two sessions. Typically, in each overlap, the forex trading activities are particularly busy, because transactions are being processed in two regions of the world. This creates greater volatility in the currencies’ prices, and thus makes more trading opportunities. In robot trading, session overlaps are usually designed in programs so that they can assist traders in maximizing profits. Archer (2008) believes that fluctuation in
- 14 - | P a g e
the forex market is different every week, and that this factor should be considered in robot programming.
2.1.3. The calculation in foreign exchange market
The basic calculation rules are usually performed by trading robots in forex market transactions, and human traders do not need to understand the principles. However, it is necessary to
introduce these concepts in this research. Developers of robot programming must consider those factors since they will influence the effectiveness and sensitivity of the trading robot.
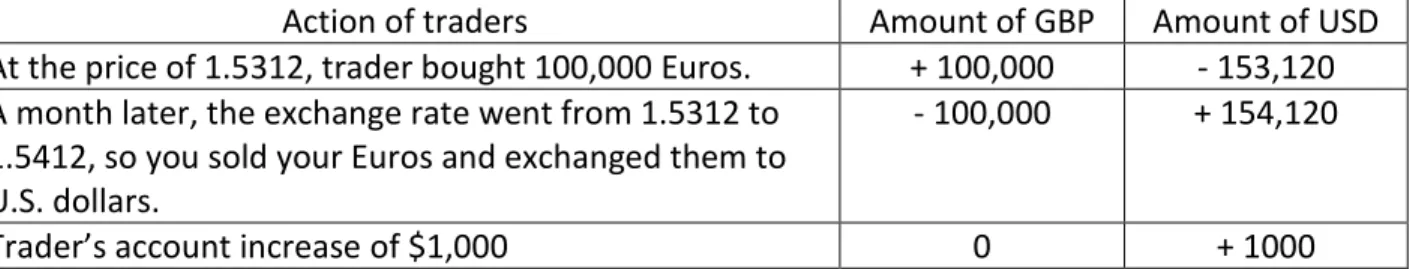
Unlike other financial markets, the foreign exchange market is traded with exchange rates. They are expressed as one currency relating to another, and are thus formed as currency pairs. Babypips (2011) states that transactions in forex markets are quoted as pairs because traders buy one currency and sell another. For example, EUR/USD is presented as the price of how many U.S dollars should be spent to buy a Euro. Wiki (2011) shows that the base currency is located to the left of the slash, and the counter currency is located to the right side. The table below is an example to show the calculation of trading GBP/USD.
Action of traders Amount of GBP Amount of USD At the price of 1.5312, trader bought 100,000 Euros. + 100,000 - 153,120 A month later, the exchange rate went from 1.5312 to
1.5412, so you sold your Euros and exchanged them to U.S. dollars.
- 100,000 + 154,120
Trader’s account increase of $1,000 0 + 1000
Table 2-3 The calculation for trading GBP / USD
In forex trading, the price of the exchange rates is presented as two prices. The bid price is used for the trader to purchase the base currency and sell the counter currency, and the definition of the ask price is the opposite. Therefore, spread is the gap between the bid and ask prices. In the
- 15 - | P a g e
sensitivity evaluation, spread is the major factor that influences the performance of trading robots, and thus it can make many of losses in the transactions.
2.1.4. Leverage and fund management
Archer (2008) introduces the concept of leveraged transaction. It is an investment method that uses a small amount of money to make a trade at several times the amount. The purpose of using leverage is to obtain a greater amount of profit. In the past, the specific money that was used to carry out forex trading was called lots. Due to the tiny daily movement of the forex market, traders needed to trade large amounts of currency to take advantage of a forex transaction. Archer (2008) argued that the nature of the forex market drove up the entry requirement until the service of leverage emerged.
In human trading, the retail forex broker requires traders to have basic funds, which are called “margin funds”. Once those initial funds have been deposited into a dealer’s account, the service of forex trading can be opened. Usually, the trading position is calculated as lot size multiplied by the leverage, which can maximize the profit from the trading. However, any related loss would be carried out several times and decrease the traders account as well. An example is posted by Babypips (2011) and given below to show how leverage and lots work.
Steps Actions of traders
1 Trader is buying USD / JPY at 92.59. Currently, the price is quoted as 92.56 / 92.59. Here, the spread is 3 pips. Due to the trader buying dollars, the trading price should be 92.59, which is called the ask price.
2 The trader sets a transaction by 1 standard lot, which is 100,000 units. 3 Then the price moves up to 92.78 and the trader closes his transaction.
4 At this moment, the new price of USD / JPY is quoted as 92.78 / 92.81. Once the trader closes the trade, the buy order would enter in the market. The trading price should be 92.78.
- 16 - | P a g e
pips
6 The profit of this trade should be ( 0.01 / 92.78 ) * 100,000 * 19 = $204.79 Table 2-4 Leverage and Lot
From Table 2-4, profit and loss from the trading can be calculated by the following formula:
Profit / Loss = (pip value / price) * lot size * pips of movement
Gerald (2008) indicates that leveraged forex trading increases the profit of transaction, but also expands the loss that is caused by analysis mistakes. Thus, fund management and risk control become more and more important. From the profit formula, resetting the capital of the lot size can reduce the risks that are taken by leverage. Babypips (2011) provides the formula of the relationship between leverage and lot size, as shown below.
Lot size = leverage * actually amount of each transaction
The above formula shows that regardless of how much leverage is regulated by retail brokers to control forex trading risk, the best method is to control the capital of the lot size. Therefore, most of the forex trading robots are programmed with fund management system, which has the ability to adjust the lot size.
2.2. Technical indices
Jamie (2008) indicates that there are three methods of forex trading analysis: fundamental analysis, sentiment analysis and technical analysis.
2.2.1. Fundamental analysis
Jamie (2008) considered that fundamental analysis is an efficient method to evaluate the economic, social and political factors, which focuses on money supply and demand. It is necessary to study economics factors, because only supply and demand can determine the
- 17 - | P a g e
currency price. In addition, Babypips (2011) states that fundamental analysis focuses on the reaction to economic events. In particular, it guides traders to predict the future movements of the Forex market. However, fundamental analysis is formed by many indicators. Jamie (2008) provides an example, an economic report of U.S. employment data, which could have changed the monetary policy of the Fed in America. However, John (2009) points out that many
economic events are not released as specific reports, but they could influence the reactions of traders, which can decide the future movement of the forex market. In all, Jamie (2008) considers there are several indicators that can be analyzed by traders: interest rates, inflation, monetary policy and economic growth.
Jamie (2008) indicates that the interest rate is the most important factor to help traders determine the forex market direction. Thus, it is necessary for traders to understand the
monetary policy of central banks, such as new interest rate decisions. Furthermore, John (2009) states that inflation decides the stability of central bank monetary policies. Inflation can make investment in products and services, but too much inflation can damage the economy. Thus, as Babypips (2011) indicates, central banks always watch the indicators that are related to
inflation, such as CPI and PCE. Usually, moderate inflation is accepted by central banks, because suppressing it could take the growth out of the economy. In order to keep inflation at a stable level, Babypips (2011) points out that central banks will change interest rates that lead to lower economic growth and inflation. But in the forex market, Jamie (2008) believes that higher interest rates can cause a stronger currency price. He defines a new concept of interest rate expectation, which can directly influence the movement of the forex market. Jamie (2008) considers that the forex market is moved by the different expectations of traders. So, as
- 18 - | P a g e
interest rates are not changed very often, most of traders do not focus on current interest rates, because they have already been issued by central banks. More important is the movement of the interest rates, which is defined as interest expectation by Babypips (2011). This web tutorial indicates that interest rate expectation can determine the future movement of the forex
market. To calculate the current interest rate, a formula is presented.
Real interest rate = nominal interest rate – expected inflation
Jamie (2008) also states that most used by traders use rate differentials, which can decide the future movement of a specific currency pair. The formula is presents as follows.
Rate differentials = base currency interest rate – counter currency interest rate
As well as interest rates, the monetary policy of central banks can influence future movements of the forex market. Jamie (2008) states that monetary policy is divided into contractionary and restrictive policies. They are used to increase or reduce the capital of the money supply, and can also make interest rates rise. Babypips (2011) believes that restrictive policy is also
increasing interest rates and reducing economy growth. Also, the difficulty of getting bank loans will reduce the spending and investment of businesses. On the other hand, with contractionary policy, which is opposite to restrictive policy, it is easier to borrow money or expand the supply of funds, and this will increase spending and investment and increase economic growth.
Babypips (2011) states that enterprises will spend money with large amounts of funds, and thus the tax will be increased for the government. This action can cause the whole society to spend, and will tend to be a positive influence on the economy. Meanwhile, Jamie (2008) indicates that the balance of capital flow can cause movement in the forex market as well. He provides
- 19 - | P a g e
an example of the positive aspects of capital flow to a country: in the situation of more investment from overseas, the government has to sell foreign currency to buy local currency. This action can lead to the value of local currency increasing. The related trade flow formula was posted by Babypips (2011) can be seen below.
Exports > Imports = Trade Surplus = Positive (+) Trade Balance
Imports > Exports = Trade Deficit = Negative (-) Trade Balance
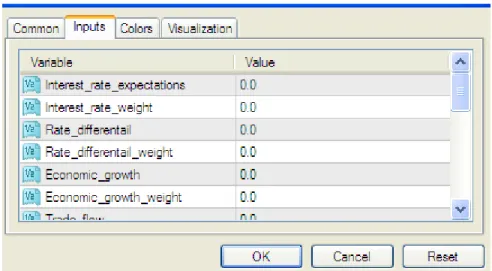
In trading robot design, programmers usually select five economic indicators as parameters in their trading robot. However, depending on the trading environment, the selection of
parameters will be different. For example, inflation can often be represented as CPI and PCE. The values of parameters are not expressed by economic data, instead a simple number can be better to predict the future market trend. The following diagram shows the economic indicator selection in trading robots.
- 20 - | P a g e
2.2.2. Sentiment analysis
In theory, price should reflect all the information of the forex market. However, it is not simple a simple matter for forex traders. The forex market does not reflect all the information, since it also includes the behavior of traders. Babypips (2011) states that traders have their own opinions on future market movements. The market is a combination of traders’ reactions to economic news. Jamie (2008) considers that no matter how strong the personal feelings of a single trader, the forex market will be influenced by most of the traders’ actions. Therefore, the market sentiment analysis contains some factors from both fundamental analysis and technical analysis, which focuses on the traders’ psychological state.
As an interest rate expectation, market sentiment depends on the psychological state of most of the traders. Jamie (2008) believes that sentiment indicators are not unique, since they
represent traders’ psychological states. Usually, economic data makes traders take action. Thus, the role of sentiment indicators is to measure the importance of the economic data. In forex robot trading, these indicators are usually used to presents the weight of specific economic indices. The Figure 2-1 also shows the application of sentiment analysis in robot trading.
2.2.3. Technical analysis
Archer (2008) considers that technical analysis is the framework that traders use to determine forex market movement. He believes that historical data can determine current market
conditions and potential movement. In theory, the present price can reflect all the information of the forex market, and thus trading can be made by that information.
- 21 - | P a g e
Gerald (2008) indicates that technical analysis is basically following the support or resistance level in the past chart. Traders keep watching it and determine the trading around that price level. But Jamie (2008) believes there are many patterns which are all important for trading that should be analyzed.
2.2.3.1. Japanese candlestick
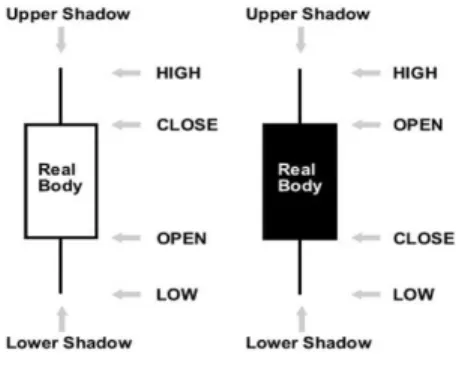
Babypips (2011) has created three basic charts to present historical movements in the forex market: line chart, bar chart and Japanese candlestick.
Figure 2-2 Candle sticks
Figure 2-2 presents the basic concept of the Japanese candlestick chart. Like the bar chart, the Japanese candlestick indicates the market direction in the period segment. “Open” presents the start price in the current period, “Close” presents the end of the price, and “Low” and “High” present the highest and lowest price at this moment. The Japanese candlestick is different from the bar chart. The reason is that it introduces the concept of “Body”, which presents current market direction.
2.2.3.2. Moving average
Moving average (MA) is based on the Dow Jones “average cost concept”. Similar to the “moving average” principle in the statistics, it aligns with the average financial market price in each of
- 22 - | P a g e
the time segments to display historical price volatility, and thus reflect the potential trends. In fact, we calculate the average price value of a specific period when we use this indicator. As with changes of price, the moving average can increase or decrease. There are four types of moving average: simple moving average, exponential moving average, smoothed moving
average and linear weighted moving average. Each of them has their own algorithm, but usually the formula of the moving average is presented as follows, because the most common
application is simple moving average.
SMAn = (C1 + C2 + C3 + … + Cn) / N
(C expresses the close price in the current period. N is present as the number of total periods.)
2.2.3.3. MACD
Moving Average Convergence / Divergence (MACD) is a dynamic index that is following the market trend. It is represented as a relationship between two moving averages. MACD indicator has three parameters. The first parameter presents the time period of the faster moving
average, and the second presents the slower moving average’s period number. The third parameter is calculating the moving average of the gap between the previous two MAs.
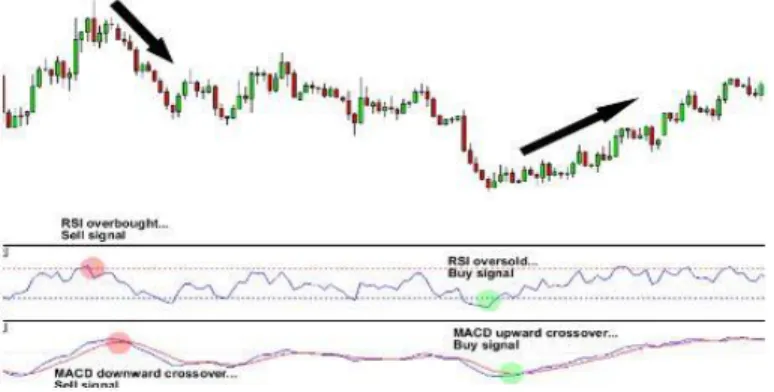
2.2.3.4. RSI
The Relative Strength Index Technical Indicator (RSI) is a price-following oscillator that ranges between 0 and 100. RSI is widely useful in forex trading. It does not only assist traders to determine the potential trend, but it also can help users distinguish the situation of oversold and overbought.
- 23 - | P a g e 2.3. Trading robot Evaluation methods
There are many forex trading robots that can assist traders to determine their strategies. However, Forextraders (2011) indicates many retail forex traders suspect robot trading
capabilities. This website tutorial believes many robots “tend to be marketed by extreme sales pitches” and always overstate their benefits when they are used in a real trading environment. Thus, it is necessary to evaluate the performance of those trading robots before traders decide to purchase the software.
A three-step test approach is issued by Forextraders (2011), which provides traders with a general concept of trading robots evaluation. The steps are described as below.
1. The backward test is the first step in robot evaluation. This often focuses on trading robot performance that was based on the currency pairs that were selected by traders and the historical price that was displayed in the trading platform. Forextraders (2011) reminds traders that the backward test may create a false prediction, because the historical data does not reflect future changes in the forex market.
2. A demo account should be created in the second stage. The trading robot is used in it so that a real-time test result can be conducted for further evaluation. Forextraders (2011) believes that experimental results can provide traders with a better sense than historical evaluation.
3. The third stage is based on a situation that assumes the test results from previous stages are satisfactory, and a micro account can be created for real-trading test. Forextraders (2011) believe that there are many differences between simulated tests
- 24 - | P a g e
and real-trading tests. Normally, a satisfactory living test result can ensure a high performance with trading robots.
Furthermore, Forextraders (2011) indicates that most robot backward test results are not satisfactory because of the low quality of historical data in MT4. This web tutorial believes that there is no ideal way to get accurate backward test results unless the historical price data is 100 percent accurate. Thus, a forward test is necessary for robots evaluation.
2.3.1. Evaluation Criteria
Forex Day Trading (2011) lists several criteria of forex trading robots evaluation. This website believes that an efficient trading robot should have some features of fast reaction, high successful rate and low risk.
2.3.1.1. Fast reaction when signal is issued
Jamie (2008) describes that the process of forex trading as a continuous operation,which trades and manages accounts on the forex trading platform. Thus, trading robots can replace humans and simulate this action automatically. Forex Day Trading (2011) indicates that, compared with human traders, trading robots can capture more short-term trading opportunities. This is because the default procedure of trading robots can reduce the response time, which is used by human traders to determine the future market and place orders. Therefore, the response time becomes an important criterion for trading robots evaluation.
Instead of hi-speed network devices, Forex Day Trading (2011) believes that algorithm structure is the major factor that can influence the response time. Thus, this website tutorial indicates that the response time can be used as adjustable internal parameters for traders.
- 25 - | P a g e 2.3.1.2. High success rate
Success rate has been widely mentioned in forex trading, and it is considered as one of the most important criteria for forex trading software evaluation. Forex Day Trading (2011) indicates that the success rate focuses on the total money amount and the number of profits orders.
The wide application of trading robots, including algorithmic trading, brings significant benefits to trading automation and transaction efficiency. With regard to the effectiveness of trading robots, Martinez and Pappa (2009) believe that a profitable system should have a high
percentage of profitable orders instead of trading values. Nevertheless, in the sensitivity area, Theodoros (2008) has indicated that the robot will set a limit for each order, and the total account could be profitable but not dependent on a profitable order percentage.
2.3.1.3. Low risk
Martinez and Pappa (2009) indicate that high risk carried in forex trading might not be suitable for all traders. The Foreign Exchange Market Explained (2011) believes that every forex trader has his / her own trading methods that can help him / her to enter and exit forex trading and determine the expected movements. A complex trading robot that is designed by experienced traders could reduce the risks for new traders. However, even the most experienced traders cannot determine all forex market future movements. A minimum loss should be designed for every transaction in forex robot trading. Thus, low risk becomes an important requirement in the evaluation of forex trading robots.
- 26 - | P a g e
3.
Algorithm of Trading robot
Consistent profitability is considered to be important by Marta & Brusuelas (2009). They believe that an effective trading system should assist them to continuously benefit from forex trading. Babypips (2011) indicates that a trading system can involve three functions: fund management, risk control and market analysis function. These three functions share a complex relationship, which is believed by Marta & Brusuelas (2009) to be dependent on the forex trading
mechanism.
3.1. Working mechanisms of trading robots
Fund management is a part of an investment strategy. In forex trading, traders always use fund management to set the capital for each transaction. Thus, capital size becomes more important in the trading process. Unlike the fund management function, the risk control function will help traders to set stop and loss levels, which can automatic close. The analysis function is used to make forex trading strategy, as it can make decisions to capture trading opportunities. However, most trading robots do not catch all the ever-changing market conditions. The foreign exchange market is dynamic, and it is continuously moving with three types of market environments: up, down and sideways. Trading robots cannot handle those complex movements by analyzing historical data. The risk control function monitors the whole process of transaction. Once a transaction has been cancelled, the analyze function will recalculate and search for new trading opportunities.
- 27 - | P a g e 3.2. Rules of risk control function
In the human forex trading scenario, traders are always confusing the difference between risk control and fund management function. The reason is that risk control includes some important concepts of fund management. However, in the robot trading scenario, there is a clear
boundary, in that risk control only pays attention to how much loss can be accepted in forex trading.
3.2.1. Maximum 30% Drawdown
The Foreign Exchange Market Explained (2011) indicates that even the most experienced trader cannot determine all future market movements. Therefore, the maximum drawdown is
programmed in most trading robots, where “A drawdown is the reduction of one's capital after a series of losing trades.” (Babypips, 2011). This is usually calculated as the gap between the initial capital and the remaining balance of the traders’ account. In other words, traders normally focus on the percentage of drawdown against their accounts.
According to experience, Babypips (2011) believes that a 30 percent drawdown can be accepted by most traders. The reason is described as follows.
Loss of initial capital Effort of getting back to breakeven 30% 0.3 / ( 1 – 0.3 ) * 100% = 43% 50% 0.5 / ( 1 – 0.5 ) * 100% = 100%
Table 3-1 Maximum 30% drawdown
The above example shows the reason for choosing a maximum of 30% drawdown as a basic concept for trading robots risk control design. Babypips (2011) indicates that a 30% loss of the total account can remain 70% money for traders, which means traders only require 43% of trading profits of the current account, and they can make the account get back to break even. It
- 28 - | P a g e
is hard to imagine a 50% loss of the initial capital, because traders must trade 100% profits of the current account to get back to their original account balance. Babypips (2011) points out that the more traders’ lose, the harder it is to get back to breakeven. Thus, a 30% maximum total drawdown can be accepted by most of traders.
The relationship between total loss of account and getting back to the original account balance can be presented by the formula below.
Pay back rate (Difficulty) of getting back to break even = Lost / (Account Size – Lost) * 100%
3.2.2. Maximum 2% Loss of Each Trade
A 30% maximum drawdown applied to traders’ accounts can help them to limit risks, but the loss of each trade is difficult to identify. Babypips (2011) assumes an experienced trader who has the ability to handle 70% trades can also lose all the money in his account. The reason is he has applied a false calculation in his risk control system. This website tutorial uses a statistical method and indicates that a 30% loss is not evenly distributed in all the transactions. This means that in the first 30 losses out of 100 transactions, the loss can be continued. This situation can be more complex for risk control calculation.
However, Snellgrove (2008) notes that failure trades will tend to be averaged distributed in a large number of transactions, so the relationship between the maximum drawdown and the maximum loss of each trade can be presented by the formula below.
- 29 - | P a g e
Through experiments, Babypips (2011) considers that more than 20 continuous lost
transactions is rare in real forex trading. According to the above formula, a maximum 2% lost from each trade is more acceptable for most of traders. The following examples prove this concept.
Trades No. Account Size 2% risk control
Trades No. Account Size 10% risk control 1 $10000 $200 1 $10000 $1000 2 $9800 $196 2 $9000 $900 3 $9604 $192 3 $8100 $810 4 $9412 $188 4 $7290 $729 5 $9224 $184 5 $6561 $656 6 $9040 $181 6 $5905 $591 7 $8859 $177 7 $5314 $531 8 $8742 $175 8 $4783 $478 9 $8567 $171 9 $4305 $430 10 $8396 $168 10 $3875 $388 11 $8228 $165 11 $3487 $348 12 $8063 $161 12 $3139 $314 13 $7902 $158 13 $2825 $283 14 $7744 $155 14 $2542 $254 15 $7589 $152 15 $2288 $229 16 $7434 $149 16 $2059 $206 17 $7285 $145 17 $1853 $186 18 $7140 $142 18 $1667 $167 19 $6998 $139 19 $1500 $150
Table 3-2 Minimum 2% loss calcualtion
Table 3-2 shows a huge gap between 2% maximum on each trade and 10% maximum on each trade. In the 10% risk control strategy, the total loss is high, up to 85% after 19 transactions. Based on the remaining account balance after 19 transactions, the trader must increase his account balance by 566% to compensate for the occurred loss. On the other side, a 2% maximum strategy is more acceptable for most traders, and total drawdown is close to 30%. Within this risk control method, traders can more easily get back to breakeven.
- 30 - | P a g e
3.2.3. Previews High / Low Strategy
Price fluctuations in the foreign exchange market are unpredictable, and they are driven by every possible factor. These factors include global politics, major economic events and central banks’ rumors. This means that every trader can take action in the opposite direction of the market movement. The “maximum 2% lost for each trading” strategy can help traders minimize the total lost. However, Babypips (2011) is against traders applying this method in all situations. This website tutorial recommends traders should set their stop loss according to the market environment. They provide an example of a newbie trader applying a “maximum 2% lost” strategy and failing in trading.
The newbie trader has an account with $500, which can use a $10,000 minimum lot size for each trade. In this situation, he can only set a 10 pips stop for a possible loss in GBP/USD trading. But the everyday movement of GBP/USD is over 100 pips. He could lose a potential opportunity by a narrow stop range.
Thus, using equity stops, like the “maximum 2% lost for each trading” strategy, he will be close to entry position and could take a loss in trading. Gerald (2008) indicates that the risk control function should use technical analysis while the system is using equity stop methods.
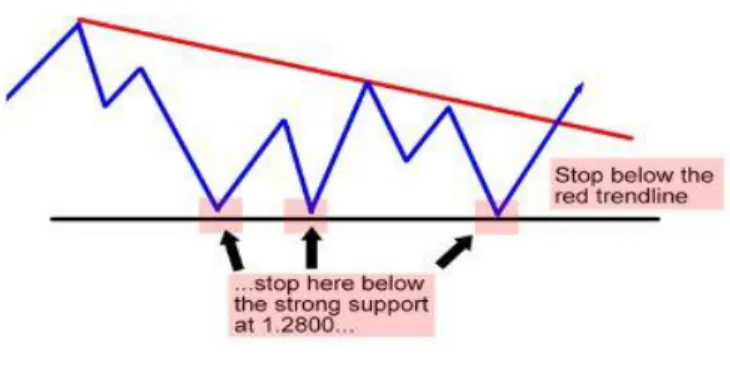
A more sensible method to apply to the risk control function is using chart stop. Babypips (2011) notices there are many times when the forex market cannot reach a certain price level or area. Those price levels or areas can be called support or resistance in human technical analysis. Gerald (2008) believes that applying stop levels beyond those areas can reduce potential risk efficiency, because once the currency price breaks support and resistance levels, there are
- 31 - | P a g e
more traders who can be attracted and take action to push the price to further movement. This means the action of breaking those levels is unpredictable, and can tell traders that market direction has already changed. The following diagram shows how to apply the chart stop in human forex trading.
Figure 3-1 Stop level
Setting stops beyond support or resistance levels can clearly reduce trading risks. However, in the robot trading environment, it is hard to define a specific support or resistance level. Babypips (2011) indicates that there is no exact number to identify the support and resistance area. In candlestick charts, those areas are always tested by price. As the graphics cannot be digitized, the robots’ programming becomes complicated.
An alternative solution is suggested by Babypips (2011), which is called “previews low / high strategy”. They believe the previews stick’s low / high is a better stop level in the same trend. However, the case becomes more complex in trends exchange, when the previews stick is certainly not good for setting support and resistance level. In this situation, the technical indicator which is called “fractals” can be used to replace the “previews low / high strategy”.
- 32 - | P a g e
3.2.4. ATR function
Another simple method to set stop loss is provided by Marta & Brusuelas (2009). They believe that market volatility is the potential movement range. Knowing how large the volatility of a currency pair is can assist traders to set a better stop level, and thus avoid many potential losses of the unpredictable movement.
For example, a 20 pips stop loss will fail a transaction in a small movement against you, while the everyday fluctuation of a specific currency pair is more than 100 pips.
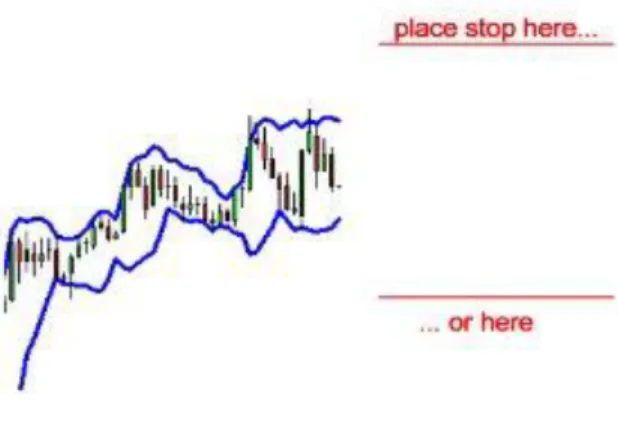
“One way to measure the volatility is by using Bollinger Bands. You can use Bollinger bands to give you an idea of how volatile the market is right now.” (Babypips, 2011). The Bollinger bands stop loss method is presented by the following diagram.
Figure 3-2 Bollinger Bands stop loss setting
The above diagram indicates that Bollinger bands can provide default support and resistance levels by using Bollinger bounce. The best application is applied in ranging markets. Traders can set the long order when the price touches the lower band, and set the short order when the price touches the upper band. The formula for setting the stop loss level can be represented as below.
- 33 - | P a g e
Stop Loss level = Upper bands + fluctuation
Stop Loss level = Lower bands - fluctuation
However, an exception is noted by Marta & Brusuelas (2009). The market always breakouts the current environment when the upper and lower bands squeeze together. In this situation, the stop loss levels are difficult to set up.
An improved strategy is issued by Babypips (2011), called an ATR function. They believe this indicator is more useful in both a large fluctuation and a ranging market environment.
3.3. Algorithm of fund management function
“Money management is a strategic technique employed at making money yield the highest of interest-yielding value for any amount of it spent.” (Wiki, 2011). In forex trading, fund
management usually is concerned with position size configuration. Babypips (2011) believes it is important to calculate the position size in forex trading, because like the risk control function, it can reduce the potential risk. There are five basic elements that are provided by this website tutorial. They are “(1) Account equity or balance. (2) Currency pair for trading. (3) The percentage lost for risk control. (4) Stop loss in pips. (5) Conversion currency pair exchange rates.” (Babypips, 2011). Those elements can assist traders to calculate a suitable position size in future trading.
An example is given by Marta & Brusuelas (2009). A newbie trader applies for an account in the forex market with 10000 dollars. For currency EUR / USD, the risk of price fluctuation should be under 200 pips each transaction. As the previous section mentioned, 2% maximum loss for each trade can be accepted. So in this example, a 1% loss for each trade has been applied in the risk
- 34 - | P a g e
control system, which is less than 2%. The risk percentage amount in the traders’ account balance can be calculated as follows:
USD 10000 * 1% = $ 100
The risk value for every pip can be calculated as below:
$100 / 200 pips = $ 0.5 / pip
In this situation, it is better to set a mini lot or less in every transaction.
$ 0.5 each pip * (10000 units for EUR / USD) / $ 1 each pip = 5000 units for EUR / USD
Therefore, the calculation for risk comfort level should be represented as the follow formula.
Comfort level = (account balance * 1% / fluctuation) * (lot size / pip value)
3.4. Algorithm of market analysis function
3.4.1. Moving average crossover
“A crossover describes the event price crossing through a moving average. It also refers to one moving average crossing over another moving average of a different time period. Both of these events are used as trading signals.” (Traderslog, 2011). When using this technical
indicator, traders have to use more than two moving averages in their trading charts. The entry signal can be conducted where the two lines cross. This means the trend will be switched soon. The detailed instructions are represented by the following diagram.
- 35 - | P a g e
Figure 3-3 Moving average crossover
A suitable stop loss level can be set by the moving average as well. Babypips (2011) states that the slower moving average line is the best support and resistance level of a risk control system. The following diagram shows the price bounced off the MA at every time, and which one is the best time for setting stop loss levels.
Figure 3-4 Stop loss setting of moving average crossover
The algorithm of moving average cross-over should be similar to the above descriptions. The robot has to set an entry point while two moving average lines cross over eachother. As the slower moving average line can be a good support or resistance level, the stop loss should be set at this point. Thus, the robot program should obey the following rules.
- 36 - | P a g e
1. The entry signal of a moving average cross over can be set while one moving average crosses over another. If the fast line crosses over the slow line, the trading robots should issue the long signal. On the other hand, when the fast moving average crosses under the slow line, the short order should be issued.
2. For unpredictable reasons, the slower moving average line could be the support and resistance level. When the price hits the stop level, the robot should reset the new order at the middle of the space between the fast and lower moving averages. The direction of the new order should be the same as the previews orders.
3. The robots must close their orders when the next crossover has been made, or when the price hits the slower moving average.
The algorithm for MQL4 script can be represented as below.
//+---+ //| Main function |
//+---+ for(int i=0;i<OrdersTotal();i++)
{
if(OrderSelect(i,SELECT_BY_POS,MODE_TRADES) == false) break; if(Ordersy() ==sy() && OrderMagicNumber() == MAGICMA) {
if(OrderType() == OP_BUY) buys++; if(OrderType() == OP_SELL) sells++; }
//+---+ //| Check for open order conditions | //+---+ //---- sell conditions
if(Open[1] > average && Close[1] < average) {
res=OrderSend(sy() , OP_SELL , sizeSize() , Bid , 3 , 0 , 0 , "" , MAGICMA , 0 , Red); return;
- 37 - | P a g e
}
//---- buy conditions
if(Open[1] < average && Close[1] > average) {
res=OrderSend(sy() , OP_BUY , sizeSize() , Ask , 3 , 0 , 0 ,"", MAGICMA , 0 , Blue); return;
} //---- }
//+---+ //| Check for close order conditions | //+---+ if(OrderType() == OP_BUY)
{
if(Open[1] > average && Close[1] < average) OrderClose(OrderTicket() , Ordercapital() , Bid , 3 , White);
break; }
if(OrderType() == OP_SELL) {
if(Open[1] < average && Close[1] > average) OrderClose(OrderTicket() , Ordercapital() , Ask , 3 , White);
break; }
3.4.2. Triple Moving average cross over
The triple moving average cross over can be generated entry by the signal as well. By using this strategy, the long and short signals are generated before the trend is defined. The third moving average line is different from the normal moving average cross over because it is used to confirm the trend, and thus avoid a false signal in forex trading.
According the algorithm of the moving average, the faster the time period, the closer the price trend. Thus, the short term moving average will start to move earlier than the long-term line. Trading robot programming should obey the following rules.