Real-Time Monitoring Package
PimpMonitor,
PimpVasWatch, and
PimpMy for SoftGrid Management Pack Version 1.3.1.0
Package Administration and User Guide
Contents
1. Introduction ... 4
1.1 Trial Policy ... 5
1.2 License Policy ... 5
1.3 Support Policy ... 5
1.4 Package Contents ... 5
2. Installation ... 6
2.1 Installing PimpMonitor ... 6
Installation Steps for PimpMonitor ... 6
2.2 Installing PimpVasWatch ... 7
Installation Steps for PimpVasWatch ... 7
2.3 Importing SoftGridByTMurgentTechnologies.mp ... 7
3. Configuration ... 8
3.1 Configuration of PimpMonitor ... 8
Configuring the Service via services.msc ... 8
Configuring operation via the Registry ... 8
3.2 Configuration of PimpVasWatch ... 9
3.3 Overrides for PimpMy for SoftGrid Management Pack ... 12
4. Using the Package ... 14
4.1 Interfacing with PimpMonitor ... 14
4.2 Using PimpVasWatch ... 14
Monitor Tab ... 14
Active Clients Tab ... 16
Active Applications Tab ... 17
Test VAS Ports Tab ... 17
4.3 Using PimpMy for SoftGrid Management Pack ... 19
Monitors ... 21 Rules ... 23 Views ... 26
1. Introduction
Thank you for purchasing PimpMy for SoftGrid Real-Time Monitoring Package from TMurgent Technologies. This package is part of a family of products under the PimpMy brand. At
TMurgent Technologies, we believe that you should (almost) never use a product just the way the vendor decided you should use it. This is one of the reasons (besides application
virtualization) that we love SoftGrid -- because it enables us to customize the same application in different ways for separate groups of users to achieve an optimized experience for each user. SoftGrid itself is no different. And this is why we developed the PimpMy for SoftGrid product line. To Pimp something is slang for customizing it. You can Pimp your car, pimp your office; and now you can Pimp your SoftGrid! Your SoftGrid infrastructure is a critical to your users. A lot of users. Currently you are blind as to how the VAS is operating. Pimp Your SoftGrid as see what is happening.
This package consists of three components:
PimpMonitor is a Windows Service installed on Microsoft Virtual Application Servers to
enable real-time monitoring of the Virtual Application Server (VAS).
PimpVasWatch is a WPF enabled user interface program that provides a means to verify
function and view performance of the VAS. PimpVasWatch locally, or remotely, uses the PimpMonitor as a remote agent to derive and communicate this performance
information.
The PimpMy Management Pack for SoftGrid is a Management Pack for use with System Center Operations Manager 2007 . This Management Pack allows Operations Manager to better Monitor Virtual Application Servers by using information from PimpMonitor and other direct sources.
These components are designed to work with SoftGrid 4.0 through the 4.5 Beta, although we also expect it to work with both earlier and subsequent releases. The package enhanced real-time management capabilities to the traditional Virtual Application Server (4.2 and below) and both the Heavy-Weight and Light-Weight servers in version 4.5. The MOM Management Pack also supports relevant versioned SoftGrid Clients, both SoftGrid for Windows Desktops and SoftGrid for Terminal Servers.
1.1 Trial Policy
TMurgent offers a free 30 day trial of this package. You may install components of this package on as many systems as you like during the trial. After 30 days you must purchase appropriate licenses or remove the product completely from any unlicensed computers.
1.2 License Policy
This package is licensed based on the size of the SoftGrid environment that it supports. The PimpMy brand includes a number of packages that support SoftGrid, and the licensing policy is consistent between these packages. To use this product after the trial period, it is necessary to purchase a number of licenses that match the number of production SoftGrid Virtual
Application Servers, plus one. This “extra” license covers use of this package on test/development servers and as many additional machines for which you install the
PimpVasWatch and PimpMy for SoftGrid Management Pack components. To purchase licenses, please visit our web-site at www.tmurgent.com for on-line ordering and contact information. Licenses are valid for one year and require a modest renewal. After the trial period, a valid license is necessary to receive support.
Upon purchasing the appropriate number of licenses, you will receive an XML license file. Just drop this license file into the root of the content share of your SoftGrid environment.
1.3 Support Policy
TMurgent offers email technical support for this product. Please send relevant details, such as operating systems and associated product revisions to [email protected].
1.4 Package Contents
The package is distributed as a ZIP file. Open up the compressed file to reveal the following files:
PimpMonitor_SgVasService.msi Installer for the PimpMonitor Service. PimpVasWatch.msi Installer for the PimpVasWatch Graphical User Interface
2. Installation
We recommend installing and configuring these components in the following order.
Recommendations on configuring each component appear in the Configuration section of this document.
2.1 Installing PimpMonitor
PimpMonitor is a light-weight service for installation on Microsoft Virtual Application Servers. This service acts as in interface, to the PimpVasWatch program and other external programs. Using this interface, these programs can use PimpMonitor to investigate the real-time
performance characteristics of your Virtual Application Server.
PimpMonitor uses proprietary techniques, developed at TMurgent, to extract performance information related to VAS activities directly from the Windows Kernel. These techniques are very efficient, placing very little load in memory or CPU consumption (except when the WMI interface is used). PimpMonitor offers two interfaces that may be used by external programs.
An efficient binary communication protocol. PimpMonitor will listen to requests on a configurable UDP port and respond with the appropriate information. This binary interface is used by PimpVasWatch. Vendors wishing information on this interface should contact TMurgent for more information.
An open WMI communication interface. WMI (Windows Management Interface) is Microsoft's implementation of the Desktop Management Task Force (DMTF)
management interface. PimpMonitor implements a WMI provider in a new namespace called "root\tmurgent". Documentation of this interface is available from the
Management Object Format (MOF) file installed in the main installation folder. WMI is a less efficient interface than the binary interface , both in CPU and Bandwidth, when request a request is made. But it provides easier interfacing with other existing tools, such as Operations Manager. The PimpMy for SoftGrid Management Pack is an example of an external program that uses this WMI interface.
It is not necessary to restart the PimpMonitor service if you restart the VAS service; PimpMonitor will detect the newly running service automatically.
Installation Steps for PimpMonitor
PimpMonitor is installed using the PimpMonitor_SgVasServer.msi installer. PimpMonitor is installed on all servers with the Microsoft SoftGrid Virtual Application Service running
(including 4.5 “Light Weight” Servers). It requires installation of the .NET 3.5 framework. If the framework is not installed, the installer will inform and direct installer to a Microsoft web page containing the installer for the framework. Upon successful installation of the framework (potentially including a reboot of the server), the installation for PimpMonitor should be started again. It is not required to reboot following an initial installation of PimpMonitor. If upgrading a previous version, it is recommended that you first stop the existing PimpMonitor service;
otherwise a reboot may be needed after the upgrade is complete.
Installation adds the PimpMonitor service into the Windows Services Manager. The service is configured for autostart after a reboot and will be started for you at the completion of a
successful installation. Installation also copies a MOF (Management Object Format) file into the installation folder and uses mofcomp to install the MOF into the system. This enables WMI access to the service.
2.2 Installing PimpVasWatch
PimpVasWatch is a GUI tool for SoftGrid Administrators to help with real-time management of the SoftGrid Virtual Applciation Servers (VAS). It communicates with the PimpMonitor service on each VAS to obtain real-time performance information. The tool will discover servers by accessing the SoftGrid database.
Installation Steps for PimpVasWatch
PimpVasWatch may be installed on any desktop/server OS newer than Windows 2000. PimpVasWatch requires installation of the .NET 3.5 framework. If the framework is not installed, the installer will inform and direct installer to a Microsoft web page containing the installer for the framework. Upon successful installation of the framework (potentially including a reboot of the server), the installation for PimpVasWatch should be started again. It is not required to reboot following an initial installation of PimpVasWatch.
The installation creates no shortcuts automatically; you may manually create shortcuts, if desired. To run PimpVasWatch, just run the "PimpVasWatch".exe executable from the install folder.
2.3 Importing SoftGridByTMurgentTechnologies.mp
From the System Center Operations Manager 2007 Operator Console, select the Administration function in order to import the management pack. Click on Import Management Pack and locate the SoftGridByTMurgentTechnologies.mp file.
3. Configuration
This section will highlight the configuration capabilities of the three components of this package.
3.1 Configuration of PimpMonitor
PimpMonitor typically needs no configuration after installation; however, there are some things that are configurable.
Configuring the Service via services.msc
Upon Installation, the service will run under the network service account, by default. You may modify what account this service runs under, if necessary based upon your security policies. The account used must have system level registry, network, and process query permissions in order perform.
Upon installation, the service will be set-up to auto-start upon system boot. The order of service startup is not important – PimpMonitor will detect the VAS whenever it starts up. The service is not set to automatically restart in the case of failure (because we have not seen it ever fail). Some may want to enable this via the Windows Services Manager.
Configuring operation via the Registry
When the PimpMonitor service starts, it will read the registry for configuration information. You may modify these registry keys using a registry editor if desired.. These keys are shown in the table below:
Key Default Value Purpose
HKEY_LOCAL_MACHINE\SOFTWARE\Tmurgent\
PimpMonitor\LogFile "[InstallPath]\PimpMonitor.log" Location for a log file used by the Monitor. HKEY_LOCAL_MACHINE\SOFTWARE\Tmurgent\
PimpMonitor\LogLevel 1
0 disables logging. 1 enables logging for the first 5 intervals only. 2 or higher enables verbose logging and should not be used.
HKEY_LOCAL_MACHINE\SOFTWARE\Tmurgent\
PimpMonitor\MonitorIntervalSeconds 1 Frequency, in number of seconds, that the monitor will check the VAS. HKEY_LOCAL_MACHINE\SOFTWARE\Tmurgent\
PimpMonitor\UdpCommPort 8079
UDP port used for communications between the Monitor and the PimpVasWatch Console
The PimpMonitor log is for troubleshooting only. Normally the LogLevel should be set to either 1 or 0. The log file is never cleaned out by PimpMonitor. The default setting of 1 logs the service startup and first 5 monitoring intervals only. This is just enough information to see that when the service started and that it started successfully. Any errors that occur in the service will also be recorded via this setting, although your server would probably be having other issues before any errors would occur that would cause this to happen.
The monitoring interval is the period of time, in seconds, that the Monitor will wake up and make measurements of the Virtual Application Service. Extending this time will reduce a small amount of overhead, but even at a 1 second polling rate, the monitoring part of this service uses only a very small amount of CPU (less than one-hundredth of one percent of a single CPU). Increasing this value will decrease the granularity of information displayed by PimpVasWatch. Normally, if you increase this setting here, you will want to set the PimpVasWatch setting to be the same value, or a multiple of it.
PimpMonitor listens for information requests over a UDP port from PimpVasWatch (and potentially other third party products). The default port of 8079 may be modified if in use elsewhere. If you change the value here, you will need to change it in PimpVasWatch also. Remember that all configuration changes to PimpMonitor require a restart of the PimpMonitor service. It is never necessary to restart the VAS service due to a change in configuration to PimpMonitor.
3.2 Configuration of PimpVasWatch
The installer creates no shortcuts for PimpVasWatch. You may locate PimpVasWatch.exe from its installed location. You may want to create a shortcut for it. Launch PimpVasWatch.exe to configure the product for first use.
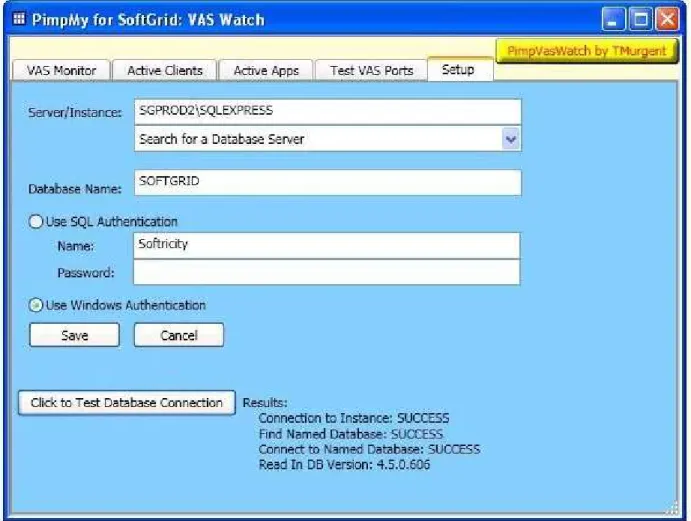
The PimpVasWatch interface consists of (up to) 5 tabs. If the product has not been configured, it will open to the Setup tab. Once configured, it will automatically open to the Monitor tab. Configuration changes may be made on the Setup Tab at any time.
In the Setup tab (See Figure 1 on page 10), you will need to enter the information to enable PimpVasWatch to query the SoftGrid database to find information about your Virtual Application Servers.
You may type in the Server/Instance directly, or open the “Search for a Database Server” pull-down to search for and enumerate all database instances that can be located in the domain (this might take a little time). Click on correct SoftGrid database server to auto-enter the name into the Server/Instance field. By default, SoftGrid will be installed with a database name of either Softricity (4.2 and below) or SoftGrid (4.5), however some SoftGrid customers have renamed the database in their production systems.
Figure 1 - Example of PimpVasWatch Setup Tab
PimpVasWatch requires only read-access to the SoftGrid database. It is not necessary to use the same authentication used by either the VAS or the Management Server. Prior to SoftGrid 4.5, the VAS and Management Server used only SQL Authentication. In 4.5, these components now use Windows Authentication. We recommend using windows authentication for
PimpVasWatch in either case. If you are running 4.2 or below and your SQL Database Administrator is unable/unwilling to provide SoftGrid Administrators with read access to the SoftGrid database, then you can use the SQL UserName and Password used by the VAS and Management Server. You can find the SQL UserName and Password stored unencrypted in the VAS "Softricity.conf" file, or the Management Server "Softricity.udl" file where those products are installed.
Click on the test button (labeled “Click to Test Database Connection”) to test your settings and retrieve the SoftGrid database revision.
You must click on the save button to store this information into the Windows Registry before exiting this Setup Tab. This will save the settings into the Windows Registry.
In addition to the GUI setup interface, PimpVasWatch uses the following registry keys for storing configuration information:
Key Default
Value Purpose HKEY_LOCAL_MACHINE\SOFTWARE\Tmurgent\
PimpVasWatch\SqlDbSvrInstance
Server name and instance for the SoftGrid Database. For example: "sgserver1\SqlExpress"
HKEY_LOCAL_MACHINE\SOFTWARE\Tmurgent\
PimpVasWatch\SqlDbName SOFTGRID Name of the database inside this instance.
HKEY_LOCAL_MACHINE\SOFTWARE\Tmurgent\
PimpVasWatch\SqlAuthType 0
Type of authentication used to contact the database. 0=Sql Authentication, 1=Windows Authentication HKEY_LOCAL_MACHINE\SOFTWARE\Tmurgent\
PimpVasWatch\SqlAuthName softricity
If SqlAuthType=0, this is the Sql User Name to use for authorization.
HKEY_LOCAL_MACHINE\SOFTWARE\Tmurgent\ PimpVasWatch\SqlPassword
If SqlAuthType=0, this is the Sql Password to use for authorization.
HKEY_LOCAL_MACHINE\SOFTWARE\Tmurgent\
PimpVasWatch\MonitorRate 1
Rate, in seconds, used to poll the PimpMonitor service when the monitoring graphs are being displayed.
HKEY_LOCAL_MACHINE\SOFTWARE\Tmurgent\
PimpVasWatch\MonitorUdpPort 8079
UDP port used for communications between the Monitor and the Console
HKEY_LOCAL_MACHINE\SOFTWARE\Tmurgent\
PimpVasWatch\HideSetupTab 0
Use Regedit to create DWORD value set to 1 to hide this tab.
HKEY_LOCAL_MACHINE\SOFTWARE\Tmurgent\
PimpVasWatch\NoSavePassword 0
Use Regedit to create DWORD value set to 1 to prevent reading/writing of SqlPassword field to registry.
The default setting for MonitorRate will provide you with the most instantaneous display in the Monitor Tab. You can reduce impact on VAS servers by increasing this interval in the registry. It is unwise to set this value lower than the setting used in the PimpMonitor.
The MonitorUdpPort field default matches the default used on the PimpMonitor service. This port is used for UDP communication between these components and must be conistently configured.
The HideSetupTab registry setting, when set to 1, will disable display of the Setup Tab. This is appropriate to prevent accidental modifications to the setup, once properly configured. If set, you may delete this keyname or change the value to 0 to restore the tab display the next time PimpVasWatch is started.
The NoSavePassword registry setting, when set to 1, will disable saving of the database access password. This only affects a configuration using Sql Authentication. With this setting set to 1, the user will need to type in the Sql password for database access on the setup tab each time PimpVasWatch is launched.
Note: PimpVasWatch uses the SoftGrid Database to discover Virtual Application Servers to watch. Typically, this database contains only information on the "Traditional" and "Heavy Weight" Virtual Application Servers. It contains no information about the new server for 4.5 that is used for Branch Offices, called the "Light Weight" or "Streaming" Server.
You may use the SoftGrid Management Console to add a second Server Group to the database, then add all Light Weight Servers to this group. This information would remain unused as the Management Servers do not interact with any of the Virtual Application Servers. Likewise, the "Light Weight" servers do not contact the database. Thus adding these servers to the database will have no effect, except making them discoverable to PimpVasWatch.
3.3 Overrides for PimpMy for SoftGrid Management Pack
This Management Pack is designed to provide you many management capabilities. Most customers will not want to use the default settings and will use what Operations Manager calls
“overrides” to make the modifications. We shall not attempt to document how to configure overrides in Operations Manager here; please refer to the Microsoft Documentation.
In general, the pack provides for discovery, monitoring, and rules for managed SoftGrid components, plus monitoring views. Overrides are appropriate for the rules and monitors objects. Customization is appropriate for the monitoring views. So Pimp your PimpMy for SoftGrid Management Pack.
4. Using the Package
We hope that the user interface portions of the package are self-explanatory. This section primarily serves to provide backup material on the product, should questions arise.
4.1 Interfacing with PimpMonitor
PimpMonitor contains two interfaces. These interfaces are used by PimpVasWatch, the PimpMy for SoftGrid Management Pack, and other third party management tools.
The first interface (used by PimpVasWatch) is a binary message passing interface that uses a UDP/IP socket. Documentation of this private interface is available to third party vendors. The second interface is a WMI interface (used by the PimpMy for SoftGrid Management Pack). PimpMonitor contains a decoupled WMI Provider, and implements a published MOF interface under the “root\tmurgent” namespace. You can find the MOF file that defines this interface. The WMI implementation supports gets and queries only.
4.2 Using PimpVasWatch
Monitor Tab
Click on the button to query the SoftGrid database for a list of servers and begin polling the PimpMonitor service on each server. Results of these queries are displayed in a series of graphs, one for each server (See Figure 2 on page 15). When you are through monitoring you may exit the program or click on the button to stop polling. If you start polling and visit another tab this polling will continue and the results will be visible when you return to the Monitor Tab. Polling is performed for each server at a rate set in the registry (default 1 second) and 90 intervals of data are displayed on the graphs. The six graphs display the following data:
Sys CPU %: Displays CPU utilization for the entire server.
VAS CPU%: Displays CPU utilization for only the VAS service (dispatcher and core processes)
Sys Memory %: Displays the percentage of installed RAM in use/available for the system as a whole.
VAS Memory %: Displays the percentage of installed RAM in use by the VAS service (dispatcher and core processes).
Sys TX (B/s): Displays the amount of IO transmissions (file and network) from the system in Bytes per Second.
VAS TX (B/s): Displays the amount of IO transmissions (file and network) from the VAS service elements (dispatcher and core processes) in Bytes per Second.
Note that the last four graphs of each server auto-scale so that the graphs fit into the space available. The current range is displayed on the vertical axis of the graph. You may place the mouse over a graph for a tooltip that explains the minimum, maximum, average, and latest values in the displayed graph, as well as the current range used for display. Placing the mouse over the server name just above the graph will give you a tooltip that shows the long-term CPU usage of the system and of the VAS (since service startup).
The CPU displays are showing CPU usage for a short interval (default 1 second, but this is a configurable value on the PimpMonitor). To see the percentage of CPU used by the System and by the VAS since reboot/service start, place the mouse over the server name just above the graph for this information to be displayed in a tooltip. The MEMORY displays indicate a percentage of RAM. The IO graphs show write (not read) activity. The USERS graph shows current rtsp/s connections. The USERAPPS graph shows rtp connections, which indicates the number of SFT packages opened by different client computers (not necessarily users).
You may find that you want to resize the entire application window to see all of the graphs. Resizing can be done by placing the mouse on an edge of the outer frame (or corner) and click/drag to the desired size. You may also use the slider that appears to the graphs zoom in and/or out for improved readability/visibility.
Active Clients Tab
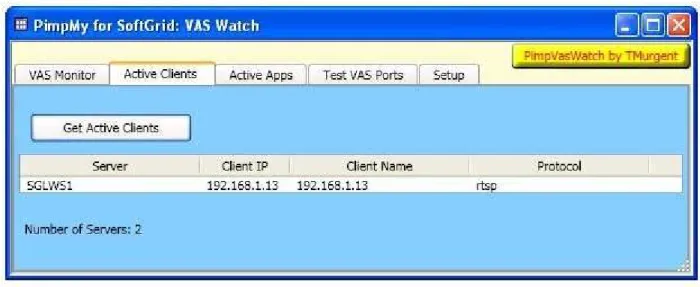
Click on the Get Active Clients button to query PimpMonitors for all VAS client user session connections. This corresponds to the USERS graph in the Monitor Tab. A table will be provided (See Figure 3) that includes the VAS Server Name, Client IP, Client Name, and which protocol (rtsp or rtsps) is being used.
Figure 3 – Active Clients Display
Like all other tables displayed in the GUI, the user can sort the table based on any column by clicking on the column header.
Active Applications Tab
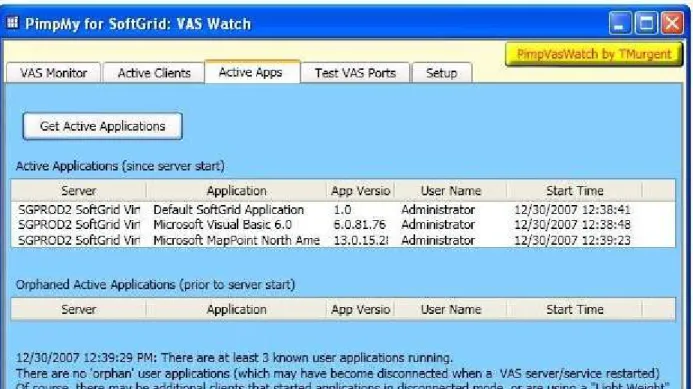
Click on the button to analyze the SoftGrid database metering logs for a list of active
applications and users. See Figure 4. Note that this is application based and thus is more detailed than the USERAPPS graph in the Monitor Tab. Two lists are provided.
The first shows user application sessions open and consuming resources on servers presently.
The second list, called the "orphaned" list, consists of user applications that were connected to the server when a VAS server (or service) was restarted. In that case, the clients would continue to run the application in a disconnected mode and the server will have no way to know when these applications terminate. and a second list of user applications .
Figure 4 – Active Applications Display
Clients that start applications in a disconnected mode, or are using a "Light Weight" Streaming Server are never recorded.
Test VAS Ports Tab
Figure 5 – Test VAS Ports Display showing configured RTSP and RTSPS ports
Then click on any line in the table to test if the port is open and responding to inquiries. (This is the equivalent to the telnet on port 554 trick to test the service). As seen in Figure 6, the result of this test is displayed below the table.
4.3 Using PimpMy for SoftGrid Management Pack
This Management Pack compliments and extends your SCOM capabilities, allowing you to better monitor your critical SoftGrid components.
Discovery
Once the management pack is imported, SCOM Discovery will be able to discover the following components:
SoftGrid Virtual Application Service PimpMonitor Service
SoftGrid Clients (Windows Desktops or Terminal Services) Service
These discoveries are associated with the appropriate service elements. Note that adding the PimpMonitor Service to a VAS increases the manageability of the VAS.
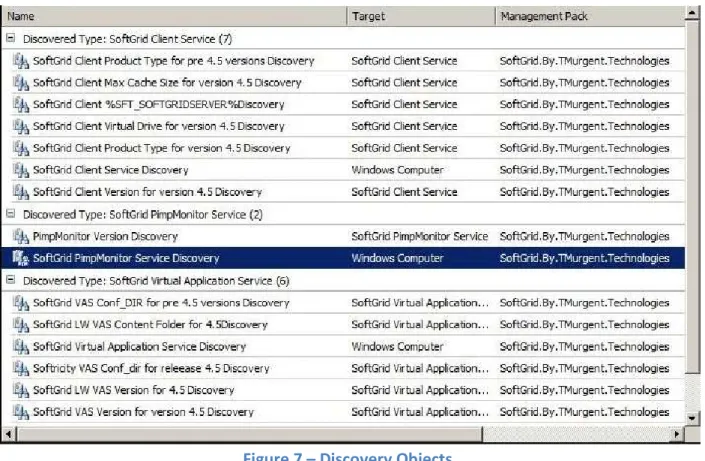
In addition to discovering the existence of these components, the discovery will also retrieve a set of parameters associated with the component. Figure 7 shows a list of package discovery parameters. These parameters are re-queried once a day, by default.
Virtual Application Service: Type and Version of the VAS service. Also discovered is the location of the “content folder”.
VAS with PimpMonitor Service: Version of the PimpMonitor Service.
SoftGrid Client Service: Type and Version of the Client. Also the configured maximum size of the sft cache, the virtual (Q:) drive letter, and an enumeration of how the client computer resolves the %SFT_SOFTGRIDSERVER% environment variable. (NOTE: A user setting would overrule this computer setting).
Discovery can either be an automatic or manual processes in SCOM, depending on how it has been configured. Upon being discovered, SCOM will install (or update) an Agent on the discovered computers which will perform tests and act as an interface to SCOM. There is nothing unusual about this process due to this Management Pack, other than it now covers discovery of these manageable components.
Monitors
Monitors are objects used to generate alerts under certain conditions. Generally, these monitors are checked on a 15-minute (900 second) period by default.
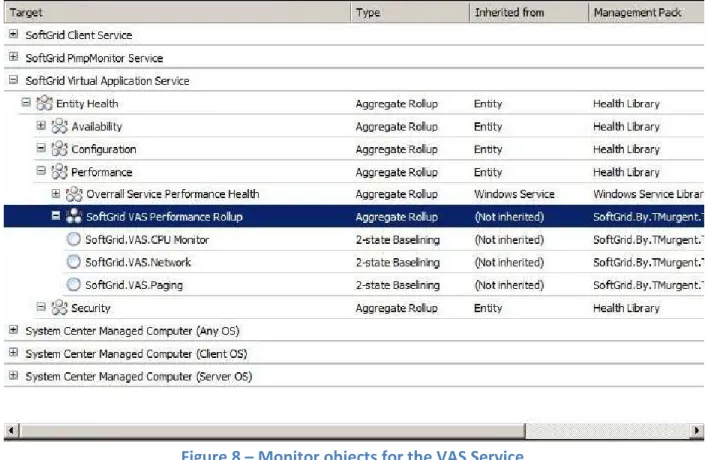
SoftGrid VAS Service: Normal Service Monitoring of the Virtual Application Service is implemented (is the service running), plus baseline style monitoring of key performance parameters. These key performance monitors are for the CPU, Network, and Paging activity. See Figure 8. Unfortunately, these counters only include the main Dispatcher of the VAS service, and do not include the Core child processes, which reduces their usefulness (this is a Microsoft limitation).
Figure 8 – Monitor objects for the VAS Service
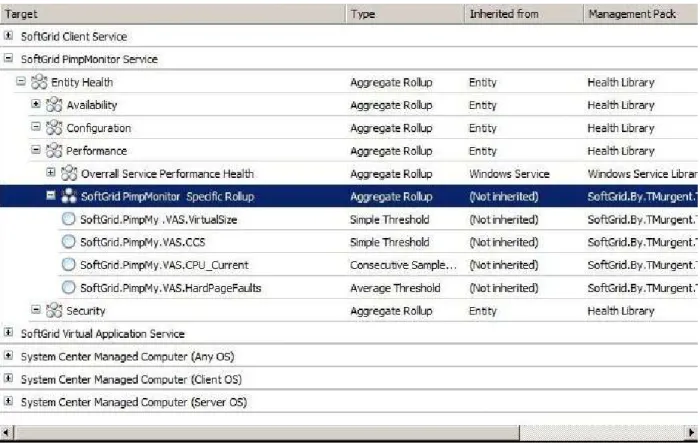
Service, the Dispatcher and Cores. CCS is the number of “Concurrent Connection Streams” and is your best tool to determine scalability of your implementation.
Figure 9 – Monitor objects for the PimpMonitor Service
SoftGrid Client Service: Normal Service Monitoring of the Client Virtual Services Agent. No additional monitors are created.
Rules
Rules are additional actions taken against objects. This Management Pack only uses Rules to obtain additional performance counters, which may be viewed in SCOM Performance Views. By default, these rules are checked on a 15-minute (900 second) interval.
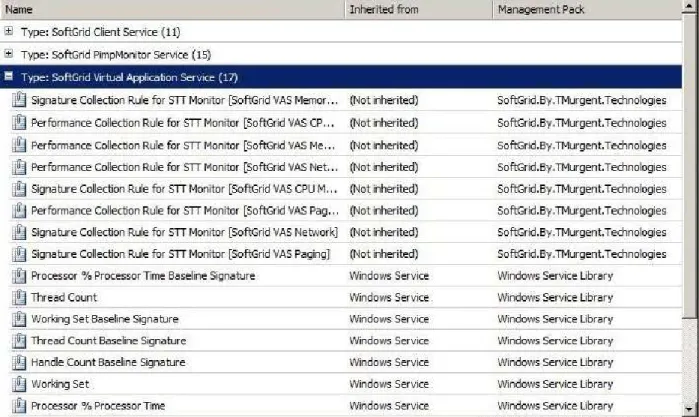
VAS Service Rules
Rules for the Virtual Application Service do not require installation of the PimpMonitor. The additional rules which are part of the Management Pack use a self-correcting baseline that compare current values against prior ranges seen previously. As in the case of VAS Monitors, these counters are only able to measure the Dispatcher process of the VAS Service. Figure 10 shows these rules plus the standard windows service rules implemented by SCOM.
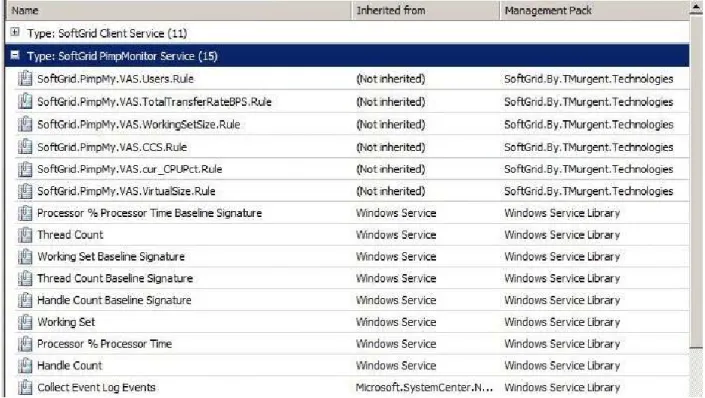
PimpMonitor Service Rules
The rules added by the Management Pack use the PimpMonitor Service to obtain information about the sum of all the VAS Service processes (Dispatcher and Cores). Please note that the standard rules that come from the Windows Service Library correspond to the PimpMonitor Service itself. These rules are shown in Figure 11
Client Rules
Shows the client rules. plus checking of the current size of the actual client sft cache. Also, any event log errors from the SoftGrid Client will trigger an SCOM Alert. These are shown in Figure 12.
Views
The Package includes a set of standard views for working with the SoftGrid components. This includes a Dashboard View, a couple of Diagram Views, State Views, and Performance Views DashBoard Views
SoftGrid DashBoard View
The package creates a prototype “Dashboard View”. This is suitable for customizing a SoftGrid Dashboard View. A Dashboard typically consists of a combination of subviews that are of the most interest. The prototype combines the Diagram and Performance views for VAS with PiimpMonitor.
Diagram Views
There are two diagram views. Diagram Views provide architectural associations between discovered components. Click on an element in a Diagram View displays the discovered parameters of the object in the bottom pane.
SoftGrid Top Level Diagram View
Figure 14 shows an example of the SoftGrid Top Level Diagram View. Discovered SoftGrid components are combined by type. In this case, there were no SoftGrid VAS servers that did not have the PimpMonitor service, so that container is not shown. Clicking on a discovered component will display the parameters associated with it in the bottom pane.
SoftGrid Diagram VAS with PimpMonitor View
An example of the SoftGrid Diagram VAS with PimpMonitor View is given in Figure 15
Figure 15 – SoftGrid Diagram VAS with PimpMonitor View
Performance Views
There are three performance views. These views are like perfmon from counter values recorded in the SCOM database.
SoftGrid Performance VAS/PimpMonitor View
SoftGrid Performance Client View
State Views
There are three state views. These views provide a rollup of the state of each discovered object.
SoftGrid State View for Clients
SoftGrid State View for VAS Monitors