About the Authors
Data Centers
Comparing Data
Center & Computer
Thermal Design
By Michael K. Patterson, Ph.D., P.E., Member ASHRAE; Robin Steinbrecher; and Steve Montgomery, Ph.D.
T
he design of cooling systems and thermal solutions for today’s data centers and computers are handled by skilled mechanical engineers using advanced tools and methods. The engi-neers work in two different areas: those who are responsible for designing cooling for computers and servers and those who design data center cooling. Unfortunately, a lack of understanding exists about each other’s methods and design goals. This can lead to non-optimal designs and problems in creating a successful, reliable, energy-efficient data processing environment.This article works to bridge this gap and provide insight into the parameters each engineer works with and the optimizations they go through. A basic understanding of each role will help their counterpart in their designs, be it a data center, or a server. Server Design Focus
Thermal architects are given a range of information to begin designing the thermal solution. They know the thermal
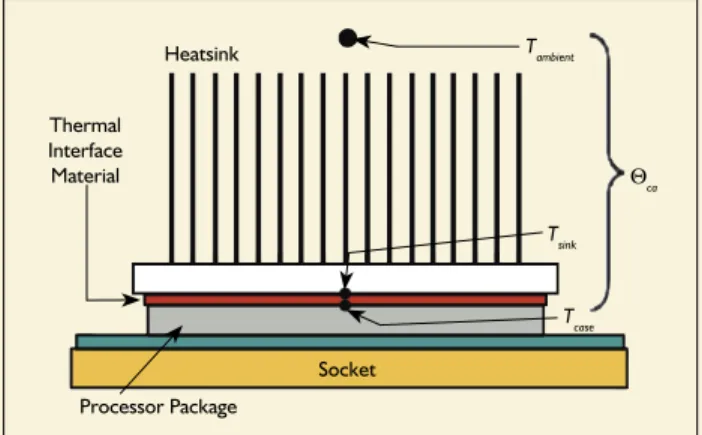
design power (TDP) and temperature specifications of each component (typi-cally junction temperature, TJ , or case temperature TC). Using a processor as an example, Figure 1 shows a typical component assembly.
The processor is specified with a maxi-mum case temperature, TC , which is used for design purposes. In this example, the design parameters are TDP = 103 W and TC = 72°C. Given an ambient temperature specification (TA) = 35°C, the required thermal resistance of this example would need to be equal to or lower than:
CA, required= (TC – TA)
/
TDP = 0.36 °C/W(1) Sometimes this value of CA is not
feasible. One option to relieve the demands of a thermal solution with a lower thermal resistance is a higher TC. Unfortunately, the trend for TC continues to decline. Reductions in TC result in higher performance, better reliability, and less power used. Those advantages
are worth obtaining, making the thermal challenge greater.
One of the first parameters discussed by the data center designer is the temperature rise for the servers, but this value is a secondary consideration, at best, in the server design. As seen by Equation 1, no consideration is given to chassis tempera-ture rise. The thermal design is driven by maintaining component temperatures within specifications. The primary param-eters being Tc, Tambient, and CA, actual.
The actual thermal resistance of the solu-tion is driven by component selecsolu-tion, ma-terial, configuration, and airflow volumes. Usually, the only time that chassis TRISE
Michael K. Patterson, Ph.D., P.E., is thermal research engineer, platform initiatives and pathfinding, at Intel’s Digital Enterprise Group in Hillsboro, Ore. Robin Steinbrecher is staff thermal architect with Intel’s Server Products Group in DuPont, Wash. Steve Montgomery, Ph.D., is senior thermal architect at Intel’s Power and Thermal Technologies Lab, Digital Enterprise Group, DuPont, Wash.
Reliability: Operational continuity is vital to the success of the data center, so server reliability receives significant focus. For the thermal solution, the items most likely to fail are air movers. These are typi-cally redundant to provide for this increased reliability. Redundancy results in oversizing of air-mover capability for normal opera-tion leading to further inefficiencies.
Acoustics: The volume of air required to cool today’s servers often creates a noise problem such that hearing protection may be required. The area of acoustics is im-portant enough to describe further.
Server Thermal Acoustic Management
As mentioned previously, the thermal engineer designing the cooling and control system must counterbalance the need to cool all components in a system with the necessity of meeting acoustics requirements. To achieve this, the server management (SM) monitors combina-tions of temperature sensors and com-ponent use to take action to maintain the
ca Socket Processor Package Thermal Interface Material Heatsink Tambient Tsink Tcase
Figure 1: Thermal resistance of typical server thermal solution.
The engineers work in two different areas: those who
are responsible for designing cooling for computers
and servers and those who design data center
cool-ing. Unfortunately, a lack of understanding exists
about each other’s methods and design goals.
is calculated is to ensure that exhaust tem-peratures stay within safety guidelines.
In addition to TDP and TC , the engineer has several other targets, including:
Cost: Servers are sold into very com-petitive markets and cost is a critical consideration. Today’s budget for thermal solutions in servers is typically in the range of $50 to $75, depending on the number of processors and features. It is desirable to minimize this cost.
Weight: Current aluminum and copper heat sinks continue to expand in size and surface area to augment heat transfer. The increased weight of the heat
sinks is a serious issue as the processor package and mother-board must be made sufficiently robust to handle the resulting mechanical load.
Volumetric: The space inside a server is extremely valuable, especially as more comput-ing power and capabilities are added. Using this space for heat sinks and fans is not adding value for the customer.
Power: The total power re-quired for servers is increasing
and driving changes to the data center infrastructure. The server fans can use up to 10% of the server power.Reducing all power is a design goal.
Many components to cool: Ideally, sizing air-movers to cool the highest power component would be sufficient to cool the remainder of the system. Unfortunately, this is rarely the case and additional fans, heat sinks, and ducting in the server often are required.
server within specifications.
Required air-mover speeds are deter-mined through calculations performed by a baseboard management controller (BMC). The SM then acts to change the air-mover speeds to ensure that the components stay within specification. Consequently, the SM normally is driving a server to be as quiet as possible while maximizing performance by keeping component temperatures within, but not over, their limits. In some instances, SM enables a customer to choose perfor-mance over acoustics. In these cases, air movers are driven to levels to achieve the highest thermal performance prioritized over acoustics.
Acoustics specifications for computing equipment are speci-fied at ambient temperatures, typically 23°C ± 2°C (73°C ± 4°C). Above this range, it is de-sirable, but not required, to have a quiet system. As a result, some systems attempt to maintain the quietest possible operation as a competitive advantage. Others sacrifice acoustics to reduce cost through the elimination of elaborate SM systems. The data center designer must under-stand, as a result of these SM schemes, required airflow through a system is greatly reduced when room temperatures, or more specifically server inlet air temperatures, are held below 25°C (77°F). The tempera-ture rise through a system may be relatively high as a result of that lower airflow.
Typical systems are designed to deliver about 60% to 70% of their maximum flow in this lower inlet temperature
environ-ment. Monitoring of temperature sensors is accomplished via on-die thermal diodes or discrete thermal sensors mounted on the printed circuit boards (PCBs). Component utilization monitoring is accomplished through activity measurement (e.g., memory throughput measurement by the chipset) or power measurement of individual voltage regulators. Either of these methods results in calculation of component or subsystem power.
Data Center Design Focus
The data center designer faces a similar list of criteria for the design of the center, starting with a set of requirements that drive the design. These include:
Cost: The owner will have a set budget and the designer must create a system within the cost limits. Capital dollars are the primary metric. However, good designs also consider the operational cost of running the system needed to cool the data center. Combined, these comprise the total cost of ownership (TCO) for the cooling systems.
Equipment list: The most detailed information would include a list of equipment in the space and how it will be racked together. This allows for a determination of total cooling load in the space, and the airflow volume and distribution in the space.
Caution must be taken if the equipment list is used to develop the cooling load by summing up the total connected load. This leads to over-design. The connected load or maximum rating of the power supply is always greater than the maximum heat dis-sipation possible by the sum of the components. Obtaining the thermal load generated by the equipment from the supplier is the only accurate way of determining the cooling requirements.
Unfortunately, the equipment list is not always available, and the designer will be given only a cooling load per unit area and will need to design the systems based upon this information. Sizing the cooling plant is straightforward when the total load is known, but the design of the air-handling system is not as simple.
Performance: The owner will define the ultimate perfor-mance of the space, generally given in terms of ambient tem-perature and relative humidity. Beaty and Davidson2 discusses
typical values of the space conditions and how these relate to classes of data centers. Performance also includes values for airflow distribution, total cooling, and percent outdoor air.
Reliability: The cooling system’s reliability level is defined and factored into equipment selection and layout of distribu-tion systems. The reliability of the data center cooling system requires an economic evaluation comparing the cost of the reliability vs. the cost of the potential interruptions to center operations. The servers protect themselves in the event of cool-ing failure. The reliability of the coolcool-ing system should not be justified based upon equipment protection.
Data Center Background
Experience in data center layout and configuration is helpful to the understanding of the design issues. Consider two cases at the limits of data center arrangement and cooling configuration:
1. A single rack in a room, and
2. A fully populated room, with racks side by side in mul-tiple rows.
Case 2 assumes a hot-aisle/cold-aisle rack configuration, where the cold aisle is the server airflow inlet side containing the perforated tiles. The hot aisle is the back-to-back server outlets, discharging the warm air into the room. The hot aisle/cold aisle is the most prevalent configuration as the arrangement prevents mixing of inlet cooling and warm return air. The most common airflow configuration of individual servers is front-to-back, working directly with the hot-aisle/cold-aisle concept, but it is not the only configuration.
Consider the rack of servers in a data processing environment. Typically, these racks are 42U high, where 1U = 44.5 mm (1.75 in.) A “U” is a commonly used unit to define the height of electronics gear that can be rack mounted. The subject rack could hold 42 1U servers, or 10 4U servers, or other combinations of equipment, including power supplies, network hardware, and/or storage equip-ment. To consider the two limits, first take the described rack and place it by itself in a reasonably sized space with some cooling in place. The other limit occurs when this rack of equipment is placed in a data center where the rack is one of many similar racks in an aisle. The data center would have multiple aisles, generally configured front-to-front and back-to-back.
Common Misconceptions
A review of misconceptions illustrates the problems and chal-lenges facing designers of data centers. During a recent design review of a data center cooling system, one of the engineers claimed that the servers were designed for a 20°C (36°F) TRISE, inlet to outlet air temperature. This is not the case. It is possible that there are servers that, when driven at a given airflow and dissipating their nominal amount of power, may generate a 20°C (36°F) T, but none were ever designed with that in mind.
Recall the parameters that were discussed in the section on server design. Reducing CA can be accomplished by increasing airflow.
However, this also has a negative effect. More powerful air mov-ers increase cost, use more space, are louder, and consume more energy. Increasing airflow beyond the minimum required is not a desirable tactic. In fact, reducing the airflow as much as possible would be of benefit in the overall server design. However, nowhere in that optimization problem is T across the server considered.
Assuming a simple TRISE leads to another set of problems. This implies a fixed airflow rate. As discussed earlier, most servers mon-itor temperature at different locations in the system and modulate airflow to keep the components within desired temperature limits. For example, a server in a well designed data center, particularly if located low in the rack, will likely see a TA of 20°C (68°F) or less. However, the thermal solution in the server is normally designed to handle a TA of 35°C (95°F). If the inlet temperature is at the lower value, the case temperature will be lower. Then, much less airflow is required, and if variable flow capability is built into the server, it will run quieter and consume less power. The server airflow
Figure 2: The work cell is shown in orange.
(and hence TRISE ) will vary between the TA = 20°C (68°F) and 35°C (95°F) cases, a variation described in ASHRAE’s Thermal Guideline for Data Processing Environments. The publication provides a detailed discussion of what data should be reported by the server manufacturer and in which configuration.
Another misconception is that the airflow in the server exhaust must be maintained below the server ambient environmental specification. The outlet temperature of the server does not need to be below the allowed value for the
environment (typically 35°C [95°F]). Design Decisions
To understand the problems that can arise if the server design process is not fully understood, revisit the two cases introduced earlier. Consider the fully loaded rack in a space with no other equipment. If sufficient cooling is available in the room, the server thermal requirements likely will be satisfied. The servers will pull the required amount of air to cool them,
primarily from the raised floor distribution, but if needed, from the sides and above the server as well. It is reasonable to assume the room is well mixed by the server and room distribution airflow. There likely will be some variation of inlet temperature from the bottom of the rack to the top but if sufficient space exists around the servers it is most likely not a concern. In this situation, not having the detailed server thermal report, as described in Refer-ence 3, may not be problematic.
At the other limit, a rack is placed in a space that is fully popu-lated with other server racks in a row. Another row sits across the cold aisle facing this row as well as another sitting back-to-back on the hot-aisle side. The space covered by the single rack unit and its associated cold-aisle and hot-aisle floor space often is called a work cell and generally covers a 1.5 m2 (16 ft2) area. The 0.6 m
× 0.6 m (2 ft × 2 ft) perforated tile in the front, the area covered by the rack (~0.6 m × 1.3 m [~ 2 ft × 4.25 ft]) and the remaining uncovered solid floor tile in the hot-aisle side.
Consider the airflow in and around the work cell. Each work cell needs to be able to exist as a stand-alone thermal zone. The airflow provided to the zone comes from the perforated tile, travels through the servers, and exhausts out the top-back of the work cell where the hot aisle returns the warm air to the inlet of the room air handlers. The work cell cannot bring air into the front of the servers from the side as this would be removing air from another work cell and shorting that zone. No air should come in from the top either as that will bring air at a temperature well above the desired ambient and possibly above the specification value for TA (typically 35°C [95°F]). Based on this concept of the work cell it is clear that designers must know the airflow through the servers or else they will not be able to adequately size the flow rate per floor tile. Conversely,
if the airflow is not adequate, the server airflow will recirculate, causing problems for servers being fed the warmer air.
If the design basis of the data center includes the airflow rates of the servers, certain design decisions are needed. First, the design must provide enough total cooling capacity for the peak, matching the central plant to the load.
Another question is at what temperature to deliver the sup-ply air. Lowering this temperature can reduce the required fan
size in the room cooling unit but also can be problematic, as the system, particularly in a high density data center, must provide the minimum (or nominal) airflow to all of the work cells. A variant of this strategy is that of increasing the T. Doing this al-lows a lower airflow rate to give the same total cooling capability. This will yield lower capital costs but if the airflow rate is too low, increasing the T will cause recirculation. Also, if the temperature is too low, comfort and ergonomic issues could arise. If the supplier has provided the right data, another decision must be made. Should the system provide enough for the peak airflow, or just the typical? The peak airflow rate will occur when TA = 35°C (95°F) and the typical when TA = 20 ~ 25°C (68°F ~ 77°F). Sizing the air-distribution equipment at the peak flow will result in a robust design with flexibility, but at a high cost. Another complication in sizing for the peak flow, particularly in dense data centers, is that it may prove difficult to move this airflow through the raised floor tiles, causing an imbalance or increased leakage elsewhere. Care must be taken to ensure the raised floor is of suf-ficient height and an appropriate design for the higher airflows.
If the nominal airflow rate is used as the design point, the design, installation, and operation (including floor tile selection for balancing the distribution) must be correct for the proper operation of the data center, but a cost savings potential exists. It is essential to perform some level of modeling to determine the right airflow. In this design, any time the servers ramp up to their peak airflow rate, the racks will be recirculating warm air from the hot aisle to feed some server inlets.
This occurs because the work cell has to satisfy its own airflow needs (because its neighbors are also short of airflow) and, if the servers need more air, they will receive it by recirculat-ing. Another way to visualize this is to consider the “walls of symmetry” around each work cell and recall that there is no flux across a symmetry boundary. The servers are designed to operate successfully at 35°C (95°F) inlet air temperatures so if the prevalence of this recirculation is not too great, the design should be successful.
If the detailed equipment list is unknown when the data center is being designed, the airflow may be chosen based on historical airflows for similarly loaded racks in data centers of the same
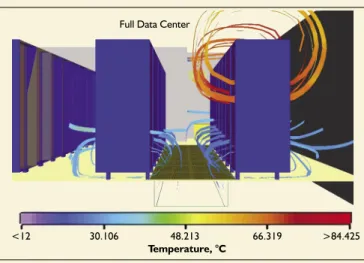
Full Data Center
<12 30.106 48.213 66.319 >84.425
Temperature, °C
Figure 3: Rack recirculation problem.
load and use patterns. It is important to ensure the owner is aware of the airflow assumptions made and any limits that the assumptions would place on equipment selection, particularly in light of the trend towards higher power density equipment. The airflow balancing and verification would then fall to a com-missioning agent or the actual space owner. In either case, the airflow assumptions need to be made clear during the computer equipment installation and floor tile set up.
Discussions with a leading facility engineering company in Europe provide an insight to an alternate design methodology when the equipment list is not available. A German engineering society standard on data center design requires a fixed value of 28°C at 1.8 m (82°F at 6 ft) above the raised floor. This includes the hot aisle and ensures that
if sufficient airflow is provided to the room, all servers will be maintained below the up-per temup-perature limits even if recirculation occurs.
Using this approach, it is reasonable to calculate the total airflow in a new design by assuming an inlet tempera-ture of 20°C (68°F) (low end of Thermal Guidelines) and a discharge temperature of 35°C (95°F) (maximum inlet temperature that should be fed to a server through
recircula-tion) and the total cooling load of the room. A detailed design of the distribution still is required to ensure adequate airflow at all server cold aisles.
The Solution
The link for information and what is needed for successful design is well defined in Thermal Guidelines. Unfortunately, it is only now becoming part of server manufacturers’ vocabulary. The data center designer needs average and peak heat loads and airflows from the equipment. The best option is to obtain the information from the supplier. While testing is possible, particularly if the owner already has a data center with similar equipment, this is not a straightforward process as the server inlet temperatures and workload can affect the airflow rate. Thermal Guidelines provides information about airflow mea-surement techniques.
The methodology of the German standard also can be used, recognizing recirculation as a potential reality of the design and ensuring discharge temperatures are low enough to support continued computer operation. Finally, the worst but all-too-common way is to use a historical value for T and calculate a cfm/kW based on the historical value.
In any case, the total heat load of the room and the airflow need to be carefully considered to ensure a successful design.
Effecting Change
The use of Thermal Guidelines has not been adopted yet by all server manufacturers. The level of thermal information provided from the same manufacturer can even vary from product to product. During a recent specification review of several different servers, one company provided extensive airflow information, both nominal and peak, for their 1U server but gave no information on airflow for their 4U server in the same product line.
If data center operators and designers could convince their information technology sourcing managers to only buy servers that follow Thermal Guidelines (providing the needed infor-mation) the situation would rectify itself quickly. Obviously,
that is not likely to happen, nor should it. On the other hand, those who “own” the problem of making the data center cooling work would help themselves by pointing out to the procurement deci-sion-makers that they can have only a high degree of confidence in their data center designs for those servers that adhere to the new publication. As more customers ask for the information, more equipment suppliers will provide it. Summary
The information discussed here is intended to assist data center designers in understanding the process by which the thermal solution in the server is developed. Conversely, the server thermal architect can benefit from an understanding of the challenges in building a high density data center. Over time, equipment manufacturers will continue to make better use of Thermal Guidelines, which ultimately will allow more servers to be used in the data centers with better use of this expensive and scarce space.
References
1. Processor Spec Finder, Intel Xeon Processors. http://processor-finder.intel.com/scripts/details.asp?sSpec=SL7PH&ProcFam=528& PkgType=ALL&SysBusSpd=ALL&CorSpd=ALL.
2. Beaty, D. and T. Davidson. 2003 “New guideline for data center cooling.” ASHRAE Journal 45(12):28–34.
3. TC 9.9. 2004. Thermal Guidelines for Data Processing
Environ-ments. ASHRAE Special Publications.
4. Koplin, E.C. 2003. “Data center cooling.” ASHRAE Journal 45(3):46–53.
5. Rouhana, H. 2004. Personal communication. Mechanical Engi-neer, M+W Zander Mission Critical Facilities, Stuttgart, Germany, November 30.
6. Verein Deutscher Ingenieure, VDI 2054. 1994.
Raumlufttech-nische Anlagen für Datenverarbeitung September.