Experimental study on the influence of background music
on pedestrian movement in high densities
Guang Zeng
1,2, Andreas Schadschneider
2, Jun Zhang
1, Weiguo Song
11State Key Laboratory of Fire Science, University of Science and Technology of China
Jinzhai Road 96, Baohe district, Hefei 230027, China
2Theoretical Physics Institution, University of Cologne
ZuelpicherStrasse 77,Cologne50937, Germany [email protected]; [email protected];
[email protected]; [email protected]
Abstract: It is interesting to investigate the effect of background music on pedestrian movement. This paper investigates the properties of crowd motion with external rhythms. With rhythm, pedestrians stop more frequently than without any rhythm. The stopping also increases with the increment of the tempo. Velocity and flow with rhythms are lower than that without any rhythm at high densities due to the more frequent stopping. Stepping behavior analysis shows that the step frequency with rhythms is smaller than that without any rhythm, especially at high densities. Dynamic coordinated behavior is weakened by music, which also affectsthe stepping behavior. Our study will be helpful for understanding the effect of background music on pedestrian movement.
Keyword:background music; stop-and-go; fundamental diagrams; stepping behavior
1.Introduction
Although crowding is often observed especially in large cities, it is still not clear how to control crowd motion effectively. Yanagisawa et al.[1]found that a rhythm below the normal step frequency can improve pedestrian flow if pedestrians are instructed to follow the rhythm. Therefore it is interesting to investigate the influence of rhythm on pedestrian motion in more detail, e.g. the effect of rhythm without explicit instructions or of background music.
focus on the effect of differentrhythms(different tempos) on pedestrian dynamics. A series of single-file experiments, six experiments with six different rhythms and one without any rhythms, are conducted to study pedestrian movement influenced by different rhythms. These rhythms include 90BPM, 120BPM and 150BPM rhythms from a pure music of a song called “Fade” and 90BPM, 120BPM and 150BPM rhythms produced by electronic metronome.
Single-file experiments, in which pedestrians are only influenced by the purely longitudinal interactions, are commonly used to study pedestrian dynamics. Seyfried et al.[7]studied the fundamental diagram and explained the linear relation between headway and velocityin the view of stepping. Jelic et al.[8]carried out a single-file experiment in a circle corridor and found there are three different regimes in the relation between headway and velocity. Cao et al.[9] found three different regimes of the relation in mixed age group, but only two in young group by analyzing pedestrian movement.
The reminder of the paper is organized as follows: in the second part, the experiment setup will be introduced in detail. The results of the experiment and the analysis will be presented in the third part. At last, the paper will be summarized with a conclusion.
2.Experiment setup
3 Results and analysis
To analyze the data, the 2D coordinate is transformed into a 1D coordinate in Fig.1. The origin 0 of the 1D coordinate is at the center of the starting line of the straight corridor. The maximum length of the coordinate is 21.93m. The coordinate below will be described with the 1D coordinate, if there is no special explanation.To compare the results with different rhythms, only the data in the steady state were analyzed.
Instantaneous velocity is the average velocityin a short time interval.A Voronoi headway is defined as half of the distance between the centers of his following pedestrian and followed pedestrian. Local density is the inverse of the Voronoi headway. They can be calculated as Equation 1. Fundamental diagrams are measured in the measurement area(11.67m,15.27m) which is shown in Fig.1. Macroscopically, Density and velocity in the measurement area are calculated as Equation 2.
ρ(X, t) = 𝑋𝑋𝑖𝑖+1(𝑡𝑡1)−𝑋𝑋𝑖𝑖(𝑡𝑡) 2
,v(X, t) =𝑋𝑋𝑖𝑖�𝑡𝑡+∆𝑡𝑡2�−𝑋𝑋𝑖𝑖(𝑡𝑡−∆𝑡𝑡2)
∆𝑡𝑡 (1)
ρ(t) =∫ 𝜌𝜌(𝑋𝑋𝑙𝑙,𝑡𝑡)𝑑𝑑𝑋𝑋
𝑚𝑚 , v(t) =
∫ 𝑣𝑣(𝑋𝑋,𝑡𝑡)𝑑𝑑𝑋𝑋
𝑙𝑙𝑚𝑚 (2)
Here ρ(X, t), v(X, t), ρ(t) and v(t) represent local density, instantaneous velocity, average density and average velocity, respectively. Xi(t) is the 1D coordinate of pedestrian i at time t. Δt is a time
interval chosen here as 0.4 s.lmrepresents the length of the measurement area.
3.1 Time-space diagram
Time-space diagram can show characteristics of pedestrian movement. To make it more clearly, we define moving and stopping here. When instantaneous velocity of a pedestrian is beyond 0.1m/s, the pedestrian is regarded as moving, otherwise, he is stopping. Time-space diagrams at high densities(1.37 ped/m and 1.82 ped/m) are shown in Fig. 2, where the red and blue line represent the moving and stopping state, respectively. We can find that stop-and-go starts to appear apparently when the density is 1.82 ped/m(corresponding to the runs with 40 pedestrians) with and without rhythms.However, it is obvious that pedestrians stop more frequently under rhythm conditions.
(c) Music90-30 (d) Music90-40
(f) Music120-30 (g) Music120-40
(h) Music150-30 (i) Music150-40
Fig.2: Time-space diagrams for high densities. The red and blue line represent moving and stopping, respectively. Normal-30 represents the run of 30 pedestrians without any rhythm. Music90-30 means the run of 30 pedestrians with rhythm of 90BPM.
rhythm ishigher than that with 90BPM rhythm. With rhythms, pedestrians stop longer and the stopping duration increases with the tempo.
(a) Normal-Music90 (b) Normal-Music120
(c) Normal-Music150
Fig.3:Distribution of stopping duration with rhythms and the normal condition. The inset shows the part of distribution longer than 0.4s.
Stopping headway and restarting headway are defined to analyze the reason for this behavior in more detail. The headway is the distance between the centers of a pedestrian and the frontal pedestrian. Stopping headway is the headway at the frame when pedestrians start to stop. Restarting headway is the headway at the frame when pedestrians start to move again. It shows that pedestrians startto stop at a bigger headway (F-test, P<0.001) with rhythms.They also start to move after stopping at a bigger headway (F-test, P<0.001) in Table 1. It is the reason for pedestrians stopping more frequently with rhythms and the longer stopping duration. The restarting headway with 90BPM rhythm is bigger than that without any rhythm, but less than that with higher tempo rhythms. This may explain the stopping duration increases with the increment of the tempo.
Table 1: Stopping headway and restarting headway with rhythms and without any rhythms
Condition Stopping headway(m) Restarting headway(m)
Normal 0.50±0.11 0.53±0.11
Music-90 0.51±0.10 0.54±0.10
Music-120 0.51±0.11 0.55±0.11
Music-150 0.51±0.11 0.56±0.12
In this section, we will focus on the fundamental diagrams. The tendency of fundamental diagrams with rhythms and without any rhythms are similar(Fig.4). However, we can also find that velocity and flow with rhythms are lower than that without any rhythm at high densities. To make it more clearly, binning procedures[8, 9] are made by dividing density into intervals per 0.1/m from 0/m in Fig.6. Mean value and standard deviation in every interval are calculated. It shows that velocity and flow with rhythms are smaller than that without any rhythmat high densities. With rhythms, velocity and flow with 120BPM rhythm are less than that with other rhythms in high densities. Compared to mean value of velocity(per 0.1/m) at high densities(from 1.5/m to 2.1/m), it decreases 15%, 42% and 21% on average with 90BPM, 120BPM and 150BPM, respectively. The increase of stopping results in the decrease of velocity and flow at high densities.
(a) Normal-Music (b) Normal-Music Fig.4: Fundamental diagrams with rhythms and without any rhythms
(a) Normal-Music90 (b) Normal-Music90 Fig.5: Binning procedures fundamental diagrams with rhythms and without any rhythm.
3.3 Stepping behavior
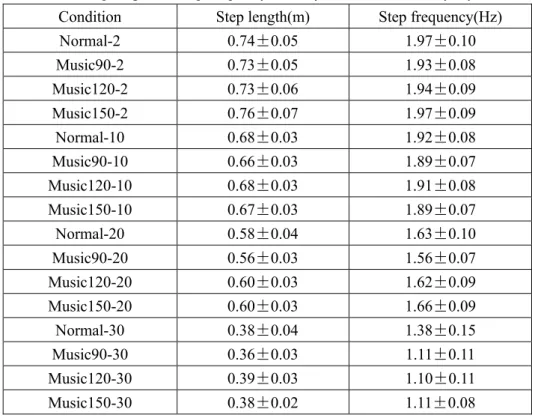
Stepping is the fundamental property of pedestrians. It can be used to explain the macroscopic properties, such as the fundamental diagram. Eight or ten pedestrians were selected to count the number of steps ofeach round for runs with 2, 10, 20 and 30 pedestrians with the videos of experiments.The step is roughly defined as the process of one foot touching the ground to the other touching the ground. Step length (sl) and step frequency (sf) are calculated as Equation 3.
𝑠𝑠𝑠𝑠=𝑆𝑆𝑆𝑆L , 𝑠𝑠𝑠𝑠=𝑆𝑆𝑆𝑆𝑇𝑇 (3)
0 0.4 0.8 1.2 1.6 2 2.4
0 0.5 1 1.5 2 2.5 Density (1/m) Ve lo ci ty ( m /s ) Normal Music90 Music120 Music150
0 0.4 0.8 1.2 1.6 2 2.4
0 0.2 0.4 0.6 0.8 1 1.2 Density (1/m) F lo w ( 1/ s) Normal Music90 Music120 Music150
0 0.4 0.8 1.2 1.6 2 2.4
0 0.2 0.4 0.6 0.8 1 1.2 1.4 1.6 Density (1/m) Ve lo ci ty ( m /s ) Normal Music90 Music120 Music150
0 0.4 0.8 1.2 1.6 2 2.4
the time for these steps.
The results for step length and step frequency with rhythms and without any rhythms are shown in Table 2. It indicates that the step frequency with rhythms is slightlyless than that without any rhythms except for that of the run with 20 pedestrians with 150BPM rhythm at low and medium densities. At high densities, the step frequencywith rhythms decreases a lot compared to that without any rhythms. Lang et al.[11] found that music will weaken dynamic coordinated behavior, which results in finishing successive behavior with more time. Therefore, it can be explained that pedestrians need more time to step in the presence of music, especially at high densities.
Table 2: Step length and step frequency with rhythms and without any rhythms
Condition Step length(m) Step frequency(Hz)
Normal-2 0.74±0.05 1.97±0.10
Music90-2 0.73±0.05 1.93±0.08
Music120-2 0.73±0.06 1.94±0.09
Music150-2 0.76±0.07 1.97±0.09
Normal-10 0.68±0.03 1.92±0.08
Music90-10 0.66±0.03 1.89±0.07
Music120-10 0.68±0.03 1.91±0.08
Music150-10 0.67±0.03 1.89±0.07
Normal-20 0.58±0.04 1.63±0.10
Music90-20 0.56±0.03 1.56±0.07
Music120-20 0.60±0.03 1.62±0.09
Music150-20 0.60±0.03 1.66±0.09
Normal-30 0.38±0.04 1.38±0.15
Music90-30 0.36±0.03 1.11±0.11
Music120-30 0.39±0.03 1.10±0.11
Music150-30 0.38±0.02 1.11±0.08
4. Conclusion
To study the effect of background music on pedestrian movement, we conducted a series of single-file experiments. The trajectories were extracted by PeTrack[12]. With the trajectories, time-space diagrams and fundamental diagrams are analyzed.
Stop-and-go behavior appears apparently at global density 1.82/mwith rhythms and without any rhythm. However, compared with pedestrian movement without any rhythm pedestrians stop more frequently with rhythms.Stopping durationwill also be longer with rhythms andincreases with the increment of the tempo.
With rhythms and without any rhythm, there is a similar tendency in fundamental diagrams. However, velocity and flow with rhythms are lower than that without any rhythms. The mean value of velocity(per 0.1/m) from 1.5/m to 2.1/m decrease 15%, 42%, and 21% on averagefor 90BPM, 120BPM and 150BPM rhythm, respectively. Stopping contributes to the decreasing of velocity and flow.
frontal pedestrians. Coupled with them, step frequency will decrease more quickly, which contributes to the sharp decrease ofvelocity and flow at high densities. When the step frequency cannot decrease any more, pedestrians will stop. This may explain that the stopping headway with rhythms is higher than that without any rhythms. The effect of rhythms will increase with the increment of tempo.
In the future, the stepping behavior needs to be investigated, which will be helpful for understanding the effect of background music more clearly.
Acknowledgement
The authors acknowledge the foundation support from Key Research and Development Program(2016YFC0802500), German Science Foundation (grant SCHA 636/9-1), the National Natural Science Foundation of China (Grant No. 71704168), the Anhui Provincial Natural Science Foundation (Grant No. 1808085MG217) and the Fundamental Research Funds for the Central Universities (Grant No. WK2320000040)and the China Scholarship Council(CSC).
Reference
[1] D. Yanagisawa, A. Tomoeda, and K. Nishinari, "Improvement of pedestrian flow by slow
rhythm," Phys Rev E Stat Nonlin Soft Matter Phys, vol. 85, p. 016111, 2012.
[2] F. Styns, L. van Noorden, D. Moelants, and M. Leman, "Walking on music," Hum Mov Sci,
vol. 26, pp. 769-85, 2007.
[3] S. Ikeda, T. Nozawa, R. Yokoyama, A. Miyazaki, Y. Sasaki, K. Sakaki, et al., "Steady Beat
Sound Facilitates both Coordinated Group Walking and Inter-Subject Neural Synchrony,"
Front Hum Neurosci, vol. 11, p. 147, 2017.
[4] M. Franek, L. van Noorden, and L. Rezny, "Tempo and walking speed with music in the urban
context," Front Psychol, vol. 5, p. 1361, 2014.
[5] C. Mendonca, M. Oliveira, L. Fontes, and J. Santos, "The effect of instruction to synchronize
over step frequency while walking with auditory cues on a treadmill," Hum Mov Sci, vol. 33, pp. 33-42, 2014.
[6] E. Sejdic, B. Findlay, C. Merey, and T. Chau, "The effects of listening to music or viewing
television on human gait," Comput Biol Med, vol. 43, pp. 1497-501, 2013.
[7] A. Seyfried, B. Steffen, W. Klingsch, and M. Boltes, "The fundamental diagram of pedestrian
movement revisited," Journal of Statistical Mechanics: Theory and Experiment, vol. 2005, pp. P10002-P10002, 2005.
[8] A. Jelic, C. Appert-Rolland, S. Lemercier, and J. Pettre, "Properties of pedestrians walking in line: fundamental diagrams," Phys Rev E Stat Nonlin Soft Matter Phys, vol. 85, p. 036111, 2012.
[9] S. Cao, J. Zhang, D. Salden, J. Ma, C. Shi, and R. Zhang, "Pedestrian dynamics in single-file
movement of crowd with different age compositions," Phys Rev E, vol. 94, p. 012312, 2016.
[10] G. Zeng, A. Schadschneider, J. Zhang, S. Wei, W. Song, and R. Ba,"Experimental study on the
effect of background music on pedestrian movement at high density," Physics Letters A.
[11] M. Lang, D. J. Shaw, P. Reddish, S. Wallot, P. Mitkidis, and D. Xygalatas, "Lost in the
Rhythm: Effects of Rhythm on Subsequent Interpersonal Coordination," Cogn Sci, vol. 40, pp. 1797-1815, 2016.