Maynart Sukharomana, M.D.*, Chantacha Sitticharoon, M.D., Ph.D.*, Supitcha Patjamontri, M.D.**, Pornpimol Kiattisakthavee, B.Sc.**, Praewvarin Weerakulwattana, M.Sc.**, Yue Qi, M.D., Ph.D.***, Supawadee Likitmaskul, M.D.**
*Department of Physiology, **Department of Pediatrics, Faculty of Medicine Siriraj Hospital, Mahidol University, Bangkok 10700, Thailand, ***Neuroscience Division, Garvan Institute of Medical Research, St Vincent’s Hospital, Sydney, NSW, Australia.
Insulin Sensitivity and Clinical Profiles in CPP Girls
Compared to Controls
Correspondence to: Chantacha Sitticharoon E-mail: [email protected]
Received 30 August 2017 Revised 22 December 2017 Accepted 25 December 2017 doi:10.14456/smj.2018.19
ABSTRACT
Objective: This study aimed to compare obesity, insulin sensitivity, clinical, and metabolic parameters between CPP and age-matched control girls, with or without obese girls and to determine correlations between these factors. Methods: CPP and control girls were recruited and were allocated into obese and non-obese groups. There were 3 groups of comparison including non-obese control girls (n=29), non-obese CPP girls (n=20), and obese CPP girls (n=6), because obese controls could not be recruited.
Results: Body mass index (BMI), body weight, and height percentiles were higher in obese CPP and non-obese CPP girls compared to control girls. Lipid profiles, glucose, insulin, the homeostasis model assessment-estimated insulin resistance (HOMA-IR), and the quantitative insulin sensitivity check index (QUICKI) were not different between all groups. Insulin and the HOMA-IR were positively but the QUICKI was negatively correlated with metabolic and anthropometric parameters mainly in the control group, while these parameters were significantly correlated with LH and FSH in the CPP group. From multivariate regression, insulin and the HOMA-IR were associated with reproductive indices in CPP and with fat mass in controls.
Conclusion: Insulin sensitivity and insulin resistance were related to metabolic factors in prepubertal stage, but were more associated with the reproductive status during pubertal advancement.
Keywords: CPP; insulin; HOMA-IR; QUICKI; obesity (Siriraj Med J 2018;70: 114-122)
INTRODUCTION
The onset of puberty is associated with activation of the hypothalamo–pituitary–gonadal axis, which is crucially dependent on sufficient energy stores and the amount of fat in the body.1-3 Childhood obesity, higher
body mass index (BMI), and adiposity are associated with earlier age at onset of puberty, increased diagnosed cases of central precocious puberty, earlier onset of menarche in girls4-8, and increased cardiovascular risk
during adulthood.9,10 Moreover, some studies have reported
that higher insulin levels were associated with an earlier age of menarche.11-15 Additionally, high insulin secretion
and low insulin sensitivity are related to increased fat
mass in children who had a normal birth weight10, 16 and
those who were small for gestational age.17,18 Girls with
CPP had significantly higher fat mass, lower insulin sensitivity, and adverse lipid profiles at the time of diagnosis compared with normal girls.7 However, one
study reported that girls with CPP did not have an adverse metabolic profile despite having a higher BMI compared with normal girls of the same age.10
and adiposity in girls with CPP need to be investigated in clinical practice to prevent adverse metabolic profiles and further complications of cardiovascular risk.
The objectives of this study were as follows: 1) to compare clinical and biochemical parameters, including insulin, fasting lipid profiles, fasting blood glucose, an index of insulin resistance (homeostasis model assessment-estimated insulin resistance, HOMA-IR), and an index of insulin sensitivity (quantitative insulin sensitivity check index, QUICKI) between girls with CPP and age-matched control girls, with subgroup analysis into obese and non-obese girls; 2) to determine correlations between insulin, HOMA-IR, and the QUICKI with clinical and biochemical parameters in CPP and control subjects; and 3) to determine multivariate regression analyses for insulin, HOMA-IR, and QUICKI in the CPP and control groups. In the transition from non-puberty to puberty, we hypothesized that clinical and biochemical parameters, insulin, an index of insulin resistance, and an index of insulin sensitivity might play different roles in the prepubertal and pubertal stages.
MATERIALS AND METHODS
Subjects
This study was a case-control study that was carried out from December 2011 to March 2013 at the Faculty of Medicine Siriraj Hospital. The methods and protocols in this study were approved by the Siriraj Institutional Review Board (Si 522/2011). They were in full compliance with International Guidelines for Human Research Protection, the Declaration of Helsinki, the Belmont Report, CIOMS Guidelines, and the International Conference on Harmonization in Good Clinical Practice. Written informed consent from all subjects and their parents or guardians was obtained. There were 2 groups of subjects, girls with CPP and age-matched controls. The CPP group consisted of girls who were diagnosed with CPP by pediatric endocrinologists. The inclusion criteria were 1) onset of breast development before 8 years, 2) advanced bone age; and 3) basal luteinizing hormone (LH) levels greater than 0.3 mIU/ml or a LH peak greater than 6 mIU/ml after gonadotropin-releasing hormone (GnRH) stimulation. The exclusion criteria were patients with a present or past history of the following: 1) diseases of the central nervous system, such as cerebral palsy, infection, chronically increased intracranial pressure, intoxication by substances, epilepsy, meningitis, and birth asphyxia; 2) diseases of the endocrinology system, such as hypothyroidism or hyperthyroidism, Cushing’s syndrome, diabetes mellitus (DM), polycystic ovarian syndrome, congenital adrenal hyperplasia; and 3) those receiving
hormonal therapy or other current medications. All patients suspected of CPP had been scheduled to perform a GnRH stimulation test with a 12-hour overnight fast prior to the test day. At 07.30 to 08.00 am of the test day, 5 ml of fasting blood sample was collected from each patient to measure basal levels of LH, follicle-stimulating hormone (FSH), fasting blood glucose, insulin, triglyceride, total cholesterol, high-density lipoprotein (HDL)-cholesterol, and low-high-density lipoprotein (LDL)-cholesterol. After collection of blood, the GnRH stimulation test was immediately performed by using Diphereline® 0.1 mg injected subcutaneously, and blood samples were drawn every 20 minutes twice (at 20, and 40 minutes) to measure LH and FSH levels. Patients who had early pubertal features such as having breast budding, but did not fall within the criteria for diagnosis of CPP were classified as early puberty, but not CPP group (n=3) and these were excluded in the analysis. The control group consisted of healthy age-matched girl volunteers with a difference of no more than 2 months of age from the individual girls with CPP and who did not have the exclusion criteria. Subjects of the control group were advised to undergo a 12-hour overnight fast before the morning of the appointed day to collect clinical data and blood samples. Blood samples of 5 ml were collected in the control subjects for measurement of basal LH, FSH, fasting blood glucose, insulin, triglyceride, total cholesterol, HDL-cholesterol, and LDL-cholesterol. In both groups, the maximal age limitation of the subjects was 10 years. Subjects could withdraw from the project anytime, although there was no withdrawal of any subjects.
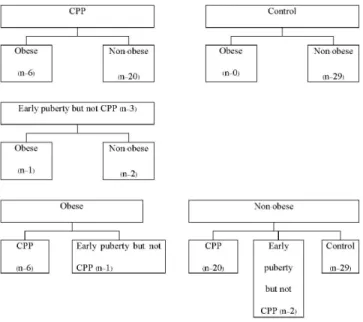
There were 26 CPP girls and 29 control girls. Obese subjects had a BMI standard deviation score (SDS) of more than 2 and non-obese subjects had a BMI SDS of 2 or less.19 There were no subjects in the obese control
group. Therefore, comparison between was made between non-obese control girls (n=29), non-obese CPP girls (n=20), and obese CPP girls (n=6).
Clinical parameters
The clinical data consisted of chronological age, birth weight, Tanner stage, and percentiles of systolic blood pressure (SBP), diastolic blood pressure (DBP), body weight (BW), height, and BMI. Percentiles of BW and height were assessed according to the National Standard Growth Curve of the Ministry of Public Health, Thailand Department of Health, Ministry of Public Health.20 The BMI percentile was assessed according to
rate of the breasts and genitalia were assessed using the method of Marshall and Tanner.21 A history of maternal
age of menarche was collected from recall memory of the mothers of each subject. Data of reported paternal and maternal heights were used to calculate the mid-parental height by the formula: (paternal height+maternal height-13)/2.
Average daily caloric intake was assessed from a food record, which was recorded for 3 consecutive days prior to blood sample collection. Daily caloric intake was calculated by using the program INMUCAL-Nutrients version 1.0, which was developed by the Faculty of Public Health, Mahidol University. Body composition analysis was performed by using the total body composition analyzer TBF-300A (Tanita Corporation, Tokyo, Japan) to measure the percentage of body fat, fat mass, and fat-free mass.
Biochemical parameters
Levels of fasting blood glucose, insulin, triglyceride, total cholesterol, HDL-cholesterol, LDL-cholesterol, basal LH, and basal FSH were measured by the central laboratory of Siriraj Hospital at the Department of Clinical Pathology, Faculty of Medicine Siriraj Hospital. The methods of measurement were as follows: glucose by enzymatic (hexokinase) method; insulin, LH, and FSH by electrochemiluminescence immunoassay (ECLIA); and triglycerides, total cholesterol, HDL-cholesterol, and LDL-cholesterol by enzymatic colorimetric assays. Fasting plasma glucose and insulin levels were used to determine the level of insulin resistance using the HOMA-IR model, which was calculated as follows: fasting glucose (mg/dl)×fasting insulin (µU/ml)/405. The QUICKI was used to represent insulin sensitivity. This index is one of the most accurate surrogate indices for determination of insulin sensitivity22, and was calculated as follows:
1/log fasting insulin (
µ
U/ml)+log fasting glucose (mg/dl).Statistical analysis
Clinical parameters including age, fat mass, and fat free mass are expressed as interquartile ranges representing as the 25th percentile (P25), median, and the 75th percentile (P75). Other data are expressed as the mean ± standard error of the mean (SEM). The Kolomonov–Smirnov test was used to test normality. To compare normally distributed data between non-obese control girls (n=29), non-obese CPP girls (n=20), and obese CPP girls (n=6), one-way analysis of variance (ANOVA) statistic followed by least significant difference post-hoc was used. To compare non-normally distributed data between these groups, a non-parametric test was used for analysis. To determine correlations between two factors, Pearson product-moment correlation was used to analyze normally distributed data and Spearman’s rank correlation was used to determine non-normally distributed or ranked data. A p value less than 0.05 was considered as statistical significance. All data were analyzed by using SPSS (PASW) 18 (SPSS Inc., Chicago, IL).
RESULTS
Clinical characteristics of obese control, non-obese CPP, and non-obese CPP girls.
Clinical characteristics including age, fat mass, and fat-free mass of non-obese control, non-obese CPP, and obese CPP girls are shown in Table 1 as interquartile ranges (the P25, median, and P75).
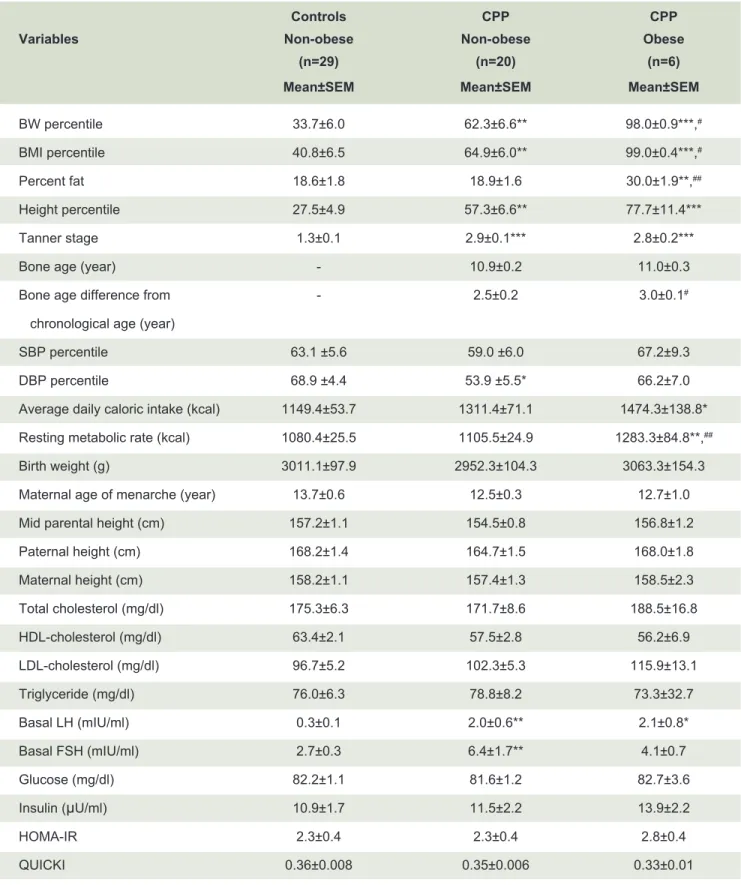
Comparisons of clinical and biochemical parameters between non-obese control, non-obese CPP, and obese CPP girls.
Comparisons of clinical and biochemical parameters between non-obese control, non-obese CPP, and obese CPP girls are shown in Fig 1.
BW, BMI, and height percentiles, Tanner stage, and basal LH levels were significantly higher in non-obese
TABLE 1. Clinical characteristics of non-obese control, non-obese CPP, and obese CPP girls.
P25 = 25th percentile, Med = median, P75 = 75th percentile
Controls CPP CPP
Variables Non-obese (n=29) Non-obese (n=20) Obese (n=6) P25 Med P75 P25 Med P75 P25 Med P75
Age (year) 8.1 8.4 8.9 7.8 7.8 8.8 7.3 8.2 8.6
Fat mass (kg) 4.3 5.2 8.1 3.0 3.0 8.2 9.2 11.4 16.0
TABLE 2. Comparisons of clinical and biochemical parameters between non-obese control, non-obese CPP, and
obese CPP girls.
Controls CPP CPP
Variables Non-obese Non-obese Obese
(n=29) (n=20) (n=6) Mean±SEM Mean±SEM Mean±SEM
BW percentile 33.7±6.0 62.3±6.6** 98.0±0.9***,#
BMI percentile 40.8±6.5 64.9±6.0** 99.0±0.4***,#
Percent fat 18.6±1.8 18.9±1.6 30.0±1.9**,##
Height percentile 27.5±4.9 57.3±6.6** 77.7±11.4***
Tanner stage 1.3±0.1 2.9±0.1*** 2.8±0.2***
Bone age (year) - 10.9±0.2 11.0±0.3
Bone age difference from - 2.5±0.2 3.0±0.1#
chronological age (year)
SBP percentile 63.1 ±5.6 59.0 ±6.0 67.2±9.3
DBP percentile 68.9 ±4.4 53.9 ±5.5* 66.2±7.0
Average daily caloric intake (kcal) 1149.4±53.7 1311.4±71.1 1474.3±138.8* Resting metabolic rate (kcal) 1080.4±25.5 1105.5±24.9 1283.3±84.8**,##
Birth weight (g) 3011.1±97.9 2952.3±104.3 3063.3±154.3
Maternal age of menarche (year) 13.7±0.6 12.5±0.3 12.7±1.0
Mid parental height (cm) 157.2±1.1 154.5±0.8 156.8±1.2
Paternal height (cm) 168.2±1.4 164.7±1.5 168.0±1.8
Maternal height (cm) 158.2±1.1 157.4±1.3 158.5±2.3
Total cholesterol (mg/dl) 175.3±6.3 171.7±8.6 188.5±16.8
HDL-cholesterol (mg/dl) 63.4±2.1 57.5±2.8 56.2±6.9
LDL-cholesterol (mg/dl) 96.7±5.2 102.3±5.3 115.9±13.1
Triglyceride (mg/dl) 76.0±6.3 78.8±8.2 73.3±32.7
Basal LH (mIU/ml) 0.3±0.1 2.0±0.6** 2.1±0.8*
Basal FSH (mIU/ml) 2.7±0.3 6.4±1.7** 4.1±0.7
Glucose (mg/dl) 82.2±1.1 81.6±1.2 82.7±3.6
Insulin (μU/ml) 10.9±1.7 11.5±2.2 13.9±2.2
HOMA-IR 2.3±0.4 2.3±0.4 2.8±0.4
QUICKI 0.36±0.008 0.35±0.006 0.33±0.01
*compared to control girls: *p<0.05, **p<0.01, ***p<0.001
Fig 1. Subject allocation
CPP compared to non-obese control girls, as well as in obese CPP compared to non-obese control girls (all p<0.01). Basal FSH was significantly higher (p<0.01) while DBP percentile was significantly lower (p<0.05) in non-obese CPP compared to non-obese control girls. Maternal age of menarche (p=0.067) and midparental height (p=0.052) tended to be lower in non-obese CPP compared to non-obese control girls. Non-obese control girls tended to have lower average caloric intake compared to non-obese CPP girls (p=0.074) and had significantly lower average caloric intake compared to obese CPP girls (p<0.05). Percent fat and resting metabolic rate were significantly higher in obese CPP girls compared to non-obese CPP and control girls (all p<0.01). Bone age differences were significantly higher in obese CPP girls compared to non-obese CPP girls (p<0.05). Insulin, the HOMA-IR, the QUICKI, fasting glucose, total cholesterol, HDL-cholesterol, LDL-cholesterol, and triglyceride levels were not different between all groups.
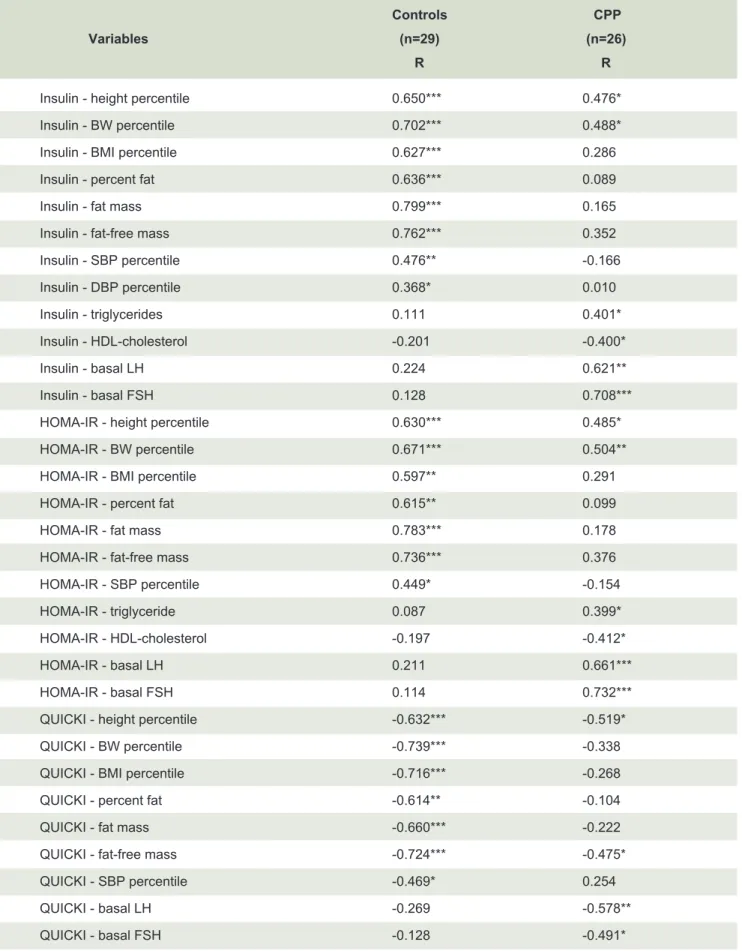
Correlations of insulin, the HOMA-IR, and the QUICKI with clinical and biochemical parameters in CPP and control girls.
Correlations of insulin, the HOMA-IR, and the QUICKI with clinical and biochemical parameters in CPP and control girls are shown in Table 3.
Insulin and HOMA-IR had positive correlations with height and BW percentiles in both control (R≈0.6-0.7) and CPP girls (R≈0.4-0.5) and had positive correlation with BMI percentile, percent fat, fat mass, fat-free mass, SBP and/or DBP percentiles only in control girls (R≈0.4-0.8) (all p<0.05). Insulin had positive correlations with triglycerides, basal LH, and basal FSH (R≈0.4-0.7), but
was negatively correlated with HDL-cholesterol only in CPP girls (R≈-0.4) (all p<0.05).
The QUICKI had negative correlations with height percentile and fat free mass in control (R≈-0.6-0.7) and CPP girls (R≈-0.4-0.5) and had negative correlations with BW and BMI percentiles, percent fat, fat mass, and SBP percentile only in control girls (R≈-0.4-0.7) (all p<0.05). The QUICKI had negative correlations with basal LH and basal FSH (R≈0.4-0.5) (all p<0.05).
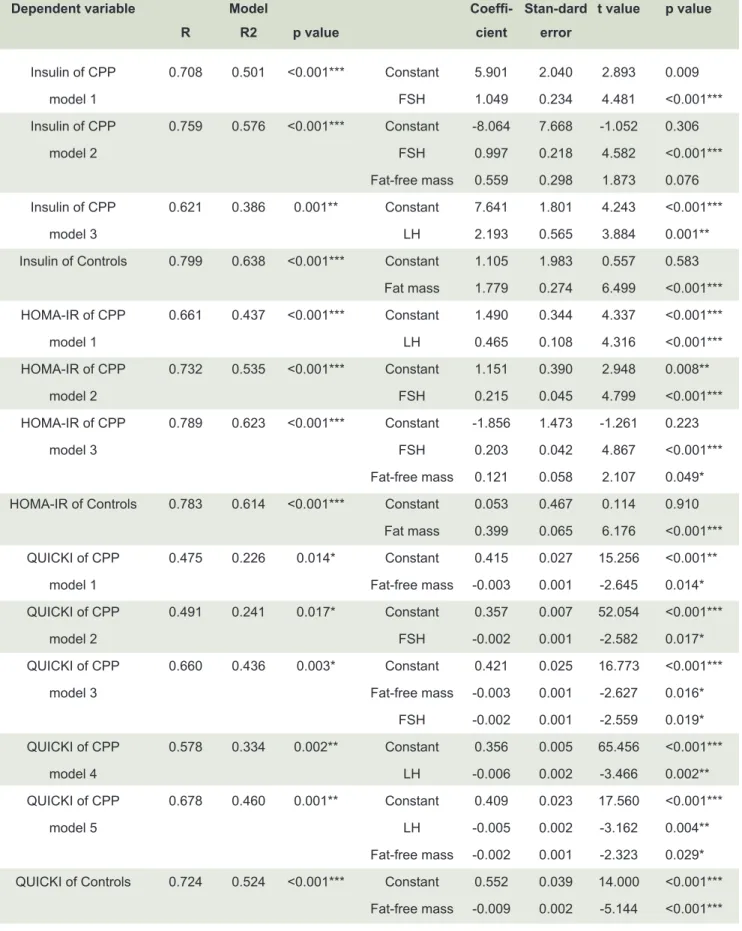
Multivariate analysis of insulin, the HOMA-IR, and the QUICKI in the CPP girls and controls.
Multivariate analysis of insulin, the HOMA-IR, and the QUICKI in the CPP girls and control girls are shown in Table 4.
Insulin, which was set as the dependent variable, and showed significant associations with FSH (model 1) or FSH and fat-free mass (model 2) or LH (model 3) in CPP girls, and with fat mass in controls (all p<0.01). The HOMA-IR showed significant interactions with LH (model 1) or FSH (model 2) or FSH and fat-free mass (model 3) in CPP girls, and with fat mass in controls (all p<0.01). The QUICKI showed significant interactions with fat-free mass (model 1) or FSH (model 2) or fat-free mass and FSH (model 3) or LH (model 4) or LH and fat-free mass (model 5) in CPP girls, and with fat-free mass in controls (all p<0.05).
DISCUSSION
This study examined comparisons between CPP and age-matched control girls with subgroup analysis of obese and non-obese girls.
TABLE 3. Correlations of insulin, the HOMA-IR, and the QUICKI with clinical and biochemical parameters in
CPP and control girls.
Controls CPP Variables (n=29) (n=26)
R R
Insulin - height percentile 0.650*** 0.476*
Insulin - BW percentile 0.702*** 0.488*
Insulin - BMI percentile 0.627*** 0.286
Insulin - percent fat 0.636*** 0.089
Insulin - fat mass 0.799*** 0.165
Insulin - fat-free mass 0.762*** 0.352
Insulin - SBP percentile 0.476** -0.166
Insulin - DBP percentile 0.368* 0.010
Insulin - triglycerides 0.111 0.401*
Insulin - HDL-cholesterol -0.201 -0.400*
Insulin - basal LH 0.224 0.621**
Insulin - basal FSH 0.128 0.708***
HOMA-IR - height percentile 0.630*** 0.485*
HOMA-IR - BW percentile 0.671*** 0.504**
HOMA-IR - BMI percentile 0.597** 0.291
HOMA-IR - percent fat 0.615** 0.099
HOMA-IR - fat mass 0.783*** 0.178
HOMA-IR - fat-free mass 0.736*** 0.376
HOMA-IR - SBP percentile 0.449* -0.154
HOMA-IR - triglyceride 0.087 0.399*
HOMA-IR - HDL-cholesterol -0.197 -0.412*
HOMA-IR - basal LH 0.211 0.661***
HOMA-IR - basal FSH 0.114 0.732***
QUICKI - height percentile -0.632*** -0.519*
QUICKI - BW percentile -0.739*** -0.338
QUICKI - BMI percentile -0.716*** -0.268
QUICKI - percent fat -0.614** -0.104
QUICKI - fat mass -0.660*** -0.222
QUICKI - fat-free mass -0.724*** -0.475*
QUICKI - SBP percentile -0.469* 0.254
QUICKI - basal LH -0.269 -0.578**
QUICKI - basal FSH -0.128 -0.491*
TABLE 4. Multivariate analysis of insulin, the HOMA-IR, and the QUICKI in the CPP girls and controls.
Dependent variable Model Coeffi- Stan-dard t value p value R R2 p value cient error
Insulin of CPP 0.708 0.501 <0.001*** Constant 5.901 2.040 2.893 0.009
model 1 FSH 1.049 0.234 4.481 <0.001***
Insulin of CPP 0.759 0.576 <0.001*** Constant -8.064 7.668 -1.052 0.306
model 2 FSH 0.997 0.218 4.582 <0.001***
Fat-free mass 0.559 0.298 1.873 0.076 Insulin of CPP 0.621 0.386 0.001** Constant 7.641 1.801 4.243 <0.001***
model 3 LH 2.193 0.565 3.884 0.001**
Insulin of Controls 0.799 0.638 <0.001*** Constant 1.105 1.983 0.557 0.583 Fat mass 1.779 0.274 6.499 <0.001*** HOMA-IR of CPP 0.661 0.437 <0.001*** Constant 1.490 0.344 4.337 <0.001***
model 1 LH 0.465 0.108 4.316 <0.001***
HOMA-IR of CPP 0.732 0.535 <0.001*** Constant 1.151 0.390 2.948 0.008**
model 2 FSH 0.215 0.045 4.799 <0.001***
HOMA-IR of CPP 0.789 0.623 <0.001*** Constant -1.856 1.473 -1.261 0.223
model 3 FSH 0.203 0.042 4.867 <0.001***
Fat-free mass 0.121 0.058 2.107 0.049* HOMA-IR of Controls 0.783 0.614 <0.001*** Constant 0.053 0.467 0.114 0.910
Fat mass 0.399 0.065 6.176 <0.001*** QUICKI of CPP 0.475 0.226 0.014* Constant 0.415 0.027 15.256 <0.001**
model 1 Fat-free mass -0.003 0.001 -2.645 0.014*
QUICKI of CPP 0.491 0.241 0.017* Constant 0.357 0.007 52.054 <0.001***
model 2 FSH -0.002 0.001 -2.582 0.017*
QUICKI of CPP 0.660 0.436 0.003* Constant 0.421 0.025 16.773 <0.001***
model 3 Fat-free mass -0.003 0.001 -2.627 0.016*
FSH -0.002 0.001 -2.559 0.019* QUICKI of CPP 0.578 0.334 0.002** Constant 0.356 0.005 65.456 <0.001***
model 4 LH -0.006 0.002 -3.466 0.002**
QUICKI of CPP 0.678 0.460 0.001** Constant 0.409 0.023 17.560 <0.001***
model 5 LH -0.005 0.002 -3.162 0.004**
Fat-free mass -0.002 0.001 -2.323 0.029* QUICKI of Controls 0.724 0.524 <0.001*** Constant 0.552 0.039 14.000 <0.001***
Fat-free mass -0.009 0.002 -5.144 <0.001***
Percent fat and resting metabolic rate were significantly higher in obese CPP girls compared to non-obese CPP and control girls, so these factors were specifically associated with obesity status. Furthermore, bone age difference from chronological age was significantly increased in the obese CPP girls compared to non-obese CPP girls. This finding could be explained by the effect of obesity on early onset of puberty.
Insulin, the HOMA-IR, and the QUICKI were not significantly different between girls with CPP and controls. However, insulin and the HOMA-IR were positively correlated with anthropometric parameters including height, BW, and BMI percentiles, percent fat, fat mass, and fat-free mass mainly in the control group. Insulin, the QUICKI, and the HOMA-IR were correlated with basal LH and FSH levels in the CPP group, but not in the control group. Multivariate regression analysis showed that insulin and the HOMA-IR were associated with fat-free mass and reproductive indices, including LH and FSH levels in girls with CPP, and with fat mass in controls. The QUICKI, which is an index of insulin sensitivity, was associated with fat-free mass in girls with CPP and controls, as well as with reproductive indices, including LH and FSH levels, in girls with CPP. These results suggested that insulin sensitivity and insulin resistance were related to anthropometric parameters in the prepubertal stage, but were more strongly associated with FSH and LH during pubertal advancement. Furthermore, it could be interpreted that insulin action in girls with CPP might be more related to reproductive regulation rather than its anabolic action. One possible underlying mechanism of these results could be that insulin has a central effect to stimulate reproduction in the pubertal stage.23,24
In the control group, not in the CPP group, insulin and the HOMA-IR were positively, but the QUICKI was negatively correlated with SBP and/or DBP percentiles. The positive correlation between insulin and blood pressure in control girls could be explained by the fact that insulin could increase renal sodium reabsorption leading to hypertension.25 However, this association
was not observed in the CPP girls, suggesting that the physiologic action of insulin might be changed during pubertal development.
In CPP girls, but not in control girls, insulin levels and the HOMA-IR showed positive correlations with triglyceride levels and negative correlations with HDL-cholesterol levels. These findings suggested that protective effects on the cardiovascular system and metabolism were decreased, while insulin levels and the HOMA-IR were elevated in girls with CPP. Another interpretation of our
findings is that during initiation of pubertal development, glucose, insulin, adiposity, and blood pressure are not directly associated with their main peripheral function of metabolic and blood pressure regulations, but might be related to reproductive regulation. Insulin resistance could also be predisposed by genetic factors with the presence of a family history of type 2 DM. However, in our study, the family history of type 2 DM was not obtained from each subject.
The strengths of this study were as follows. 1) This study compared girls with CPP and controls. We also dissected out the effect of obesity associated with early puberty by subgroup analysis of comparisons between non-obese control, non-obese CPP, and obese CPP girls. 2) This study examined correlations and multivariate analyses of insulin, the HOMA-IR, and the QUCKI with clinical and biochemical parameters with subgroup analysis of CPP and control girls. Using this method, the role of factors associated with each pubertal status could be differentiated. However, there are some limitations of the study as follows. 1) The number of recruited obese subjects was low in the CPP group (n=6) and absent in the control group, so this might have led to flawed analysis. 2) Some parameters such as daily caloric intake calculated from food records, maternal age of menarche, and parental heights were reported from recall memory of the parents, so there could be some limitations of the data accuracy.
CONCLUSION
Girls with CPP had higher BW, BMI, and height percentiles, with a trend of lower maternal age of menarche and mid-parental height compared to controls. Insulin levels and the HOMA-IR were associated with anthropometric data in controls, but were more strongly associated with reproductive parameters in girls with CPP. Many correlations and multivariate associations between insulin, the HOMA-IR, and the QUICKI with anthropometric, metabolic, BP, and reproductive parameters in CPP girls were different from controls, indicating that these factors changed during pubertal development. During initiation of pubertal development, glucose, insulin, and adiposity might not be directly associated with their main peripheral function of metabolic regulation, but could be related to other functions involved in reproductive regulation.
ACKNOWLEDGMENTS
Siriraj Hospital for case recruitment. We also thank Malika Churintaraphan, Pailin Maikaew, and Issarawan Keadkraichaiwat from the Department of Physiology, Faculty of Medicine Siriraj Hospital, Mahidol University, for data analysis. We thank staff and students from Kositsamosorn Primary School for case recruitment and cooperation.
Funding: This study is supported by the Faculty of Medicine
Siriraj Hospital Research Fund ((IO) R015533005).
Declaration of interests: All authors declare no conflict
of interest.
REFERENCES
1. Bronson F. Food-restricted, prepubertal, female rats: rapid recovery of luteinizing hormone pulsing with excess food, and full recovery of pubertal development with gonadotropin- releasing hormone. Endocrinology. 1986;118(6):2483-7.
2. Frisch R. Body fat, menarche, fitness and fertility. Hum Reprod. 1987;2(6):521-33.
3. Wade G, Schneider J. Metabolic fuels and reproduction in female mammals. Neurosci Biobehav Rev. 1992;16(2):235-72.
4. Biro F, Khoury P, Morrison J. Influence of obesity on timing of puberty. Int J Androl. 2006;29(1):272-7.
5. Burt Solorzano C, McCartney C. Obesity and the pubertal transition in girls and boys. Reproduction. 2010;140(3):399- 410.
6. Kaplowitz P. Link between body fat and the timing of puberty. Pediatrics. 2008;121(Suppl 3):S208-17.
7. Sørensen K, Mouritsen A, Mogensen S, Aksglaede L, Juul A. Insulin sensitivity and lipid profiles in girls with central precocious puberty before and during gonadal suppression. J Clin Endocrinol Metab. 2010;95(8):3736-44.
8. Currie C, Ahluwalia N, Godeau E, Nic Gabhainn S, Due P, Currie D. Is obesity at individual and national level associated with lower age at menarche? Evidence from 34 countries in the Health Behaviour in School-aged Children Study. J Adolesc Health. 2012;50(6):621-6.
9. Lakshman R, Forouhi N, Luben R, Bingham S, Khaw K, Wareham N, et al. Association between age at menarche and risk of diabetes in adults: results from the EPIC-Norfolk cohort study. Diabetologia. 2008;51(5):781-6.
10. Rosenfield R, Lipton R, ML D. Thelarche, pubarche, and menarche attainment in children with normal and elevated body mass index. Pediatrics. 2009;123(1):84-8.
11. Frontini M, Srinivasan S, Berenson G. Longitudinal changes in
risk variables underlying metabolic Syndrome X from childhood to young adulthood in female subjects with a history of early menarche: the Bogalusa Heart Study. Int J Obes Relat Metab Disord. 2003;27(11):1398-404.
12. Remsberg K, Demerath E, Schubert C, Chumlea W, Sun S, Siervogel R. Early menarche and the development of cardiovascular disease risk factors in adolescent girls: the Fels Longitudinal Study. J Clin Endocrinol Metab. 2005;90(5):2718-24.
13. Smith J, Cunningham M, Rissman E, Clifton D, Steiner R. Regulation of Kiss1 gene expression in the brain of the female mouse. Endocrinology. 2005;146(9):3686-92.
14. Batterham R, Bloom S. The gut hormone peptide YY regulates appetite. Ann N Y Acad Sci. 2003;994:162-8.
15. Parent A, Teilmann G, Juul A, Skakkebaek N, Toppari J, Bourguignon J. The timing of normal puberty and the age limits of sexual precocity: variations around the world, secular trends, and changes after migration. Endocr Rev. 2003;24(5):668-93.
16. Johnson M, Figueroa-Colon R, Huang T, Dwyer J, Goran M. Longitudinal changes in body fat in African American and Caucasian children: influence of fasting insulin and insulin sensitivity. J Clin Endocrinol Metab. 2001;86(7):3182-7.
17. Ibanez L, Suarez L, Lopez-Bermejo A, Diaz M, Valls C, de Zegher F. Early development of visceral fat excess after spontaneous catch-up growth in children with low birth weight. J Clin Endocrinol Metab. 2008;93(3):925-8.
18. Ibanez L, Valls C, Potau N, Marcos M, de Zegher F. Polycystic ovary syndrome after precocious pubarche: ontogeny of the low-birthweight effect. Clin Endocrinol (Oxf). 2001;55(5): 667-72.
19. WHO. growth reference data for 5-19 years [Internet]. 2007.
20. Pralong F, Voirol M, Giacomini M, Gaillard R, Grouzmann E. Acceleration of pubertal development following central blockade of the Y1 subtype of neuropeptide Y receptors. Regul Pept. 2000;95(1-3):47-52.
21. Marshall WA, Tanner JM. Variations in pattern of pubertal changes in girls. Arch Dis Child. 1969;44(235):291-303.
22. Chen H, Sullivan G, Quon M. Assessing the predictive accuracy of QUICKI as a surrogate index for insulin sensitivity using a calibration model. Diabetes. 2005;54(7):1914-25.
23. Bruning J, Gautam D, Burks D, Gillette J, Schubert M, Orban P, et al. Role of brain insulin receptor in control of body weight and reproduction. Science. 2000;289(5487):2122-5.
24. Salvi R, Castillo E, Voirol M, Glauser M, Rey J, Gaillard R, et al. Gonadotropin-releasing hormone-expressing neurons immortalized conditionally are activated by insulin: implication of the mitogen-activated protein kinase pathway. Endocrinology. 2006;147(2):816-26.