133
Comparative Study on the Adaptation and Growth Dynamics
of the
Helix pomatia
and
Helix aspersa
Muller Terrestrial
Snails Under Different Feeding Regimes
Adrian Toader-Williams, Mihai Ben
ţ
ea
University of Agricultural Sciences and Veterinary Medicine, Calea Mănăştur 3-5, 400372, Cluj-Napoca, Cluj, Romania
Abstract
We used Helix pomatia and Helix aspersa species and measure their growth as the snails were approaching the hibernation season. Helix pomatia 2yo shown a decrease in weight while being raised in enclosed parcels of 4sqm the younger Helix pomatia 1yo as well as Helix aspersa Muller demonstrated the ability to adapt relatively fast to the same conditions. We established 5 experimental lots in a Helix pomatia farm, GPS coordinates N46.606040
E23.599950. Control lot contained Taraxacum officinales, Sonchus oleraceus, Equisetum arvense and Atriplex hortensis, wild flora found within the farm. The other lots contained the same plants as the control lot plus different combinations of imported plants from other areals. The H. pomatia 2yo weight decreased in the control lot by a mean of -3.86% while H. aspersa 1yo marked an increase of +16.89% in the same lot during the same period. The lot containing lupinus polyphyllus delivered snails with weight gain of +24.66% for H. pomatia 2yo and an increase of only +1.98% for H. aspersa 1yo. As a contrast, H. pomatia 2yo gained only +7.72% while H. aspersa 1yo gained +28.89%, in the lot containing Lavanda officinalis, Foeniculum vulgare and Hyssopus officinalis among the other plants.
Keywords: Cornu aspersum, Cluj-Napoca, helicicultura, food selection, ecological farm management, mollusk
1. Introduction
Edible terrestrial snails have been used by humans as food since prehistoric times [1]. In Turkey, Yarimburgaz Cave offers evidences of the use of Helix pomatia for consumption relates Meric in his works [2]. Dalby [3] during his archeological works dates snail shell sediments found in Franchthi Cave, Greece, all the way back to 10,700 BC. Edible terrestrial snails, among herbivores, are regarded as major grazers [4]. Previous research upon the use of different plant species as food by terrestrial snails were conducted by Chevalier et al. [4, 5] but the plant species used in the present study have not been studied. 1Furthermore, the scope of our investigation is to address the productivity issues under intense snail farming conditions rather than
* Corresponding author: Adrian Toader-Williams, www.vitagrom.eu , [email protected]
the biological and environmental aspects neither the chemical nor biochemical content of snail’s feed as decisive factors in snail’s food attraction, food selection or their diet. We also intend to observe the practicality of the exploitation of perennial plants as much as possible in the snail farming.
2. Materials and methods
The experimental studies were conducted between July 25-th and September 3-rd 2009.
134 the traceability food products [6, 7]. Five different lots were built within the farm area and each lot 2m x 2m was provided with top closure to prevent the snails from escaping.
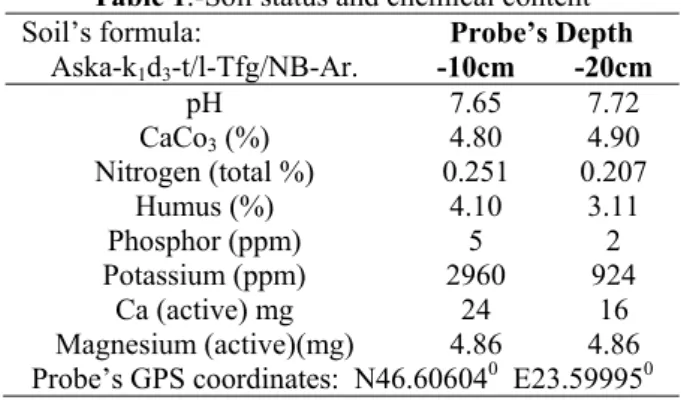
2.2. Soil’s status chemical composition and temperature. The status and the chemistry of the soil in the experimental area have been examined by The Institute of Pedology – Cluj Napoca, and it is described in Table 1.
Soil’s temperature during the experiment ranged from 15oC to 21oC, averaging 17oC, data collected using a soil thermometer Model: tpi-312 with a resolution of 0.1oC and accuracy of ±1oC and a sampling time of 1.5 seconds.
Table 1.-Soil status and chemical content Soil’s formula:
Aska-k1d3-t/l-Tfg/NB-Ar.
Probe’s Depth -10cm -20cm
pH 7.65 7.72
CaCo3 (%) 4.80 4.90
Nitrogen (total %) 0.251 0.207 Humus (%) 4.10 3.11 Phosphor (ppm) 5 2 Potassium (ppm) 2960 924
Ca (active) mg 24 16 Magnesium (active)(mg) 4.86 4.86 Probe’s GPS coordinates: N46.606040 E23.599950
2.3. Weather conditions - The air temperature and humidity indicated in Table 2. were recorded using a USB-502 data logger supporting a range of -35oC to +80oC (±1oC) and 0% to 100% relative humidity.
Table 2.-Weather conditions during experiments
Temperature Humidity
maximum 33oC (August 4-th) 92 %
minimum 9oC (August 20-th) 30 %
average 20 74 %
2.4. Snail species – From the age-size-weight point of view, we used in our study as much as possible homogenous populations of Helix pomatia 2 years old, Helix pomatia 1 year old from the local farm and Helix aspersa Muller 1 year old and Helix aspersa Muller 30 to 40 days old imported. Groups of each species and age were introduced in all of the experimental lots.
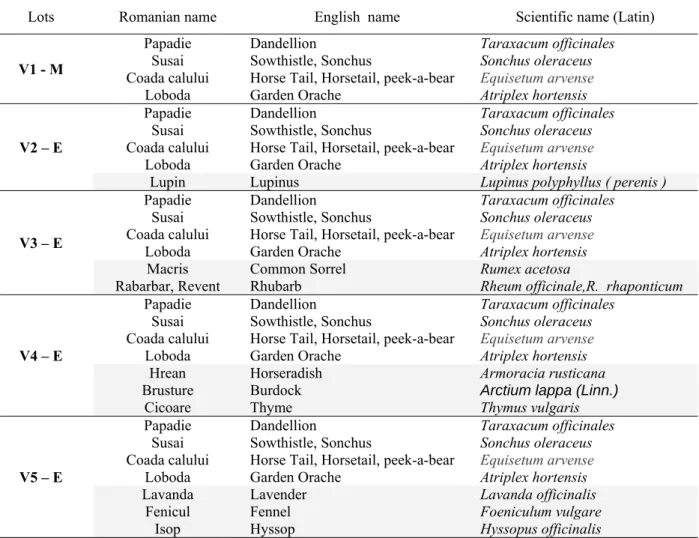
2.5. Plants species – In Table 3 are listed the plants used to feed the snails. Most of them are
perennial. The plants in the control lot V1-M are basically representative of the majority of plant population found in the farm and observed as constituting food for snails. They are Taraxacum officinales Sonchus oleraceus, Equisetum arvense,
and Atriplex hortensis. The other lots will also contain plants found in the control lot but in a lower density, therefore making room for additional species such as:
In lot V2-E we added in Lupinus polyphyllus (perenis) a species imported from a different areal were we observed as being highly preferred by snails.
In lot V3-E we added Rumex acetosa and Rheum officinale (R. Rhaponticum).
In lot V4-E we added other highly preferred plants by snails such as Armoracia rusticana, Arctium
lappa (Linn.) along withThymus vulgaris.
In lot V5-E we added Lavanda officinalis, Foeniculum vulgare and Hyssopus officinalis.
2.6. Measurements - At the beginning of the study, the Helix pomatia and Helix aspersa 1 and 2 years old snails were divided in 10 groups for each species and age, having 5 snails in each group and Helix aspersa 30-40 days old in 5 groups of 40 snails each. All groups were measured in weight using an AWS weight scale precision ±0.01 grams. Snail’s behavior has been observed such as its favorite resting places and its appetite for specific plants (Figure 1.).
135
Table 3. – The major plant population constituting food for snails in the control and experimental lots
Lots Romanian name English name Scientific name (Latin)
V1 - M
Papadie Dandellion Taraxacum officinales
Susai Sowthistle, Sonchus Sonchus oleraceus
Coada calului Horse Tail, Horsetail, peek-a-bear Equisetum arvense
Loboda Garden Orache Atriplex hortensis
V2 – E
Papadie Dandellion Taraxacum officinales
Susai Sowthistle, Sonchus Sonchus oleraceus
Coada calului Horse Tail, Horsetail, peek-a-bear Equisetum arvense
Loboda Garden Orache Atriplex hortensis
Lupin Lupinus Lupinus polyphyllus ( perenis )
V3 – E
Papadie Dandellion Taraxacum officinales
Susai Sowthistle, Sonchus Sonchus oleraceus
Coada calului Horse Tail, Horsetail, peek-a-bear Equisetum arvense
Loboda Garden Orache Atriplex hortensis
Macris Common Sorrel Rumex acetosa
Rabarbar, Revent Rhubarb Rheum officinale,R. rhaponticum
V4 – E
Papadie Dandellion Taraxacum officinales
Susai Sowthistle, Sonchus Sonchus oleraceus
Coada calului Horse Tail, Horsetail, peek-a-bear Equisetum arvense
Loboda Garden Orache Atriplex hortensis
Hrean Horseradish Armoracia rusticana
Brusture Burdock Arctium lappa (Linn.)
Cicoare Thyme Thymus vulgaris
V5 – E
Papadie Dandellion Taraxacum officinales
Susai Sowthistle, Sonchus Sonchus oleraceus
Coada calului Horse Tail, Horsetail, peek-a-bear Equisetum arvense
Loboda Garden Orache Atriplex hortensis
Lavanda Lavender Lavanda officinalis
Fenicul Fennel Foeniculum vulgare
Isop Hyssop Hyssopus officinalis
2.7. Statistics - For data statistical interpretation and the generation of graphics we used statistical software GraphPad 5.03 and Excel module from Microsoft Office 2003. Column statistics and ANOVA test incorporating the Dunnett's Multiple Comparison Test.
3. Results and discussion
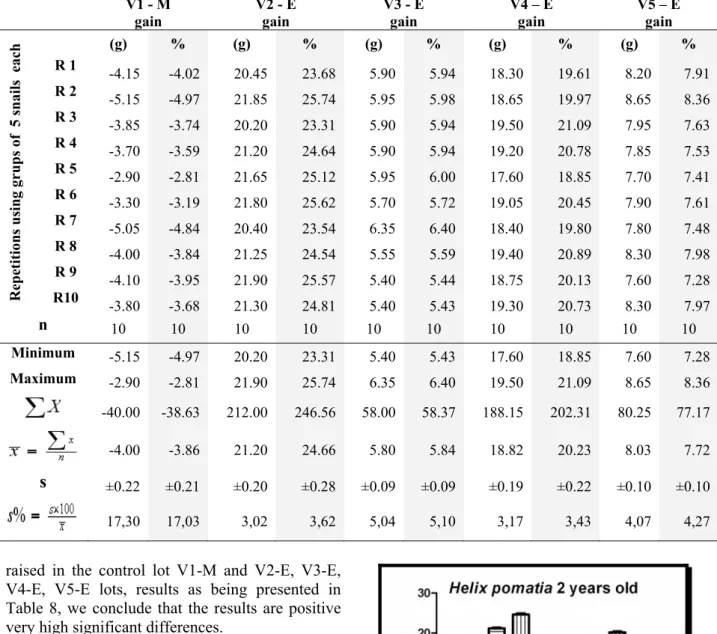
Upon our investigation we observed (Table 4.) that in the control lot, namely V1-M, Helix pomatia 2 y.o. experienced a decrease in weight of 4±0.22 g, corresponding to a -3.86±0.21 % increase value (actually a decrease, being a negative value), having minimum gain values of -5.15g or -4.97% and maximum values of -2.90g or -2.81% respectively, while in the other lots Helix
pomatia 2 y.o. registered an increase in weight, topping a 24.66±0.28% (corresponding to 21.20±0.20 grams) weight gain in lot V2-E immediately followed by a 20.23±0.22% in lot V4-E. The minimum values are 20.20g or 23.31% with maximum values of 21.90g or 25.74% for V2-E while in V4-E we obtained minimums of 17.60g or 18.85% and maximums of 19.50g or 21.09%.
In lot V3-E a gain of 5.84±0.09% and in lot V5-E a gain of 7.72±0.10% has been obtained.
136
Table 4. - Weight values response on Helix pomatia Linn. 2 years old at the end of 40 days of experimental feeding conditions
V1 - M
gain V2 - E gain V3 - E gain V4 – E gain V5 – E gain
Repe
tition
s us
ing
grups
of
5 snails
eac
h (g) % (g) % (g) % (g) % (g) %
R 1 -4.15 -4.02 20.45 23.68 5.90 5.94 18.30 19.61 8.20 7.91 R 2 -5.15 -4.97 21.85 25.74 5.95 5.98 18.65 19.97 8.65 8.36 R 3 -3.85 -3.74 20.20 23.31 5.90 5.94 19.50 21.09 7.95 7.63 R 4 -3.70 -3.59 21.20 24.64 5.90 5.94 19.20 20.78 7.85 7.53 R 5 -2.90 -2.81 21.65 25.12 5.95 6.00 17.60 18.85 7.70 7.41 R 6 -3.30 -3.19 21.80 25.62 5.70 5.72 19.05 20.45 7.90 7.61 R 7 -5.05 -4.84 20.40 23.54 6.35 6.40 18.40 19.80 7.80 7.48 R 8 -4.00 -3.84 21.25 24.54 5.55 5.59 19.40 20.89 8.30 7.98 R 9 -4.10 -3.95 21.90 25.57 5.40 5.44 18.75 20.13 7.60 7.28 R10 -3.80 -3.68 21.30 24.81 5.40 5.43 19.30 20.73 8.30 7.97
n 10 10 10 10 10 10 10 10 10 10
Minimum -5.15 -4.97 20.20 23.31 5.40 5.43 17.60 18.85 7.60 7.28 Maximum -2.90 -2.81 21.90 25.74 6.35 6.40 19.50 21.09 8.65 8.36
-40.00 -38.63 212.00 246.56 58.00 58.37 188.15 202.31 80.25 77.17
-4.00 -3.86 21.20 24.66 5.80 5.84 18.82 20.23 8.03 7.72
s
±0.22 ±0.21 ±0.20 ±0.28 ±0.09 ±0.09 ±0.19 ±0.22 ±0.10 ±0.1017,30 17,03 3,02 3,62 5,04 5,10 3,17 3,43 4,07 4,27
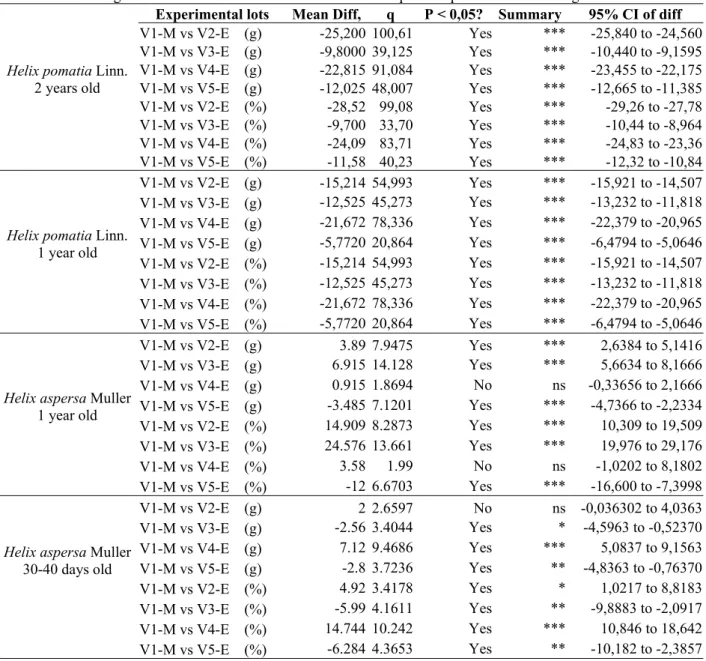
raised in the control lot V1-M and V2-E, V3-E, V4-E, V5-E lots, results as being presented in Table 8, we conclude that the results are positive very high significant differences.
Figure 2. and Figure 3., reveal synoptically the
dynamics of the snail’s weight gain by
incorporating the data from Table 4. with data
from Table 5., respectively. Obviously,
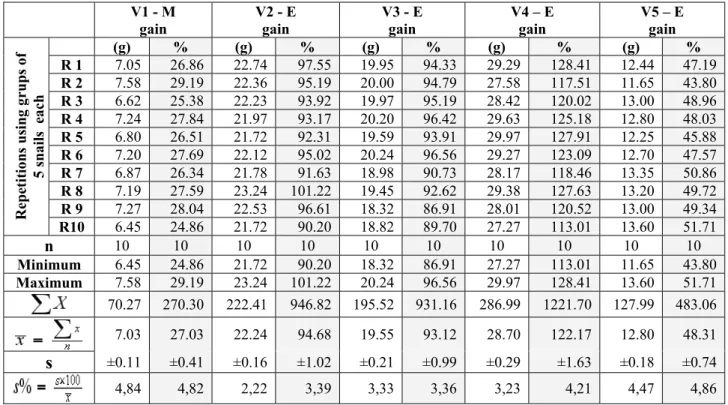
Helix pomatia 1 y.o, in the control lot V1-M, did not experience a decrease of weight but on the other hand the increase was the smallest from all lots, with a mean of 27.02±0.41%. As in exchange, in lot V2-E we found a gain of 94.68±1.02% second to the top value obtained, this time from snails raised in the lot V4-E, value going as high as137
Table 5. - Weight values response on Helix pomatia Linn. 1 year old at the end of 40 days of experimental feeding conditions
V1 - M
gain V2 - E gain V3 - E gain V4 – E gain V5 – E gain
Repe
tition
s us
ing
grups
of
5 sn
ai
ls
e
ach
(g) % (g) % (g) % (g) % (g) % R 1 7.05 26.86 22.74 97.55 19.95 94.33 29.29 128.41 12.44 47.19
R 2 7.58 29.19 22.36 95.19 20.00 94.79 27.58 117.51 11.65 43.80
R 3 6.62 25.38 22.23 93.92 19.97 95.19 28.42 120.02 13.00 48.96
R 4 7.24 27.84 21.97 93.17 20.20 96.42 29.63 125.18 12.80 48.03
R 5 6.80 26.51 21.72 92.31 19.59 93.91 29.97 127.91 12.25 45.88
R 6 7.20 27.69 22.12 95.02 20.24 96.56 29.27 123.09 12.70 47.57
R 7 6.87 26.34 21.78 91.63 18.98 90.73 28.17 118.46 13.35 50.86
R 8 7.19 27.59 23.24 101.22 19.45 92.62 29.38 127.63 13.20 49.72
R 9 7.27 28.04 22.53 96.61 18.32 86.91 28.01 120.52 13.00 49.34
R10 6.45 24.86 21.72 90.20 18.82 89.70 27.27 113.01 13.60 51.71
n 10 10 10 10 10 10 10 10 10 10
Minimum 6.45 24.86 21.72 90.20 18.32 86.91 27.27 113.01 11.65 43.80
Maximum 7.58 29.19 23.24 101.22 20.24 96.56 29.97 128.41 13.60 51.71 70.27 270.30 222.41 946.82 195.52 931.16 286.99 1221.70 127.99 483.06
7.03 27.03 22.24 94.68 19.55 93.12 28.70 122.17 12.80 48.31
s
±0.11 ±0.41 ±0.16 ±1.02 ±0.21 ±0.99 ±0.29 ±1.63 ±0.18 ±0.74 4,84 4,82 2,22 3,39 3,33 3,36 3,23 4,21 4,47 4,86Further examination of the results obtained
from
Helix aspersa
1 yo, as seen in Table 6.,
it points to the control lot V1-M as offering a
substantial weight gain of 16.89±0.90% in
exchange for a weight loss, (please see next
page Figure 4) namely a negative gain of
-7.69±0.98% in lot V3-E were
Helix pomatiaof
the same age 1 y.o. had a positive gain of
93.12±0.99%.
A positive gain of 5.84±0.09% has also been
obtained from
Helix pomatia2 yo
raised in lot
V3-E.
Performing ANOVA test and Dunnett's Multiple
Comparison Test, on the gain values data obtained from Helix pomatia 1 yo snails,138
Table 6. - Weight values response on Helix aspersa Muller 1 year old at the end of 40 days of experimental feeding conditions
V1 - M gain
V2 - E gain
V3 - E gain
V4 – E gain
V5 – E gain
Repe
tition
s us
ing
grups
of
5 sn
ai
ls
e
ach
(g) % (g) % (g) % (g) % (g) % R 1 4.55 17.14 0.50 1.64 -3.00 -9.35 3.15 11.43 8.00 28.32
R 2 3.90 14.61 -1.75 -5.62 -1.95 -6.08 3.75 14.59 8.40 29.84
R 3 4.55 17.43 -1.55 -5.02 -1.90 -5.92 4.15 15.99 7.50 27.37
R 4 4.40 16.89 0.55 1.87 -0.50 -1.61 1.80 6.43 8.20 30.83
R 5 5.70 22.01 -0.80 -2.61 -3.85 -11.76 3.85 14.81 7.50 27.73
R 6 4.10 15.89 1.20 4.06 -3.35 -10.28 3.75 13.86 8.70 33.33
R 7 5.30 20.42 2.90 10.23 -1.65 -5.39 2.60 9.35 9.95 37.62
R 8 3.10 11.63 1.20 4.20 -2.65 -8.39 3.70 14.18 7.65 26.42
R 9 4.35 16.17 1.95 6.70 -2.25 -7.11 3.45 12.68 6.55 23.06
R10 4.45 16.70 1.30 4.35 -3.65 -10.98 5.05 19.77 6.80 24.37
n 10 10 10 10 10 10 10 10 10 10
Minimum 3.10 11.63 -1.75 -5.62 -3.85 -11.76 1.80 6.43 6.55 23.06
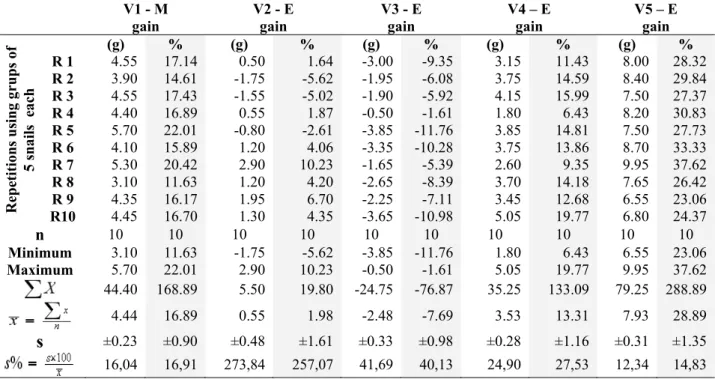
Maximum 5.70 22.01 2.90 10.23 -0.50 -1.61 5.05 19.77 9.95 37.62 44.40 168.89 5.50 19.80 -24.75 -76.87 35.25 133.09 79.25 288.89 4.44 16.89 0.55 1.98 -2.48 -7.69 3.53 13.31 7.93 28.89
s
±0.23 ±0.90 ±0.48 ±1.61 ±0.33 ±0.98 ±0.28 ±1.16 ±0.31 ±1.35 16,04 16,91 273,84 257,07 41,69 40,13 24,90 27,53 12,34 14,83raised in the control lot V1-M and V2-E, V3-E, V4-E, V5-E lots, results as being presented in Table 8, we conclude that all the results are positive very high significant differences.
Helix aspersa 1 yo, as seen in Table 6., manifests (Figure 4.) a substantial gain in lot V5-E, measuring 7.93±0.31g or considering the initial weight a 28.89±1.35%.
Performing ANOVA test and Dunnett's Multiple Comparison Test, on the gain values data obtained from Helix aspersa 1 yo snails, raised in the control lot V1-M and V2-E, V3-E, V4-E, V5-E lots, results as being presented in Table 8, we conclude that all the results are positive highly significant, both comparing the weight gain values in grams as well as expressed in percentages, excepting the V1-M vs. V4-E, both type of values being compared we obtained not significant differences (ns).
Figure 4. – Weight gains distribution on
139
Table 7. - Weight values response on Helix aspersa Muller 30-40 days old at the end of 40 days of experimental feeding conditions
V1 - M
gain V2 - E gain V3 - E gain V4 – E gain V5 – E gain
Repe
tition
s
usi
n
g gru
p
s (g) % (g) % (g) % (g) % (g) %
R 1 8.00 17.70 4.80 9.84 8.00 17.70 1.20 2.03 9.20 20.18
R 2 6.40 13.79 3.60 7.20 9.20 20.54 -3.60 -6.08 8.00 17.39
R 3 5.20 11.40 4.80 9.76 9.60 21.62 0.00 0.00 9.20 20.54
R 4 4.40 9.32 4.00 7.87 6.80 15.18 -0.40 -0.68 8.80 19.13
R 5 4.40 9.40 1.20 2.34 7.60 16.52 -4.40 -7.38 7.20 15.79
n 5 5 5 5 5 5 5 5 5 5
Minimum 4.40 9.32 1.20 2.34 6.80 15.18 -4.40 -7.38 7.20 15.79
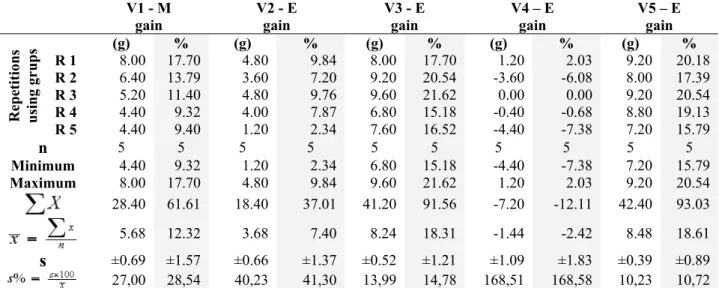
Maximum 8.00 17.70 4.80 9.84 9.60 21.62 1.20 2.03 9.20 20.54 28.40 61.61 18.40 37.01 41.20 91.56 -7.20 -12.11 42.40 93.03
5.68 12.32 3.68 7.40 8.24 18.31 -1.44 -2.42 8.48 18.61
s
±0.69 ±1.57 ±0.66 ±1.37 ±0.52 ±1.21 ±1.09 ±1.83 ±0.39 ±0.89 27,00 28,54 40,23 41,30 13,99 14,78 168,51 168,58 10,23 10,72As for Helix aspersa 30-40 days old, the weight gains, as presented in Table 7., are negative this time belonging to snail raised in lot V3-E, a mean of -7.69±0.98% (corresponding to -2.48±0.33g) with a minimum of -11.76% or -3.85g and a maximum of -1.61% or -0.50g.
The 2-nd to the top numbers were obtained in the controll lot V1-M, a gain of 16.89±0.90% coresponding to 4.44±0.23g, the same lot were Helix pomatia 2 y.o registered a strong negative gain, a weight loss namely.
The 1-st to to top are the gains obtained on snails raised in lot V5-E, cuantified at 28.89±1.35% proportional gain standing for a gain of 7.93±0.31g, situation were we registered minimum of 23.06% or 6.55g and maximum of 37.62% or 9.95g.
Here is about time to bring to the reader’s attention the fact that the procentual values are much more relevant to „put on stage”, not only graphicaly as seen in Figure 5. but also, as it can be observed, by examining the rest of the graphics.
We can „feel” the magnitude of the procentual value that is always compared to the initial, starting point value, in our case, the initial snail’s weight.
140
Table 8. - Statistical Analysis on the snail’s growing rate dynamics at the end of 40 days of experimental feeding conditions - ANOVA TEST - Dunnett's Multiple Comparison Test on Weight Gain
Helix pomatia Linn. 2 years old
Experimental lots Mean Diff, q P < 0,05? Summary 95% CI of diff
V1-M vs V2-E (g) -25,200 100,61 Yes *** -25,840 to -24,560 V1-M vs V3-E (g) -9,8000 39,125 Yes *** -10,440 to -9,1595 V1-M vs V4-E (g) -22,815 91,084 Yes *** -23,455 to -22,175 V1-M vs V5-E (g) -12,025 48,007 Yes *** -12,665 to -11,385 V1-M vs V2-E (%) -28,52 99,08 Yes *** -29,26 to -27,78 V1-M vs V3-E (%) -9,700 33,70 Yes *** -10,44 to -8,964 V1-M vs V4-E (%) -24,09 83,71 Yes *** -24,83 to -23,36 V1-M vs V5-E (%) -11,58 40,23 Yes *** -12,32 to -10,84
Helix pomatia Linn. 1 year old
V1-M vs V2-E (g) -15,214 54,993 Yes *** -15,921 to -14,507 V1-M vs V3-E (g) -12,525 45,273 Yes *** -13,232 to -11,818 V1-M vs V4-E (g) -21,672 78,336 Yes *** -22,379 to -20,965 V1-M vs V5-E (g) -5,7720 20,864 Yes *** -6,4794 to -5,0646 V1-M vs V2-E (%) -15,214 54,993 Yes *** -15,921 to -14,507 V1-M vs V3-E (%) -12,525 45,273 Yes *** -13,232 to -11,818 V1-M vs V4-E (%) -21,672 78,336 Yes *** -22,379 to -20,965 V1-M vs V5-E (%) -5,7720 20,864 Yes *** -6,4794 to -5,0646
Helix aspersa Muller 1 year old
V1-M vs V2-E (g) 3.89 7.9475 Yes *** 2,6384 to 5,1416 V1-M vs V3-E (g) 6.915 14.128 Yes *** 5,6634 to 8,1666 V1-M vs V4-E (g) 0.915 1.8694 No ns -0,33656 to 2,1666 V1-M vs V5-E (g) -3.485 7.1201 Yes *** -4,7366 to -2,2334 V1-M vs V2-E (%) 14.909 8.2873 Yes *** 10,309 to 19,509 V1-M vs V3-E (%) 24.576 13.661 Yes *** 19,976 to 29,176 V1-M vs V4-E (%) 3.58 1.99 No ns -1,0202 to 8,1802 V1-M vs V5-E (%) -12 6.6703 Yes *** -16,600 to -7,3998
Helix aspersa Muller 30-40 days old
V1-M vs V2-E (g) 2 2.6597 No ns -0,036302 to 4,0363 V1-M vs V3-E (g) -2.56 3.4044 Yes * -4,5963 to -0,52370 V1-M vs V4-E (g) 7.12 9.4686 Yes *** 5,0837 to 9,1563 V1-M vs V5-E (g) -2.8 3.7236 Yes ** -4,8363 to -0,76370 V1-M vs V2-E (%) 4.92 3.4178 Yes * 1,0217 to 8,8183 V1-M vs V3-E (%) -5.99 4.1611 Yes ** -9,8883 to -2,0917 V1-M vs V4-E (%) 14.744 10.242 Yes *** 10,846 to 18,642 V1-M vs V5-E (%) -6.284 4.3653 Yes ** -10,182 to -2,3857
Performing ANOVA test and Dunnett's Multiple Comparison Test, on the gain values data obtained from Helix aspersa 30-40 days old snails, raised in the control lot V1-M and V2-E, V3-E, V4-E, V5-E lots, results as being presented in Table 8, we conclude that:
Comparing the gains values given in grams between V1-M and V2-E the results are no significant differences (ns) whereas comparing the percent values they are positive significant differences.
V1-M vs. V3-E the results are positive significant differences on gram values whereas the percent
values are positive distinctive significant differences.
V1-M vs. V4-E the results are positive highly significant differences on both type of values.
V1-M vs. V5-E results are positive distinctive significant differences on both type of values, grams or percent.
141 4. Conclusions
The terrestrial snails Helix pomatia Linn. and Helix aspersa Muller comport a different behavior, food selection, adaptation to enclosed lots, feed and weight gain is function of their environment they have been used to. The age, the degree of development, are also criterias that conduct to a different growing rate. In the snail farming conditions, the farmers must decide the species will make the object of their activity for the best performance and growing rate. It is known, as Avagnina in his work mentions [10] and is obvious from our study, that in the case of Helix aspersa we encount a very good adaptability not as high as the in the case of Helix pomatia 1 year old that was collected for the experiment from inside the farm. Helix pomatia 2 years old, registered a resistance to the enclosure of V1-M control lot, but it displayed a good weight gain in the lots that were provided with plans imported into the farm, the meal was, in this case we can assume, new to them and paletable. The plants that should predominate are the one that can grow in the soil and the weather conditions speific to the
particular area the farm is located. Perenial plants can be used but other particularities of snails breeding technics must be observed as well, such as reproduction, lots rotation for the regeneration of the soil, etc.
Plant species from the lots that registered the most weight gain can be used such as to satisfy the need of the snail along de different development stages when its apetite is always changing. Snails are attracted to plants given their inorganic chemical content [5] and perhaps to their protein content as well but it is not strict necessary since snails do feed with soil from where they aquire bacteria. Helix pomatia as well as Helix aspersa are also hosting bacterias [11] in their gut and intestines. Particular studies shows in Helix aspersa high levels of Enterococcus casseliflavus, [12] all known to be able to fix inorganic nitrogen.
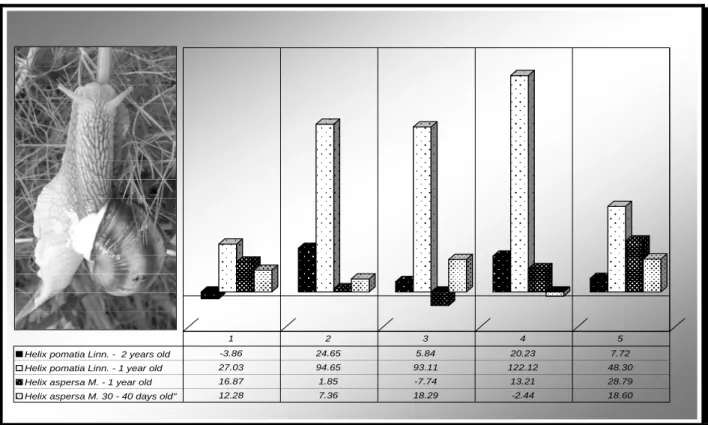
The percent values of weight gain are more relevant in expressing the dynamics (Figure 6.) of the results in case of populations that have very low initial weights, situations when one gram or two it can posibly mean double or triple the initial weight within even a relative short period of time.
Helix pomatia Linn. - 2 years old -3.86 24.65 5.84 20.23 7.72
Helix pomatia Linn. - 1 year old 27.03 94.65 93.11 122.12 48.30
Helix aspersa M. - 1 year old 16.87 1.85 -7.74 13.21 28.79
Helix aspersa M. 30 - 40 days old" 12.28 7.36 18.29 -2.44 18.60
1 2 3 4 5
142 Acknowledgements
Special thanks are being directed to a very special person, Eng. Otilia Buicu, which was constantly supporting the project and helped during populating, measurements and many other chores, not only during this particular research but the entire graduate school studies.
We thank to Mr. Horaţiu Bratosin and his family from Crăieşti, Cluj County, for allowing us to conduct the experiments inside the snail farm he owns as well as to Mr. Eugen Bărsan from Muntenii de Sus, Vaslui County for his snail farming know-how and for providing Helix aspersa snails for populating the experimental lots.
Furthermore, many special thanks are being directed to Mr. Adam Soch and to my dearest daughter Bianca Elisabeth Nicolescu for their non-stop encouragement. Our gratitude is directed to Pacific Services Network, Inc. for the entire financial support.
References
1. Lubell, D., Prehistoric edible land snails in the circum-Mediterranean: the archaeological evidence, In: Petits animaux et societes humaines du complement alimentaire aux resources utilitaires XXIV rencontres internationals d’archeologie et d’histoire d’Antibes, Ed. APDCA, 2004, pp. 77-88.
2. Meric, E., Sakinc, M., Ozdogan, F., Ackurt, F., Mollusc shells found at the Yarimburgaz Cave, In:Journal of Islamic Academy of Sciences 4:1, 1991, pp. 6-9.
3. Dalby, A., Food in the ancient world from A to Z, In: Publisher Routledge, 2003.
4. Chevalier, L., Desbuquois C., Le Lannic J., Charrier M., Poaceae in the natural diet of the snail Helix
aspersa Muller (Gastropoda, Pulmonata), Life Sciences 324, 2001, pp. 979-986
5. Chevalier, L., Le Coz-Bouhnik, M.,Charrier M., Influence of inorganic compounds on food selection by the brown garden snail Cornu aspersum (Muller) (Gastropoda, Pulmonata), Malacologia, 2003, 45(1) pp. 125-132
6. Toader-Williams, A., Helicicultura Biologică – Factorii de Risc Chimici în Siguranţa Alimentară
Asociată cu Creşterea Melcilor Comestibili, Bioterra Nr.1, 2009, pp. 19
7. Toader-Williams, A., Variations in Heavy Metal Contents in Milk and Incorporation of Global Positioning System (GPS) for Food Safety, Soil Chemicals and Agricultural Product Traceability (Legislation Proposal), Bulletin UASVM Agriculture, 66 (2)/2009, pp. 576.
8. GraphPad, address: http://www.graphpad.com 9. Ardelean, M., Principii ale metodologiei cercetării agronomice şi medical veterinare, Editura Academic Pres, Cluj Napoca, 2006, pp. 18-36
10.Avagnina, G., Snail Breeding-Intensive Snail Breeding Complete Production Cyle Trading, The International Snail Breeding Institute Cherasco, Cherasco, 2006, pp. 22-23
11. Charrier, M., Fonty, G., Gaillard-Martinie, B., M., Ainouche, K., and Andant, G., , Isolation and characterization of cultivable fermentative bacteria from intestine of two edible snails, Helix pomatia and Cornu aspersum (Gastropoda: Pulmonata), 2006, In: Bio Res 3, pp. 669-681