EXECUTIVE SUMMARY
High Resolution Delineation of Contaminant Concentrations,
Biogeochemical Processes, and Microbial Communities in
Saturated Subsurface Environments
SERDP Project ER-2419
FEBRUARY 2020 Dr. Andrew Jackson
Texas Tech
Dr. Paul B. Hatzinger
Aptim Federal Services
This report was prepared under contract to the Department of Defense Strategic
Environmental Research and Development Program (SERDP). The publication of this report does not indicate endorsement by the Department of Defense, nor should the contents be construed as reflecting the official policy or position of the Department of Defense. Reference herein to any specific commercial product, process, or service by trade name, trademark, manufacturer, or otherwise, does not necessarily constitute or imply its endorsement, recommendation, or favoring by the Department of Defense.
EXECUTIVE SUMMARY
Project: ER-2419
TABLE OF CONTENTS
Page 1.0 INTRODUCTION ... 1 2.0 OBJECTIVES ... 2 3.0 TECHNICAL APPROACH... 34.0 RESULTS AND DISCUSSION ... 4
4.1 PORE VELOCITY ESTIMATION ... 4
4.2 MICROBIAL COMMUNITY ANALYSIS AND CSIA OF CVOCS USING HRPP ... 5
4.3 FIELD DEPLOYMENTS ... 5
4.3.1 Fort Dix ... 5
4.3.2 Former Alameda Naval Air Station ... 6
4.3.3 USDA BARC Site ... 9
5.0 IMPLICATIONS FOR FUTURE RESEARCH AND BENEFITS ... 10
LIST OF FIGURES
Page Figure 1.1. Conceptual Model of Standard Sampling from Wells Compared to the Proposed Deployable HRPP... 2Figure 1.2. General Design of the HRPP ... 4
Figure 1.3. Relationship Between Pore Velocity and Measured HRPP Br- km Value Based on Lab Scale Flow Boxes Studies ... 5
Figure 1.4. Depth Distributions ... 7
Figure 1.5. Estimates of Groundwater Pore Velocity ... 8
Figure 1.6. Example Distributions of Microbial Populations Based on HRPP Micro-Biotraps, in Well Biotraps, and Well Water ... 8
Figure 1.7. Concentration Distribution Across Groundwater Transect ... 9
Figure 1.8. Concentration with Depth Based on HRPP Samples Across Groundwater Transect ... 10
ACRONYMS AND ABBREVIATIONS
δ13C Delta C Thirteen
µm Micron
BARC Beltsville Agricultural Research Center
BGS below ground surface
Br- Bromide
CH4 Methane
cis-DCE 1,2-dichloroethylene
Cl- Chloride
cm Centimeter
cm/d Centimeter per day
CSIA Compound specific isotope analysis
CVOC Chlorinated Volatile Organic Compound
EC Electrical conductivity
ECD Electron Capture Detector
HPT Hydraulic Profiling Tool
HRPP High Resolution Passive Profiler
Km Mass transfer coefficient
m Meter
MD Maryland
MIP Membrane Interface Probe
ml milliliter
NJ New Jersey
ORP Oxidative reductive potential
PFM Passive Flux Meter
qPCR Quantitative polymerase chain reaction
SERDP Strategic Environmental Research and Development Program
SO42- Sulfate
TCE Trichloroethene
TN Tennessee
TTU Texas Tech University
USDA U.S. Department of Agriculture
V/SA Volume/Surface Area
ACKNOWLEDGEMENT
The project team included Dr. Andrew Jackson (Texas Tech University (TTU)) who was responsible for leading the development of the direct insertion passive sampling tool, project coordination and reporting; and Dr. Paul Hatzinger (Aptim Federal Services) who led the field demonstration and development of the micro-biotraps. The project team gratefully acknowledges the financial and technical support provided for this project by the Strategic Environmental Research and Development Program (SERDP). The project team thanks Dr. Andrea Leeson for her guidance, and the support staff at Noblis for their administrative assistance. Major contributors to this work included Dr. Haley Schneider (TTU) who received her Ph.D. based on this work, Dr. Stephen Morse, who contributed to the structural analysis, Uriel Garza-Rubalcava and Dr. Danny Reible (TTU) who made substantial contributions to the modeling effort, and Graig Lavorgna, Paul Hedman, and Mark Tucker who provided significant field support (Aptim Federal Services).
1.0
INTRODUCTION
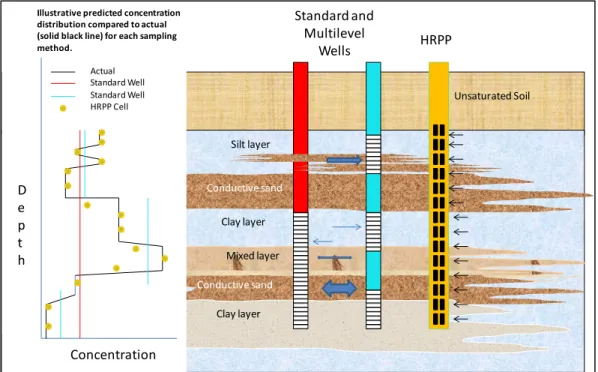
The ability to predict contaminant (e.g., chlorinated volatile organic compounds (CVOCs)) fate and transport in aquifers is often limited by the intrinsic heterogeneity associated with the flow field, contaminant distribution, and coupled biotic and abiotic reactions. Processes occurring in low permeability zones are particularly important, as studies have demonstrated that contaminants residing in such materials can sustain groundwater plumes and impede overall contaminant attenuation. While the importance of identifying these processes in heterogeneous media has been well documented, previously there has been no cost-effective tool for providing high resolution profiling of coupled contaminant, biogeochemical, and microbiological characteristics at the cm-scale. For example, the membrane interface probe (MIP) is only able to provide a semi-quantitative high-resolution vertical profile of contaminant concentration and the hydraulic profiling tool (HPT) can produce only a high-resolution vertical profile of aquifer permeability. High-resolution characterization recently has relied on tools such as multi-level discrete interval groundwater sampling devices. While these groundwater sampling tools are useful, they are not able to discern heterogeneity at a scale less than approximately 0.3 m, and installation of the groundwater wells needed to apply this technology can be cost prohibitive. Passive Flux Meters (PFMs) must be inserted within existing groundwater wells, but can provide high-resolution vertical profiles of both the hydraulic and contaminant fluxes. The application of techniques to evaluate microbial
communities in situ, such as Bio-Traps, suffer from similar constraints; only the microbial
community in the “bulk” groundwater is represented. Thus, although all the aforementioned techniques provide valuable information, with the exception of the MIP and HPT, they all require the installation of groundwater wells, and only characterize conditions within the well bore
(Figure 1.1). Thus, the ability to identify and measure these processes in situ is needed to provide
sufficient plume characterization, and to ultimately facilitate improved estimates of contaminant fate and transport.
A single tool that can be cost-effectively and rapidly deployed to measure the parameters discussed above at the cm-scale would be an important advance in site assessment technology. Such a tool could also be easily employed to produce data for remedial design and to assess remedial technology effectiveness. The project team’s approach was to develop a passive pore water sampling technology, the High-Resolution Passive Profiler (HRPP), that meets the above objectives. The basic technology was based on diffusion samplers (peepers). Peepers have been used to determine the vertical distribution of soluble constituents in saturated sediments/material. In general, they consist of a solid rod or plate with cells milled along the length. The cells are initially filled with pure water separated from the sediment by means of an appropriate membrane. The water in each cell passively equilibrates with the sediment pore water due to diffusion and, once equilibrated, the sampler is removed, and the water evaluated for species of interest. The rate of equilibrium is a function of the cell characteristic length (V/SA), the diffusion coefficient of the species of interest, resistance of the membrane, temperature of the system, groundwater velocity, and porosity of the sediment. Peepers can be made with many different geometries and can achieve cm-scale sampling resolution and produce samples with detection limits similar to those for groundwater sampling. The final resolution and sensitivity are functions of the cell volume required.
Figure 1.1. Conceptual Model of Standard Sampling from Wells Compared to the Proposed Deployable HRPP
While the use of peepers to delineate the distribution of contaminants and geochemical indicators is well developed in very shallow sediments, marshes, and surface waters, significant development and validation was required to apply the method in deeper applications such as groundwater aquifers. Further, the standard peeper technology cannot produce information beyond concentration data such as: microbial numbers and activity, groundwater and contaminant flux,
and contaminant degradation at cm-scale resolution. Development of samplers capable of
producing such a holistic set of characterization parameters with this level of resolution would be an enormous advantage over existing methods.
2.0
OBJECTIVES
The overall goal of this research was to develop and demonstrate a direct drive HRPP as a fine-scale delineation tool for the saturated subsurface. Focus was placed on discerning contaminant, microbiological, and biogeochemical differences between low permeability and high permeability zones within heterogeneous or stratified media. Specific objectives in the design and application of the HRPP were as follows:
1. Directly measure groundwater and contaminant flux at the cm-scale;
2. Quantify biogeochemical conditions at the cm-scale;
3. Assess microbial community structure and activity at the cm-scale;
4. Assess effectiveness for quantifying contaminant and biogeochemical processes in
heterogeneous saturated soils; and
Standard and Multilevel Wells Conductive sand Clay layer Clay layer Mixed layer Conductive sand Silt layer Unsaturated Soil HRPP Concentration D e p t h
Illustrative predicted concentration distribution compared to actual (solid black line) for each sampling method.
Actual Standard Well Standard Well HRPP Cell
5. Determine the extent to which the newly developed HRPP can be used to improve conceptual site models.
3.0
TECHNICAL APPROACH
The project combined lab-based development efforts with three field demonstrations. Lab studies were performed to develop a relationship between pore velocity and the mass transfer of a conservative tracer. Initial experiments were conducted in small scale flow boxes under well-controlled hydraulic regimes and small-scale prototype sampling devices. These experiments were
used to develop the basic correlation between the mass transfer of Br- from the cells and pore
velocity. The experiments evaluated the impact of equilibration time, velocity (0-100 cm/d), and sampler orientation with respect to flow direction. Additional experiments using a meso scale flow box were used to confirm the correlations developed for the full-size field samplers as well as the ability to measure velocity in layered systems with differing hydraulic conductivities.
Other laboratory experiments were used to demonstrate the ability of the samplers to use micro-biotraps (small compartments filled with Bio-Sep beads that serve as a matrix for bacterial growth) to measure the microbial community composition, as well as to conduct stable isotope analysis of adsorbed CVOCs to assess whether degradation is occurring in an aquifer. Small scale flow boxes consisting of two layers of differing hydraulic conductivity were equilibrated with trichloroethene (TCE), a culture of reductive dechlorinating bacteria and edible oil as a substrate. Once reductive dechlorination was documented consistently in the low permeability layer, prototype HRPP samplers were installed and allowed to equilibrate. Bio-Sep beads placed in the HRPP samplers were removed and sent for commercial analysis (Microbial Insights Knoxville, TN) of the microbial community using a quantitative polymerase chain reaction (qPCR) array designed for
assessing chlorinated solvent degrading communities in aquifers and δ13C analysis of adsorbed
CVOCs using compound specific isotope analysis (CSIA). Field experiments included initial testing of the micro-biotraps in wells at Fort Dix (NJ) and Kelley Air Force Base (TX) to measure microbial community abundance and CSIA of CVOCs as well as three field deployments of the full scale HRPP. Prototype HRPP samplers with micro-biotraps containing BioSep beads, activated carbon, and silver impregnated activated carbon were equilibrated in wells. Adsorptive media were sent to Microbial Insights for microbial community analysis and CSIA of adsorbed CVOCs.
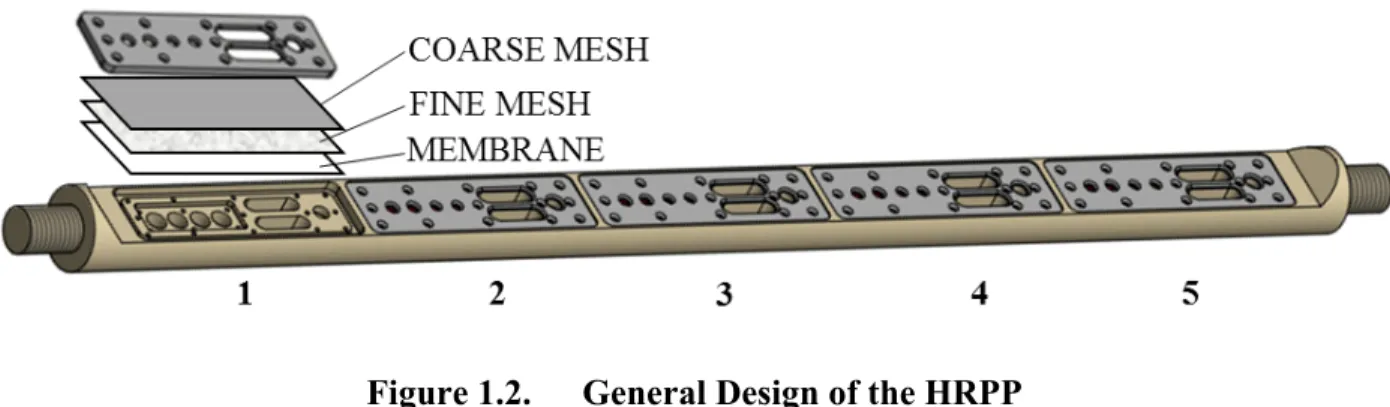
Full-scale field-deployable HRPPs were deployed at three CVOC sites. The general design of an HRPP is provided in Figure 1.1. After each field test, a review was conducted to evaluate the HRPP performance and usability. The results of each field test were used to optimize the design of the next generation. The HRPP design was based on: (1) incorporating the volume requirements established during laboratory and preliminary field tests for aqueous samples and Bio-Sep beads; (2) optimizing the volume/area ratios and spacing of the cells used to estimate groundwater velocity; and (3) improving structural integrity to prevent physical deformation of the structure HRPP during insertion. Each HRPP version (labeled A, B, and C) was capable of measuring concentrations of dissolved species in pore water, groundwater velocity, microbial community abundance and composition, and stable isotopic composition of CVOCs.
Figure 1.2. General Design of the HRPP
The general design of the HRPP includes five cells sets over four-foot length, coarse stainless-steel mesh, fine nylon mesh, and 0.45 µm membrane attached with a cover plate and screws. HRPP was manufactured from a 2.5” stainless steel rod and was threaded on each end to allow it to be coupled to
other HRPP units or a direct drive device.
The HRPPs were tested in three sequential field trials. The first field trial took place at Fort Dix (NJ) in September 2015. Two HRPP-first generation (HRPP-A) samplers were installed and data were compared to nearby monitoring wells data and standard Bio-Traps. Design modifications were made to the HRPP, and the second generation (HRPP-B) was tested a year later at the former Alameda Naval Air Station in Alameda, California. HRPP-A and HRPP-B samplers were deployed at Alameda, and the resulting data were once again compared to nearby monitoring well data, standard Bio-Traps, data from a MIP/HPT deployment, and soil core data. Upon completion of the Alameda deployment, additional design changes were made and the new version (HRPP-C) was deployed at the U.S. Department of Agriculture (USDA) Beltsville Agricultural Research Center (BARC) site (MD). At the BARC site, HRPP-B and HRPP-C samplers were deployed along a contaminated groundwater flow transect across a biowall. Data from the HRPP were compared to well data and in well Bio-Traps.
4.0
RESULTS AND DISCUSSION
4.1 PORE VELOCITY ESTIMATION
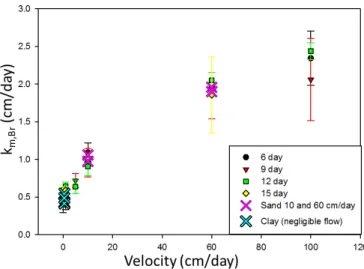
Data from laboratory studies showed a strong correlation between the mass transfer of Br- from
the HRPP sampler and pore velocity. The technique used variation in specific surface area of HRPP velocity cells to produce variations in equilibrium with a single deployment interval. The variation
in Br- equilibrium with respect to specific surface area was used to determine the Km of Br-. By
evaluating the change in Km with pore velocity in controlled experiments, the project team
developed a relationship (Figure 1.3) to predict pore velocity from the measured Br- Km value.
The project team also tested the impact of sampler orientation and equilibration time and found neither impacted the developed correlation. The technique is able to estimate pore velocity between 3-100 cm/d. Velocities below 3 cm/d cannot be differentiated from the zero-velocity case.
After development of the Km pore velocity relationship, the project team used large meso-scale
flow boxes and tested the full-scale field deployable HRPP samplers. Samplers were directly inserted into the flow box that was packed with two layers (sand and sandy clay) of material with differing hydraulic conductivities. Using tracers, the project team measured the flow in each layer and compared the pore velocity to that measured by the HRPP. Predicted velocities in the sand and
Figure 1.3. Relationship Between Pore Velocity and Measured HRPP Br- km Value
Based on Lab Scale Flow Boxes Studies
Verification of relationship overlaid as “X” symbols using full scale HRPP samplers and mesoscale two-layer flow box system for 10 and 60 cm/day velocity through sand two-layer and negligible flow in clay two-layer.
4.2 MICROBIAL COMMUNITY ANALYSIS AND CSIA OF CVOCS USING HRPP
Results from multiple studies and sites supported the ability of the samplers to measure the relative densities of a variety of different bacteria, including many known to be involved in reductive dechlorination. Microbial community population abundances detected on Bio-Sep beads were similar to in-well standard Bio-Trap samplers (Microbial Insights, Knoxville, TN). While some small differences were observed, there was no systematic variation between micro-biotraps in the
HRPP units and traditional Bio-Traps. The δ13C values measured for chlorinated ethenes adsorbed
on Bio-Sep beads emplaced in the HRPP units were also comparable (within ~1 ‰) to standard in-well Bio-Traps. These proof of concept studies were supported by laboratory studies that evaluated the microbial community and CSIA changes in a two-layer flow box in which reductive dechlorination was occurring. Micro-biotraps in protype HRPPs were able to measure changes in microbial populations with depth even though the total depth of both layers was < 60 cm. Populations of bacteria capable of reductive dechlorination were at higher abundance in the low permeability layer than more oxidized high permeability layer, while oxidative co-metabolic genes
were more prevalent in oxic layers. The δ13C values measured for chlorinated ethenes (TCE, cis
-DCE, and VC) for both pore water and micro-biotraps were comparable.
4.3 FIELD DEPLOYMENTS
4.3.1 Fort Dix
Three generations of HRPP samplers (HRPP-A, B, and C) were sequentially field tested to validate the HRPP performance against traditional site assessment techniques, with the results of each field test used to update the design. The first-generation sampler (HRPP-A) was tested at Ft. Dix, NJ. This field
Samplers were able to produce concentration profiles of geochemical parameters and CVOCs (cis -DCE and VC were present) at high resolution (~20 cm). Concentrations of CVOCs were comparable to nearby wells, taking into consideration the relatively long well screens of the monitoring wells and distance between wells and HRPP locations. HRPP samplers were also successfully able to measure relevant microbial populations and stable isotope composition of
CVOCs (cis-DCE and VC). Generally, HRPP samplers were not only consistent with each other,
but also with data from well water and Bio-Traps. HRPP samplers measured velocities ranging from 1 to 10 cm/day. The estimated average annual velocity across the site is 7.5 cm/day based on hydraulic gradient, a rate that is within the range of velocities estimated by HRPP. The similarities of measured velocities with depth for both HRPP at two different locations, as well as the similarity to the average site formation, support the ability of the HRPP to estimate velocity.
4.3.2 Former Alameda Naval Air Station
Two sets of three coupled HRPP-B samplers (3.7 m) and one HRPP-A sampler were installed in a source zone to a depth of ~8 m BGS at Alameda. Data from HRPPs were compared to HPT/MIP data, core extractions, standard monitoring wells (including deployment of Bio-Traps and PFMs), and multiple depth interval well screens (multi-level wells) taken at the time of insertion.
Geochemical Indicators - HRPP samplers produced consistent and reproducible Cl- and SO
4-concentration profiles at both locations. Profiles were similar to one of the depth discrete multi-level wells, but significant concentration differences were observed between multi-multi-level wells at similar depths located within a few meters of each other. Thus, the site displayed significant local variability. In addition, standard monitoring well concentrations were generally different than both HRPP and multi-level wells. Observed variations were most likely due to well screens sampling from more hydraulic conductive zones and potentially vertical short circuiting.
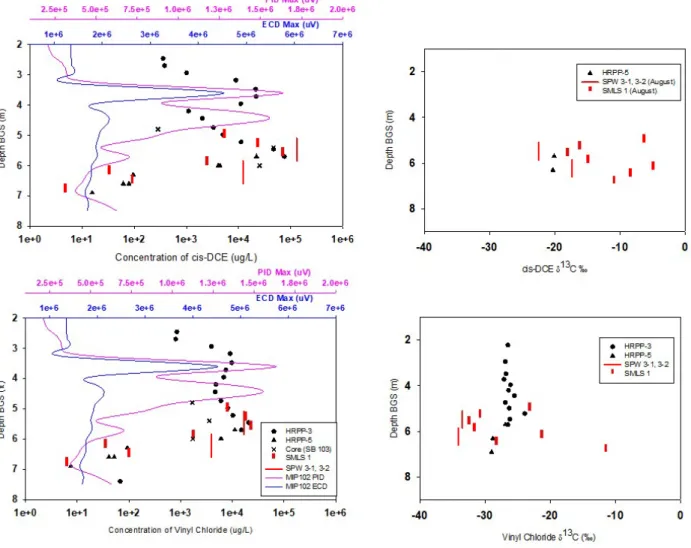
CVOC Concentration Profiles - CVOC concentration profiles were remarkably similar to those produced by multi-level wells, HRPP samplers, and soil cores (Figure 1.4). All three methods
produced concentration profiles that exhibit sharp peaks in cis-DCE and VC at 5.8 m BGS, with
concentrations decreasing by orders of magnitude within <1 m. HRPP profiles also reflect an
additional zone of elevated CVOC concentrations at ~4 m BGS (near the peak Cl- and SO4-2
concentration). This finding is reflected in soil cores but not well water, because no existing wells were screened across that depth interval. This shallower peak also coincides with a zone of low permeability sediment identified in field inspections of cores. Standard monitoring wells (SPW3-1, SPW3-2, and PEW 02) generally had concentrations that matched the average HRPP concentrations and vertical discrete well intervals over the depth the standard wells were screened. Overall, the CVOC concentrations captured with the HRPPs reproduce the same concentration profiles created by multilevel wells and soil core samples. CVOC concentrations captured with HRPPs also generally matched standard monitoring well concentrations, but the HRPPs had higher resolution capabilities and therefore created more complete concentration profiles than standard wells. There was generally poor agreement between qualitative MIP profiles and any other data sets.
The δ13C of VC was consistent with depth for all HRPP micro-biotrap samples (~ -25 ± 2 ‰)
(Figure 1.4). Values were also within the range of those measured in samples from well water
for one of the HRPPs (HRPP-3) deployed at Alameda, due to an apparent analytical issue at the stable isotope laboratory. Values for the other HRPP (HRPP-3) were similar to local well water samples and in the range of some of the multilevel well samples, although as with VC, these values showed significant variability. Most importantly, the deployment showed that enough CVOC can be captured in a three-week deployment to conduct standard CSIA analysis, and that, excluding
the anomalous cis-DCE data, the values are reasonable and consistent.
Figure 1.4. Depth Distributions
(Left Panels) Depth distributions of CVOCs measured by HRPP, vertical discrete wells (SMLS 1), standard wells (SPW 3-1,2), soil cores, and MIP at one location. (Right Panels) The δ13C of VC and
cis-DCE based on well water, in well Biotraps, and HRPP micro-biotraps.
Velocity Results-Comparative velocity measurements at the Alameda site included an
estimated average site velocity, MIP/HPT data, and PFMs installed in the standard monitoring wells (Figure 1.5). The site average velocity based on hydraulic head difference is two cm/day. The PFMs measured velocities of 3-8 cm/day, in various wells. HRPP velocity estimates ranged from 1 to 8 cm/day based on depth and location. In general, the HRPP intervals with
The HRPP velocity measurements were similar to those estimated by other methods (MIP/HPT, PFMs, etc.), whether qualitative or quantitative. The HRPP is not susceptible to interferences that can affect other methods of measuring velocity, such as high salinity for the MIP-EC.
Figure 1.5. Estimates of Groundwater Pore Velocity
Estimates of groundwater pore velocity based on HRPP and PFMs compared to qualitative results from HPT at one location and overall site average based on pumping tests.
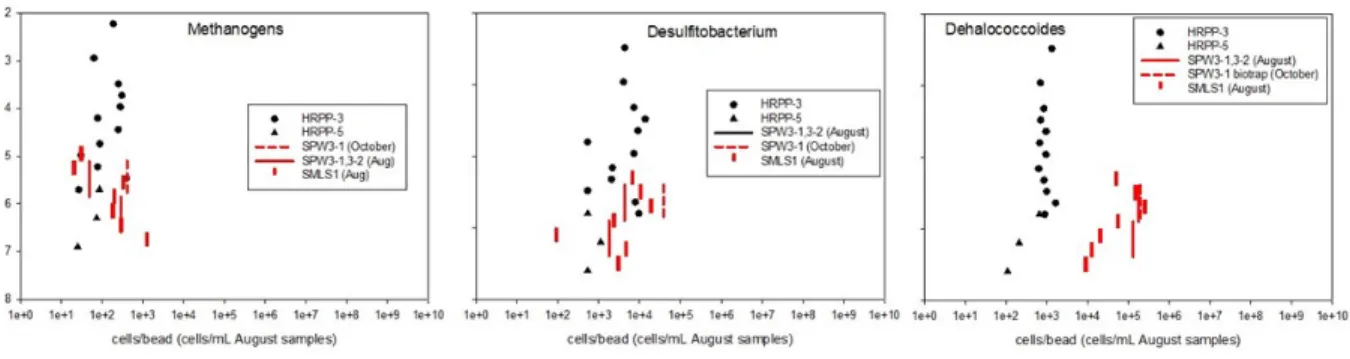
Microbial Community Analysis - HRPP micro-biotraps, well water, and in well Biotraps all
generally detected similar species/genes (see Figure 1.6 for examples). There were no consistent
patterns between the abundances (cells or genes) measured by each technique with well water abundances (cells or genes/ml) greater or lesser than in well Biotraps or micro-biotraps (cells or genes/bead) dependent on the specific species. The lack of a consistent pattern suggests differences may reflect relative abundances in pore water compared to sediment. Overall, the HRPP micro-biotrap was capable of quantifying a wide suite of microbial species, and indicated population/gene differences in some instances that may reflect microbial communities in well water vs those present on the sediments that contact the HRPPs.
Figure 1.6. Example Distributions of Microbial Populations Based on HRPP Micro-Biotraps, in Well Micro-Biotraps, and Well Water
4.3.3 USDA BARC Site
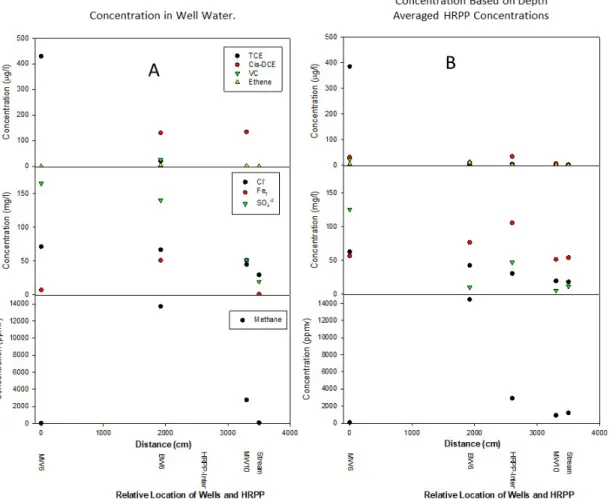
HRPPs were placed along a groundwater transect near an old landfill and upgradient of a mulch biobarrier, within a mulch biobarrier, and then downgradient of the biobarrier into a small stream where plume discharge was hypothesized. In general, at individual sites along the contaminated groundwater transect, data were comparable between well samples (water and Bio-Traps) and HRPP discrete depth samples. Using either the HRPP depth averaged or maximum concentrations
of Cl-, CVOCs, and CH4, the overall trend in concentration change as well as concentration along
the transect was very similar to well data (Figure 1.7). Based on HRPP data, compared to well water or well Bio-Traps, populations of bacteria capable of reductive dichlorination were generally higher and more species were present along the transect, supporting the observed continued reduction in CVOCs and increased presence of VC and ethene in the biowall. This difference may reflect bacteria present on sediments (HRPP) vs planktonic cells in groundwater (well water and standard Bio-Traps). HRPP depth-averaged porewater velocities ranged from 2 to 8 cm/d, which were similar to estimates from slug tests, pumping tests, and tracer tests. (2 to 5 cm/d). Conclusions based on average or maximum HRPP values would be similar to those for well water, except that CVOC degradation appeared to be more complete and there appears to be continued loss of CVOCs downgradient of the biowall.
However, while well data or HRPP data used to assess the efficacy of the mulch biowall for treating CVOCs generally leads to similar “gross” conclusions, there are also a number of important differences. In the upgradient area, data from well water only would not predict the large change in CVOC concentration with depth or in an observed clay layer (Figure 1.8). In the biowall, well
data would predict cis-DCE breakthrough across the whole biowall depth rather than through a
relatively small high permeability zone (Figure 1.8). Well data from the biowall would also predict
that reductive dechlorination is generally incomplete and bacteria capable of reducing cis-DCE are
not present, while HRPP data supports a model of complete degradation except in the high permeability zone. The high velocity zone appears to exist across the transect downgradient of the biowall based on velocities with depth, profiles that largely overlap with presence of CVOCs downgradient of the biowall. Due to the assumption that well water represents the average concentration across the well screen, calculated fluxes at each location based on well water would be much higher than those based on depth discrete CVOC concentration and velocity profiles. Although CVOCs are present at depths below the stream and in adjacent wells, no CVOCs appear to be upwelling into stream water; this observation could not be supported from well data alone,
given the concentrations of cis-DCE in MW10. Thus, the HRPP data provided new insights into
the behavior of the plume and its level of treatment at the BARC site.
Figure 1.8. Concentration with Depth Based on HRPP Samples Across Groundwater Transect
5.0
IMPLICATIONS FOR FUTURE RESEARCH AND BENEFITS
During this Strategic Environmental Research and Development Program (SERDP) project, the project team developed and validated a modified peeper design (HRPP) capable of providing information far beyond concentration data, including microbial numbers and activity, groundwater and contaminant flux, and contaminant degradation at dm-scale resolution. Samplers capable of producing such a holistic set of characterization parameters with this level of resolution will be an enormous advantage over existing methods and should lead to higher fidelity site models, more tailored design of remediation activities, and improved remedial performance evaluations. Further, the tool allows monitoring and assessment of difficult contaminated formations such as thin
Concentration (g/l) 0 200 800 D ept h Bel ow C om m on D at um (c m ) 0 100 200 300 400 500 600 Concentration (g/l) 0 50 100 150 200 250 Concentration (g/l) 0 50 100 150 200 250 TCE cis-DCE VC Ethene Concentration (g/l) 0 50 100 150 200 250 Concentration (g/l) 0 50 100 150 200 250 MW-6 BW6 HRPP-Inter MW-10 Stream
The new tool can be relatively easily deployed similar to other direct drive tools and can provide data to guide source zone assessment, well placement, rebound potential from low permeability zones, homogeneity and extent of bioaugmentation/stimulation efforts, or other remedial activities. The HRPP tool is currently ready for commercialization. The application of the tool could easily be provided by any number of consultants or field service companies. Commercialization will most likely be dependent on establishing the benefits of the HRPP with site managers and regulators who can then encourage its use to improve site characterization, site conceptual models, and impact of remedial activities. At the time of this writing, the NAVY was further evaluating the tool’s capabilities; additional demonstrations through the ESTCP program would also facilitate its adoption by further demonstrating its utility.