Vol.3, No.1 (2009) 11–17
A BRIEF SURVEY ON THE COMPUTER SCIENCE PROGRAMS IN THE UK HIGHER EDUCATION SYSTEMS
S. FOWLER
School of Engineering and Applied Science, Aston University, Aston Triangle Birmingham, B4 7ET, United Kingdom
[email protected] N. YAMADA-F
Protein Damage and Systems Biology Research Group, University of Warwick Coventry, CV2 2DX, United Kingdom
Abstract: The recent decline in computer science (CS) majors has been a great concern in the UK higher education systems. The trend is multifactorial, and one cannot simply assume the influence of job market since IT job projections are positive despite the global economic downturn. The more liable explanation could be a negative perception of computer science fields in the young people who have fear of failing the program. In this brief survey, we took a snapshot of the CS programs in the UK higher education thereby identifying the underlying problems. In order to make numerical evaluations, we analyzed data from Guardian University guide 2010: University league table published in 2009. As gauge of quality of program, we chose Career Prospects, Expen-diture per Students, % Satisfied with Teaching, % Satisfied with Assessment, Student/Staff ratio and Average Entry Tariff. The results illustrated the current situation of CS programs in the UK universities.
Keywords: UK Higher Education; Computer Science; Enrollment
1. Introduction
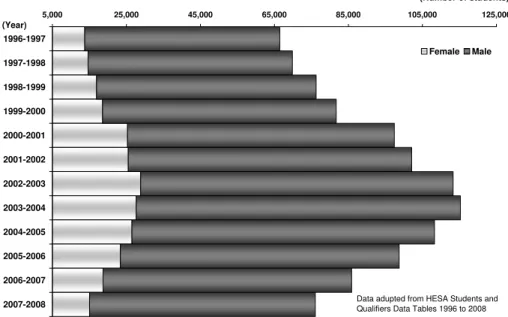
In the UK higher education, the number of students studying computer science (CS) has been dramatically declining after the crush of dot-com boom (Figure 1). Consequently, it has been a great concern that there will be a severe shortage of CS graduates to meet the demand for the employment in the IT industry, which is predicted to be growing for the next decade in the UK on an average of 141,300 new entrants a year1
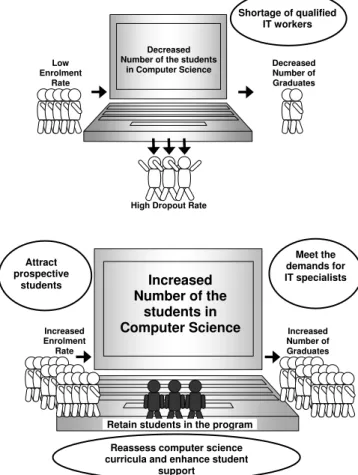
. The decreased student number in the CS programs is due to the combination of the low applications at the entrance and the high drop-out rates during the course 2. This trend seems to be common in the other EU countries as well as in the US. Therefore, CS programs need to seek strategies to prevent the cascade of events; the low application number, the high drop-out rate, and the subsequent low number of graduates with CS degree and the shortage of skilled IT workers (Figure 2). In this paper, we will take a snapshot of the current situations
5,000 25,000 45,000 65,000 85,000 105,000 125,000 1996-1997 1997-1998 1998-1999 1999-2000 2000-2001 2001-2002 2002-2003 2003-2004 2004-2005 2005-2006 2006-2007 2007-2008 (Year) (Number of students) Female Male
Data adupted from HESA Students and Qualifiers Data Tables 1996 to 2008
Fig. 1. Number of Students in Computer Science Program in UK Higher Education Institutions.
in the CS programs in the UK higher education, thereby identifying the underlying problems.
2. Methods
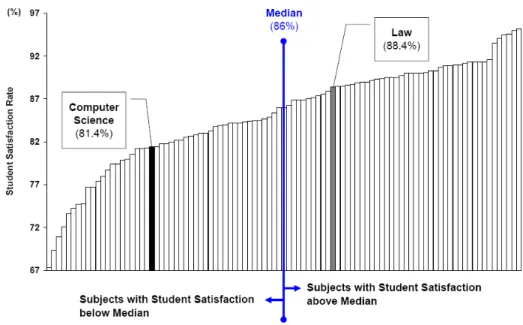
Guardian University guide-University league table 20103published May 12th 2009, contains information for the prospective students who are starting university in the 2009-10 academic year, and we utilized the data to numerically evaluate the CS programs in UK universities. The University league table is one of the most popu-lar information sources for students in the UK when they are making decisions on university applications. It covers all full-time, undergraduate courses at higher ed-ucation institutions in England, Scotland, Wales and Northern Ireland. The league tables are compiled for the Education Guardian by Campus Pi at Brunel Univer-sity based on publicly available data from the Higher Education Statistics Agency (HESA) 2006/07 as well as the National Student Survey 2008 (NSS). The data refers to undergraduate students as full-time equivalents (FTE). The subject tables were sorted out by each subject area. In this paper, data from all universities in the UK which provide CS degree were summarised. To perform statistical analysis, we chose law degree programs as reference. We performed Student’s t-test, two-sample unequal variance. The results were expressed as mean±standard error of the mean (SEM). Total of 98 universities provide CS programs, while 89 universities provide law degree programs. Similarly to CS programs, law degree programs are vocation-ally oriented and highly demand students’ commitment. Nonetheless, law degree programs appear to maintain students’ satisfaction (Figure 3). The comparison
be-Increased Number of the students in Computer Science Attract prospective students
Reassess computer science curricula and enhance student
support
Retain students in the program Increased Enrolment Rate Increased Number of Graduates Meet the demands for IT specialists Decreased
Number of the students in Computer Science Low Enrolment Rate Decreased Number of Graduates
High Dropout Rate
Shortage of qualified IT workers
Fig. 2. Preventing a shortage of IT Professionals.
tween these two programs would provide us useful information as a snapshot of overall CS programs in the UK from the students’ prospective.
3. Results
The tested variables were Career Prospectsa, Expenditure per Studentsb, % Satisfied with Teachingc
, % Satisfied with Assessmentd
, Student/Staff Ratioe
and Average a
“Career Prospects” is the proportion in graduate level employment or full-time study after six months, taken from HEFCE destinations 2006/07.
b
“Expenditure per Student” is the amount of money spent per FTE over two years. The actual data are not give but scored out of 10.
c
“Percentage Satisfied with Teaching” is the percentage of ’definitely agree’ and ’mostly agree’ responses to the four questions regarding teaching from the NSS data.
d
“Percentage Satisfied with Assessment” is the percentage of ’definitely agree’ and ’mostly agree’ responses to the five questions about assessment and feedback from the NSS data.
e
“Student/Staff Ratio” is simply the ratio between the number of the students vs. and that of staffs.
Fig. 3. UK University Student Satisfaction in Each Subject 2008.
Entry Tarifff .
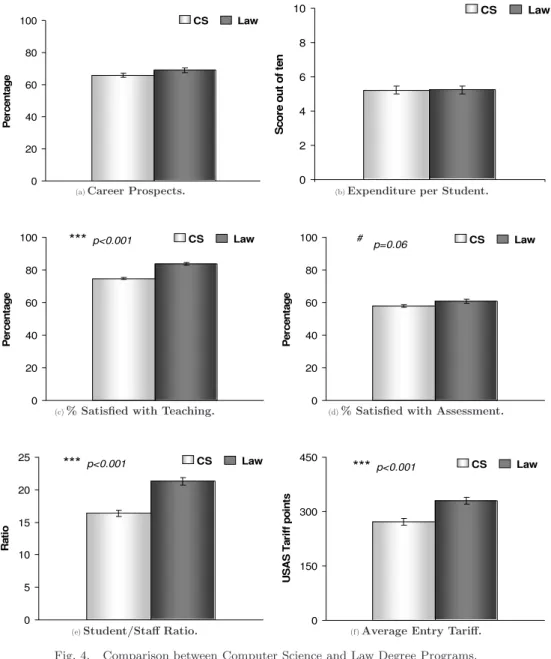
Career Prospects: The career prospects of CS and law degree programs are equally high, and there was no statistical difference between the two subject areas (Figure 4(a)). The average of the career prospects across the universities in CS was 66±1 % where the highest was 91% in Durham University, whereas that in law degree programs was 69±1 % where the highest was 95% in London School of Economics. This result was as expected, but the question arose is why there is a large difference between the programs when it comes to the popularity among the students, given that career prospects are important criteria when a student decides her/is major.
Expenditure per Students:There was no difference in the expenditure per students between CS and law degree programs (Figure 4(b)). However, this does not automatically mean that CS expenditure for undergraduate teaching is as sufficient as that of law degree programs. Generally, science and technology courses require more materials and equipments for lab/practicum classes in comparison to the lib-eral art courses. Indeed, CS courses are not exceptional, and computers and other f
“Average Entry Tariff” is the average student UCAS tariff points for first-year first degree en-trants. The UCAS Tariff is the system for allocating points to qualifications used for entry to higher education. Universities and colleges use the UCAS Tariff to make comparisons between ap-plicants with different qualifications. Tariff points are often used in entry requirements, although other factors are often taken into account.
related consumables require larger funding in order to provide up-to-date knowl-edge and skills to the students. Taking that into considerations, the result may be interpreted that CS expenditure for undergraduate teaching is rather inadequate.
0 20 40 60 80 100 P e rc e n ta g e CS Law
(a)Career Prospects. 0
2 4 6 8 10 S c o re o u t o f te n CS Law
(b)Expenditure per Student.
0 20 40 60 80 100 P e rc e n ta g e *** p<0.001 CS Law
(c)% Satisfied with Teaching. 0
20 40 60 80 100 P e rc e n ta g e CS Law # p=0.06
(d)% Satisfied with Assessment.
0 5 10 15 20 25 R a ti o CS Law *** p<0.001
(e)Student/Staff Ratio.
0 150 300 450 U S A S T a ri ff p o in ts CS Law *** p<0.001
(f)Average Entry Tariff.
Fig. 4. Comparison between Computer Science and Law Degree Programs.
% Satisfied with Teaching and Assessment:The student satisfaction with teaching in CS programs (Figure 4(c)) was significantly lower than that in law de-gree programs (p<0.001). While the Law students’ average teaching satisfaction
In addition, there was a trend that the CS students were less satisfied with the assessment and feedback in the CS courses (Figure 4(d)), though it was not sta-tistically significant (p=0.06). These results may at least partially explain why the
high drop-out rates as well as unpopularity of the CS programs. Improvement of the quality of teaching cannot be achieved solely by individual instructor’s effort. Rather, we should re-evaluate and improve current CS curriculum to meet the stu-dents’ need and provide adequate support to prevent the drop-out, while making it more appealing to new coming students as suggested by ACM4
.
Student/Staff Ratio:Interestingly, the average of student to staff ratio in CS programs across the UK universities (Figure 4(e)) was significantly lower than that in law degree programs (p<0.001). In theory, one staff is available for every 16±1
students in the CS program, whereas 21±1 students in the law program have to share one staff. Nonetheless, the percentage satisfied with teaching was lower in the CS program. These results may seem to be paradoxical, but it is again, likely due to the difference between the natures of the science/technology versus liberal art courses. A class of sixteen students for a programming course may not be ideal where hands on practice is necessary, while a class of twenty-one students for a property law lecture might be adequate.
Average Entry Tariff:The entry tariff (The UCAS Tariff) is the system for allocating points to qualifications used for entry to higher education. Universities and colleges use the UCAS Tariff to make comparisons between applicants with different qualifications. Thus, this value would somewhat reflect students’ academic skills and degree of commitment before the entrance to the programs. The average entry tariff of the CS students across the UK universities (Figure 4(f)) were sig-nificantly lower than that in the law degree students (p<0.001). The average entry
tariff points for CS programs were 272±9, whereas those in law degree programs were 330±10. The results may be extrapolated that students applying for the law degree programs are academically more prepared and possibly more determined comparing to the CS applicants at the entry to higher education. Indeed, one can-not simply make such an assumption, but students drop-out from CS courses often mention that “the course was harder than I was expecting.”5
.
4. Discussion and Conclusion
Utilizing the data from Guardian University guide-University league table 2010, we took a snapshot of CS programs in the UK higher education. We compared the data set with that of law degree programs as reference. Similarly to CS programs, law degree programs are vocationally oriented and highly demand students’ com-mitment, however, they maintain students’ satisfaction and popularity unlike CS programs. Thus, the comparison helped us to clearly illustrate current problems in CS programs, which then, would provide us useful information for reassessing the curriculum of CS programs.
decide their university majors. Particularly in this global economic downturn, good career prospects would surely attract prospective students to the CS programs. Indeed, in the UK, the perpetual decline of application number to the CS program was finally ended in 2008 6. In the same year, CS program application in the US and Canada was increased by 8.1% comparing to the previous year7
. However, this does not entirely solve the skilled-IT-worker shortage. When the economy recovers, the good career prospects of CS major will no longer be appealing to students and the enrolment will drop again. Furthermore, without an intervention, drop-out rates of CS program will keep rising.
The first step for the intervention is to clearly recognize current problems. Our analysis pictured several problems of the current CS programs in the UK higher educations. A rather simplified depiction would be as following. A certain portion of the students is enrolled in the CS programs simply because of its good career prospects. Often, they are not well prepared for university level CS programs at the entrance and their academic skills need some improvement. Nonetheless, the curriculum was not tailored for those students, and they are not satisfied with the teaching. The class size and expenditure per students are not adequate for a science/engineer subject, and therefore, CS departments can not provide sufficient academic support for the students. As a result, the students find the classes are too hard and many of them drop-out during the course. To reverse this vicious cycle, our next step would be to reassess and tailor the curricula for the target populations, and enhance academic support for the students.
References
1. Technology Counts, IT & Telecoms Insights, January 2008, Report by e-Skills UK, http://www.e-skills.com/Research-and-policy/Insights-2008/2179.
2. Staying the course: the retention of students in higher education, Report by National Audit Office, July 27th2007, http://www.nao.org.uk/publications/0607/student ret ention in higher ed.aspx.
3. Guardian University guide-University league table 2010, Published by Guardian News & Media Limited,May 12th2009, http://www.guardian.co.uk/education/table/2009 /may/12/university-league-table.
4. P.J. Denning, and A. McGettrick, Recentering Computer Science, Commun. ACM vol. 48, no. 11, November 2005, pp. 15-19.
5. Kinnunen, P. and Malmi, L. Why Students Drop Out CS1 Course?, International Computing Education Research (ICER’06), Canterbury, UK, September 9-10th2006. 6. Provisional final figures for 2008 entry, Reported by Universities & Colleges Admis-sions Service (UCAS), October 15th2008, http://www.ucas.ac.uk/website/news/me dia releases/2008/2008−10−15.
7. Stuart Zweben, Computing Degree and Enrolment Trends from the 2007-2008 CRA Taulbee Survey, Undergraduate Enrollment in Computer Science Trends Higher; Doctoral Production Continues at Peak Levels, Reported by Computing Research Association (CRA), http://www.cra.org/info/taulbee/CRATaulbeeReport-StudentEnrollment-07-08.pdf