*For correspondence: [email protected]. edu (XZ);
[email protected]. edu (PJC)
Competing interest:See page 18
Funding:See page 18 Received:09 October 2018 Accepted:25 July 2019 Published:25 July 2019 Reviewing editor: Andrew P Morris, University of Liverpool, United Kingdom
Copyright Parker et al. This article is distributed under the terms of theCreative Commons Attribution License,which permits unrestricted use and redistribution provided that the original author and source are credited.
Identification of an
emphysema-associated genetic variant near
TGFB2
with regulatory effects in lung fibroblasts
Margaret M Parker
1, Yuan Hao
1, Feng Guo
1, Betty Pham
1, Robert Chase
1,
John Platig
1, Michael H Cho
1,2, Craig P Hersh
1,2, Victor J Thannickal
3,
James Crapo
4, George Washko
2, Scott H Randell
5, Edwin K Silverman
1,2,
Rau´l San Jose´ Este´par
6, Xiaobo Zhou
1*, Peter J Castaldi
1,7*
1
Channing Division of Network Medicine, Brigham and Women’s Hospital, Boston,
United States;
2Division of Pulmonary and Critical Care Medicine, Brigham and
Women’s Hospital, Boston, United States;
3Division of Pulmonary, Allergy and
Critical Care, Department of Medicine, School of Medicine, University of Alabama
at Birmingham, Birmingham, United States;
4Division of Pulmonary, Critical Care
and Sleep Medicine, National Jewish Health, Denver, United States;
5Marsico Lung
Institute, The University of North Carolina at Chapel Hill, Chapel Hill, United States;
6
Applied Chest Imaging Laboratory, Brigham and Women’s Hospital, Boston,
United States;
7Division of General Internal Medicine and Primary Care, Brigham
and Women’s Hospital, Boston, United States
Abstract
Murine studies have linked TGF-bsignaling to emphysema, and human genome-wide association studies (GWAS) studies of lung function and COPD have identified associated regions near genes in the TGF-bsuperfamily. However, the functional regulatory mechanisms at these loci have not been identified. We performed the largest GWAS of emphysema patterns to date, identifying 10 GWAS loci including an association peak spanning a 200 kb region downstream fromTGFB2. Integrative analysis of publicly available eQTL, DNaseI, and chromatin conformation data
identified a putative functional variant, rs1690789, that may regulateTGFB2expression in human
fibroblasts. Using chromatin conformation capture, we confirmed that the region containing rs1690789 contacts theTGFB2promoter in fibroblasts, and CRISPR/Cas-9 targeted deletion of a~
100 bp region containing rs1690789 resulted in decreasedTGFB2expression in primary human
lung fibroblasts. These data provide novel mechanistic evidence linking genetic variation affecting the TGF-bpathway to emphysema in humans.
DOI: https://doi.org/10.7554/eLife.42720.001
Introduction
associations with these distinct LHE patterns (Castaldi et al., 2014). However, the mechanisms by which these GWAS loci affect emphysema patterns are unknown.
The majority of GWAS-identified loci for genetically complex diseases are located in non-coding DNA and influence gene regulatory elements (Maurano et al., 2012;Nicolae et al., 2010). Thus, for the functional characterization of emphysema GWAS loci, it is necessary to localize causal variants in regulatory elements and identify the gene(s) regulated by that element. Since multiple cell types contribute to emphysema, large-scale functional annotation projects such as the Genotype-Tissue Expression Project (GTEx) (GTEx Consortium, 2015) and the Encyclopedia of Regulatory Elements (ENCODE) (ENCODE Project Consortium, 2012) can be integrated with GWAS signals to identify candidate regulatory regions, tissues, and cell types of interest for more detailed functional characterization.
In this study, we hypothesized that human emphysema is influenced by functional genetic variants that disrupt gene regulatory elements. As a screening approach, we cross-referenced GWAS results against large compendia of gene regulatory data from tissues and cell types to prioritize emphy-sema-associated loci for further functional study. This analysis identified rs1690789 as a high-proba-bility functional variant in the GWAS-identified region nearTGFB2. Using chromatin conformation capture, we confirmed that the region spanning this SNP interacts with theTGFB2promoter region. Via CRISPR/Cas-9 targeted deletion, we then demonstrated that a~ 100 bp segment containing rs1690789 increasesTGFB2expression in primary human lung fibroblasts, providing novel evidence that genetic variation affecting TGF-b signaling contributes to the genetic predisposition to emphysema.
Results
Validation of LHE clinical and genetic associations
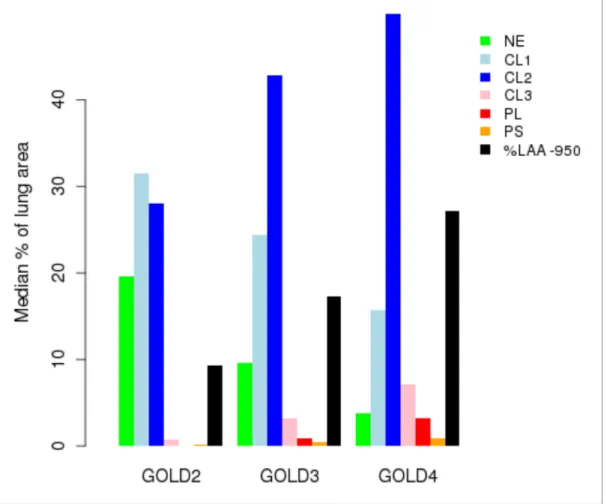
In subjects from the COPDGene Study, we have previously demonstrated that LHE measures are associated with COPD-related phenotypes (Castaldi et al., 2013) and with common genetic variants at genome-wide significance (Castaldi et al., 2014). To confirm these associations in an independent cohort and discover new genetic associations, we generated new LHE measures in 1519 subjects from the ECLIPSE Study, and we replicated the previously observed relationships between LHE pat-tern and GOLD (Global Initiative for Obstructive Lung Disease) spirometric grade (Figure 1). In the
eLife digest
It is well known that smoking is bad for the lungs. Not only can smoking cause lung cancer, it can also lead to conditions such as emphysema. This is the gradual damage to lung tissue that occurs when the walls of the tiny air-sacs in the lungs where the blood takes up oxygen, called the alveoli, weaken and break. Emphysema causes shortness of breath and difficulty pushing air out of the lungs, and it is part of chronic obstructive pulmonary disease (also known as COPD).Genetic differences mean that certain people are more likely to develop emphysema than others. As an example, if someone has genetic mutations that alter the activity of a gene calledTGFB2, their risk of developing emphysema increases. However, the specific genetic mutations that modify the activity ofTGFB2were previously unknown.
Parker et al. analyzed the genetic sequences of TGFB2 from patients with emphysema and compared them to those from healthy individuals. This revealed that certain mutations near the
TGFB2gene were more common in patients with emphysema. Next, Parker et al. showed that, in healthy lung cells called fibroblasts, the stretch of DNA that was mutated in patients with
emphysema touched the part ofTGFB2that controls when the gene is activated. Deleting that same stretch of DNA in the fibroblasts meant the cells could no longer activate theTGFB2gene as efficiently. Together, these results reveal a genetic difference that increases the risk for emphysema.
COPD affects approximately 175 million people worldwide, causing over three million deaths each year. The findings of Parker et al. suggest that developing drugs that safely and efficiently targetTGFB2may be a way to help patients with early signs of emphysema.
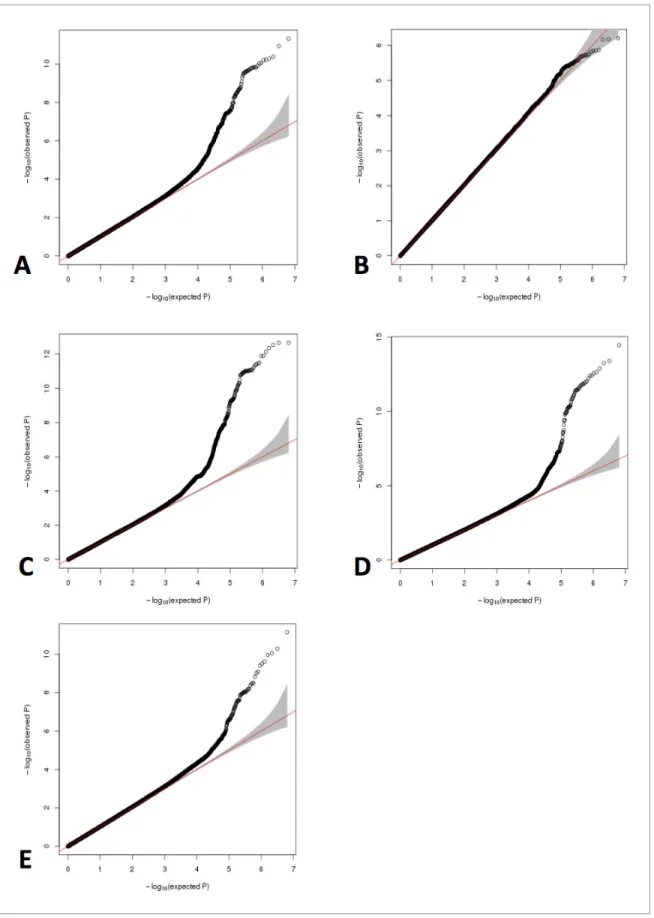
combined GWAS meta-analysis, we identified 10 independent regions with genome-wide significant associations to at least one LHE phenotype, six of which had been previously described (Table 1). One of the four novel associations is rs28929474, the pathogenic GlufiLys substitution in SERPINA1 which is known to be associated with COPD. There was no evidence of systematic inflation in the QQ-plots of these GWAS (Figure 2). Subject characteristics are shown in Supplementary file 1
Table 1, and complete results by cohort are shown inSupplementary file 1Table 2.
Since the more severe emphysema patterns (severe centrilobular and panlobular emphysema) are non-normally distributed, we performed a sensitivity analysis for these top results after performing inverse normal transformation of the LHE pattern phenotypes (Supplementary file 1Table 3). In this analysis, four loci remained genome-wide significant (loci on chromosome 15, 14, 11, and 1), two loci had p-values<510 7, and four associations to the panlobular and severe centrilobular patterns
had notably lower p-values suggesting that these specific associations are driven by extreme pheno-type values and should be interpreted with caution.
With regard to the association with the SERPINA1 Z-allele (rs28929474), subjects with known alpha-1 antitrypsin deficiency had been excluded from our primary analysis. However, when we examined the imputed genotypes of rs28929474, we identified six individuals in ECLIPSE with imputed PiZZ genotypes. When we repeated the genetic analysis without these subjects, there was an increase in association p-value in ECLIPSE (0.003 versus 0.0004, consistent direction of effect), and the meta-analysis association p-value was 1.610 7.
Figure 1.Percentage of each LHE-based emphysema pattern by Global Obstructive Lung Disease (GOLD) stage in ECLIPSE. NE =
Non-emphysematous lung. CL1 = Mild centrilobular. CL2 = Moderate centrilobular. CL3 = Severe centrilobular. PL = Panlobular. PS = Paraseptal.
%LAA-950 = emphysema based on 950 Hounsfield unit threshold.
To determine whether these variants were associated with other COPD-related phenotypes, we queried the LHE GWAS significant associations against the results from two recent large GWAS studies for FEV1, FEV1/FVC, and COPD status (Shrine et al., 2019;Sakornsakolpat et al., 2019). Five of the 10 LHE loci (lead variants rs56113850, rs796395, rs17368659, rs145770770, and the 15q25 locus) were associated to at least one of these outcomes at p<0.05 with a consistent direction of effect (Supplementary file 1Table 4).
Some loci associated with COPD and related phenotypes have also been associated with smoking behavior, raising the question of whether the COPD associations at these loci are mediated through smoking. To determine how many of our associations were also associated to smoking behavior, we queried our results against the UK Biobank Pheweb server GWAS for prior history of smoking, and we observed that the only associations that were nominally associated to smoking were the previ-ously known smoking associations in the 15q25 and 19q13 loci (Supplementary file 1Table 5).
eQTL colocalization analysis to identify candidate GWAS target genes
and tissue enrichment of LHE GWAS signals
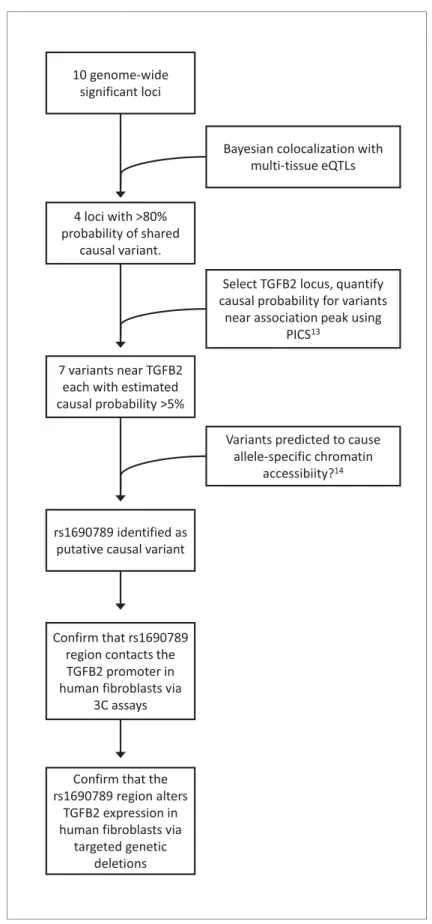
To generate functional hypotheses for emphysema-associated loci and prioritize regions for further functional study, we integrated our GWAS results with large-scale genome-wide eQTL and cell type epigenomic data, as shown in Figure 3. To identify emphysema-associated loci that overlap with eQTL signals from multiple tissues, we cross-referenced our LHE GWAS results against eQTL results from 44 GTEx tissues and blood eQTLs from COPDGene. Since overlap between GWAS and eQTL signals can be due to chance, we used a Bayesian colocalization method (Giambartolomei et al., 2014) to quantify the probability that the local GWAS and eQTL signals were attributable to a shared causal variant. Four genome-wide significant LHE regions overlapped with eQTL regions with an estimated >80% probability of a shared causal variant responsible for the GWAS and eQTL asso-ciations (Table 2).
To identify additional candidate colocalization loci that may be present below the stringent genome-wide significance threshold, we studied SNPs with a GWAS p<510 5. At this threshold,
the number of GWAS-eQTL overlap loci ranged from 78 (panlobular pattern) to 159 (moderate
Table 1.Genome-wide significant meta-analysis results for local histogram emphysema phenotypes.
LHE pattern Lead SNP Chromosome Position (hg19) EAF Effect allele P value meta Effect meta SE effect meta
Moderate Centrilobular rs56077333 15 78899003 0.67 a 2.2E-13 0.016 2.2E-03
rs17368582 11 102738075 0.14 t 8.1E-12 0.024 3.5E-03
rs56113850 19 41353107 0.59 t 1.5E-09 0.016 2.6E-03
rs796395 1 218681971 0.52 a 6.1E-09 0.013 2.2E-03
rs138641402 4 145445779 0.38 a 3.3E-08 0.014 2.5E-03
Nonemphysematous (Normal Lung) rs138641402 4 145445779 0.38 a 4.2E-08 0.021 3.9E-03
rs7170068 15 78912943 0.78 a 4.8E-12 0.028 4.0E-03
rs17368659 11 102742761 0.86 t 6.3E-11 0.036 5.4E-03
rs28929474* 14 94844947 0.98 t 6.2E-09 0.071 1.2E-02
Panlobular rs11852372 15 78801394 0.35 a 7.1E-12 0.003 5.0E-04
rs76756075* 11 112349844 0.02 t 2.0E-08 0.007 1.2E-03
rs78070126* 11 6574608 0.97 t 2.8E-08 0.006 1.1E-03
rs145770770 2 152487808 0.99 a 3.8E-08 0.015 2.8E-03
Severe Centrilobular rs9788721 15 78802869 0.38 t 3.4E-15 0.005 6.0E-04
rs379123 17 30891814 0.40 t 3.7E-08 0.004 7.0E-04
LHE - local histogram emphysema.
EAF - effect allele frequency in 1000 Genomes CEU population. *
indicates novel association not previously associated in GWAS of COPD or emphysema (rs28929474 was associated to FEV1/FVC in smokers inLi et al.,
Figure 2.QQ plots for GWAS meta-analyses of non-transformed LHE phenotypes. (A) Nonemphysematous lung. (B) Mild centrilobular pattern. (C)
Moderate centrilobular. (D) Severe centrilobular. (E) Panlobular.
10 genome-wide significant loci
Bayesian colocalization with multi-tissue eQTLs
4 loci with >80% probability of shared
causal variant.
Select TGFB2 locus, quantify causal probability for variants
near association peak using
PICS13
7 variants near TGFB2 each with estimated causal probability >5%
Variants predicted to cause allele-specific chromatin
accessibiity?14
rs1690789 identified as putative causal variant
Confirm that rs1690789 region contacts the TGFB2 promoter in human fibroblasts via
3C assays
Confirm that the rs1690789 region alters
TGFB2 expression in human fibroblasts via
targeted genetic deletions
Figure 3.Overview of integrative analyses to prioritize genome-wide significant emphysema-associated loci for
functional studies.
centrilobular pattern), representing between 15% to 33% of the total number of loci with a GWAS p<510 5. Of these loci, 32 had a > 80% estimated probability of having a shared causal
GWAS-eQTL variant, and we identified the genes whose expression levels are altered by these loci
(Supplementary file 1Table 6). Full results of this analysis are available athttps://cdnm.shinyapps.
io/lhemphysema_eqtlcolocalization/.
To test for tissue-specific enrichment of LHE GWAS signals, we quantified the enrichment of LHE GWAS regions associated at p<510 5 in DNaseI peak regions from ENCODE and Roadmap cell
types using the Garfield method (Iotchkova et al., 2019). The most commonly enriched cell types were fibroblasts and fetal lung tissue, as can be seen in the enrichment results for moderate centri-lobular emphysema (Figure 4). Out of 424 tested cell type annotations, there were 15, 25, and 1 cell type that exceeded the significance threshold for the moderate centrilobular, nonemphysematous, and severe centrilobular LHE phenotypes, respectively (Supplementary file 1Table 7).
Fine mapping identifies a candidate causal variant in the TGFB2 locus
One of the top GWAS-eQTL colocalization signals associated with the moderate centrilobular emphysema pattern spans a 200 kb region that includes the 3’ UTR ofTGFB2 and extends 100 kb downstream. Multiple SNPs in this region were significantly associated withTGFB2 expression in human tissues from the GTEx project (Figure 5) with the highest colocalization present with the eQTL signal in cultured fibroblasts. Given the essential roles of TGF-b signaling and fibroblasts in lung repair pathways, we selected this locus for further investigation.
To confirm the colocalization results forTGFB2, we performed a separate colocalization analysis using the same eQTL data but a separate colocalization methodology (He et al., 2013). Sherlock analysis for the moderate centrilobular GWAS results and GTEx eQTL data from fibroblasts, lung tis-sue, and whole blood confirmedTGFB2as a colocalization target for moderate centrilobular emphy-sema in fibroblasts, and a total of nine colocalizing genes or transcripts were identified at a p-value<110 4(Supplementary file 1Table 8).
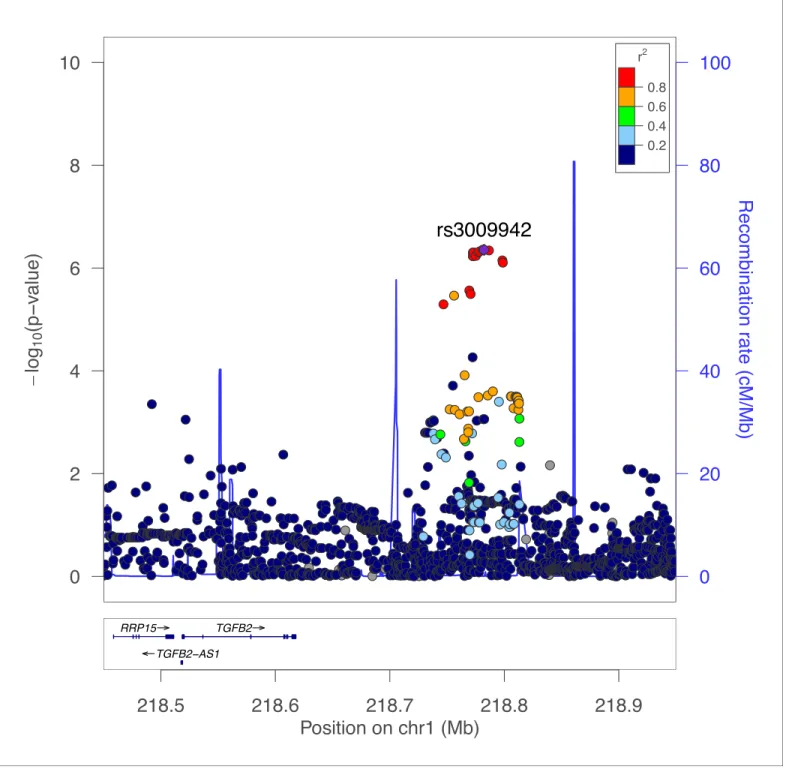
The GWAS signal in this region appears to demonstrate two independent peaks of association spanning a recombination hotspot, with the fibroblast eQTL signal appearing to colocalize with only one of these signals. We performed conditional genetic association analysis of this region, confirm-ing the presence of two independent signals (secondary association lead SNP rs3009942 p=4.410 7, Figure 6). To confirm that these are independent signals, we also performed
condi-tional association adjusting for rs3009942, which minimally attenuated the primary association (rs796395 conditional p-value=3.310 7).
Focusing on the primary association peak which colocalized with the fibroblast eQTL signal, we estimated the causal probability (i.e. the likelihood that each individual SNP is the causal variant) of each SNP in this region using the PICS method (Farh et al., 2015), identifying seven variants each with a > 5% estimated likelihood to be causal (Supplementary file 1 Table 9). We then queried whether any of these seven SNPs were predicted to alter transcription factor occupancy using the results of a previously published model developed from ENCODE data (Maurano et al., 2015), iden-tifying rs1690789 (minor allele frequency of 0.48 in 1000 Genomes EUR population) as the only vari-ant in this set predicted to have allele-specific effects on transcription factor occupancy.
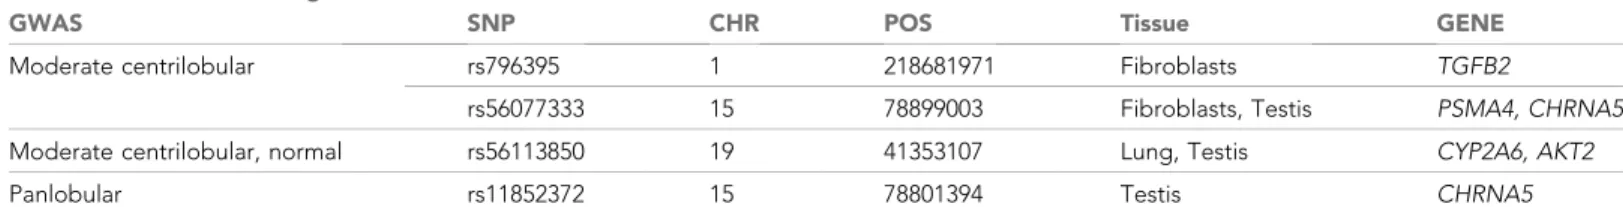
Table 2.Genomewide significant LHE loci that colocalize with eQTL.
GWAS SNP CHR POS Tissue GENE
Moderate centrilobular rs796395 1 218681971 Fibroblasts TGFB2
rs56077333 15 78899003 Fibroblasts, Testis PSMA4, CHRNA5
Moderate centrilobular, normal rs56113850 19 41353107 Lung, Testis CYP2A6, AKT2
Panlobular rs11852372 15 78801394 Testis CHRNA5
All loci have colocalization probability > 80%, reflecting the estimated probability that the GWAS and eQTL association signals arise from a shared causal variant.
LHE pattern – local histogram emphysema phenotype used for GWAS. SNP - lead GWAS variant in locus.
Tissue - tissue of origin for gene expression data in eQTL analysis. Gene – eQTL targeted gene in specified GTEx tissue.
Analysis of DNaseI accessibility near rs1690789 across various cell
types in publicly available data
Using the ENCODE uniformly processed DNaseI hypersensitivity dataset of 125 cell types, we observed that rs1690789 lies within a DNaseI hypersensitivity peak identified in 13 cell types (
Fig-ure 5, Panel C). Eight of these 13 cell types were fibroblasts, although this peak was not universally
detected in all fibroblast DNaseI experiments, suggesting that this may be a context-specific regula-tory element or that DNaseI accessibility may be influenced by genetic variation in these cell types.
● ● ● ● ● ●● ●● ●● ●●● ● blastula blastula blastula blastula blastula blastula blastula blastula blastula blastula blastula blastula blastula blastula blastula blastula blastula blastula blastula blastula blastula blastula blastula blastula blastula blastula
blastulablastulablastulablastulablastulablastula
blastula
blood
blood
blood
blood
blood
blood
blood
blood
blood
blood
blood
blood
blood
blood
blood
blood
blood
blood
blood
blood
blood
blood
blood
blood
blood
blood
blood
blood
blood
blood
blood
blood
blood
blood v essel blood v essel blood v essel blood v essel blood v essel blood v essel blood v essel blood v essel blood v essel blood v essel blood v essel blood v essel blood v essel blood v essel blood v essel blood v essel blood v essel blood v essel blood v essel blood v essel blood v essel blood v essel blood v essel blood v essel blood v essel blood v essel blood v essel blood v essel blood v essel blood v essel blood v essel blood v essel blood v essel bone bone bone bone bone bone bone bone bone bone bone bone bone bone bone bone bone bone bone bone bone bone bone bone bone bone bone bone bone bone bone bone bone brain brain brain brain brain brain brain brain brain brain brain brain brain brain brain brain brain brain brain brain brain brain brain brain brain brain brain brain brain brain brain brain brainbrain hippocampus brain hippocampus brain hippocampus brain hippocampus brain hippocampus brain hippocampus brain hippocampus brain hippocampus brain hippocampus brain hippocampus brain hippocampus brain hippocampus brain hippocampus brain hippocampus brain hippocampus brain hippocampus brain hippocampus brain hippocampus brain hippocampus brain hippocampus brain hippocampus brain hippocampus brain hippocampus brain hippocampus brain hippocampus brain hippocampus brain hippocampus brain hippocampus brain hippocampus brain hippocampus brain hippocampus brain hippocampus
brain hippocampus
breast breast breast breast breast breast breast breast breast breast breast breast breast breast breast breast breast breast breast breast breast breast breast breast breast breast breast breast breast breast breast breast breast cerebellar cerebellar cerebellar cerebellar cerebellar cerebellar cerebellar cerebellar cerebellar cerebellar cerebellar cerebellar cerebellar cerebellar cerebellar cerebellar cerebellar cerebellar cerebellar cerebellar cerebellar cerebellar cerebellar cerebellar cerebellar cerebellar cerebellar cerebellar cerebellar cerebellar cerebellar cerebellar cerebellar cer vix cer vix cer vix cer vix cer vix cer vix cer vix cer vix cer vix cer vix cer vix cer vix cer vix cer vix cer vix cer vix cer vix cer vix cer vix cer vix cer vix cer vix cer vix cer vix cer vix cer vix cer vix cer vix cer vix cer vix cer vix cer vix cer vix colon colon colon colon colon colon colon colon colon colon colon colon colon colon colon colon colon colon colon colon colon colon colon colon colon colon colon colon colon colon colon colon colon connectiv e connectiv e connectiv e connectiv e connectiv e connectiv e connectiv e connectiv e connectiv e connectiv e connectiv e connectiv e connectiv e connectiv e connectiv e connectiv e connectiv e connectiv e connectiv e connectiv e connectiv e connectiv e connectiv e connectiv e connectiv e connectiv e connectiv e connectiv e connectiv e connectiv e connectiv e connectiv e connectiv e embr y onic lung embr y onic lung embr y onic lung embr y onic lung embr y onic lung embr y onic lung embr y onic lung embr y onic lung embr y onic lung embr y onic lung embr y onic lung embr y onic lung embr y onic lung embr y onic lung embr y onic lung embr y onic lung embr y onic lung embr y onic lung embr y onic lung embr y onic lung embr y onic lung embr y onic lung embr y onic lung embr y onic lung embr y onic lung embr y onic lung embr y onic lung embr y onic lung embr y onic lung embr y onic lung embr y onic lung embr y onic lung embr y onic lung epitheliumepitheliumepitheliumepitheliumepitheliumepitheliumepitheliumepitheliumepitheliumepitheliumepitheliumepitheliumepitheliumepitheliumepitheliumepitheliumepitheliumepitheliumepitheliumepitheliumepitheliumepitheliumepitheliumepitheliumepitheliumepitheliumepitheliumepitheliumepitheliumepitheliumepitheliumepithelium epithelium
es celles celles celles celles celles celles celles celles celles celles celles celles celles celles celles celles celles celles celles celles celles celles celles celles celles celles celles celles celles celles celles cell
es cell e ye e ye e ye e ye e ye e ye e ye e ye e ye e ye e ye e ye e ye e ye e ye e ye e ye e ye e ye e ye e ye e ye e ye e ye e ye e ye e ye e ye e ye e ye e ye e ye e ye fetal adrenal gland fetal adrenal gland fetal adrenal gland fetal adrenal gland fetal adrenal gland fetal adrenal gland fetal adrenal gland fetal adrenal gland fetal adrenal gland fetal adrenal gland fetal adrenal gland fetal adrenal gland fetal adrenal gland fetal adrenal gland fetal adrenal gland fetal adrenal gland fetal adrenal gland fetal adrenal gland fetal adrenal gland fetal adrenal gland fetal adrenal gland fetal adrenal gland fetal adrenal gland fetal adrenal gland fetal adrenal gland fetal adrenal gland fetal adrenal gland fetal adrenal gland fetal adrenal gland fetal adrenal gland fetal adrenal gland fetal adrenal gland
fetal adrenal gland
fetal br ain fetal br ain fetal br ain fetal br ain fetal br ain fetal br ain fetal br ain fetal br ain fetal br ain fetal br ain fetal br ain fetal br ain fetal br ain fetal br ain fetal br ain fetal br ain fetal br ain fetal br ain fetal br ain fetal br ain fetal br ain fetal br ain fetal br ain fetal br ain fetal br ain fetal br ain fetal br ain fetal br ain fetal br ain fetal br ain fetal br ain fetal br ain fetal br ain fetal hear t fetal hear t fetal hear t fetal hear t fetal hear t fetal hear t fetal hear t fetal hear t fetal hear t fetal hear t fetal hear t fetal hear t fetal hear t fetal hear t fetal hear t fetal hear t fetal hear t fetal hear t fetal hear t fetal hear t fetal hear t fetal hear t fetal hear t fetal hear t fetal hear t fetal hear t fetal hear t fetal hear t fetal hear t fetal hear t fetal hear t fetal hear t fetal hear t fetal intestine , large fetal intestine , large fetal intestine , large fetal intestine , large fetal intestine , large fetal intestine , large fetal intestine , large fetal intestine , large fetal intestine , large fetal intestine , large fetal intestine , large fetal intestine , large fetal intestine , large fetal intestine , large fetal intestine , large fetal intestine , large fetal intestine , large fetal intestine , large fetal intestine , large fetal intestine , large fetal intestine , large fetal intestine , large fetal intestine , large fetal intestine , large fetal intestine , large fetal intestine , large fetal intestine , large fetal intestine , large fetal intestine , large fetal intestine , large fetal intestine , large fetal intestine , large fetal intestine , large fetal intestine , small fetal intestine , small fetal intestine , small fetal intestine , small fetal intestine , small fetal intestine , small fetal intestine , small fetal intestine , small fetal intestine , small fetal intestine , small fetal intestine , small fetal intestine , small fetal intestine , small fetal intestine , small fetal intestine , small fetal intestine , small fetal intestine , small fetal intestine , small fetal intestine , small fetal intestine , small fetal intestine , small fetal intestine , small fetal intestine , small fetal intestine , small fetal intestine , small fetal intestine , small fetal intestine , small fetal intestine , small fetal intestine , small fetal intestine , small fetal intestine , small fetal intestine , small fetal intestine , small fetal kidne y fetal kidne y fetal kidne y fetal kidne y fetal kidne y fetal kidne y fetal kidne y fetal kidne y fetal kidne y fetal kidne y fetal kidne y fetal kidne y fetal kidne y fetal kidne y fetal kidne y fetal kidne y fetal kidne y fetal kidne y fetal kidne y fetal kidne y fetal kidne y fetal kidne y fetal kidne y fetal kidne y fetal kidne y fetal kidne y fetal kidne y fetal kidne y fetal kidne y fetal kidne y fetal kidne y fetal kidne y fetal kidne y
fetal lung
fetal lung
fetal lung
fetal lung
fetal lung
fetal lung
fetal lung
fetal lung
fetal lung
fetal lung
fetal lung
fetal lung
fetal lung
fetal lung
fetal lung
fetal lung
fetal lung
fetal lung
fetal lung
fetal lung
fetal lung
fetal lung
fetal lung
fetal lung
fetal lung
fetal lung
fetal lung
fetal lung
fetal lung
fetal lung
fetal lung
fetal lung
fetal lung
fetal membr ane fetal membr ane fetal membr ane fetal membr ane fetal membr ane fetal membr ane fetal membr ane fetal membr ane fetal membr ane fetal membr ane fetal membr ane fetal membr ane fetal membr ane fetal membr ane fetal membr ane fetal membr ane fetal membr ane fetal membr ane fetal membr ane fetal membr ane fetal membr ane fetal membr ane fetal membr ane fetal membr ane fetal membr ane fetal membr ane fetal membr ane fetal membr ane fetal membr ane fetal membr ane fetal membr ane fetal membr ane fetal membr anefetal m
uscle
fetal m
uscle
fetal m
uscle
fetal m
uscle
fetal m
uscle
fetal m
uscle
fetal m
uscle
fetal m
uscle
fetal m
uscle
fetal m
uscle
fetal m
uscle
fetal m
uscle
fetal m
uscle
fetal m
uscle
fetal m
uscle
fetal m
uscle
fetal m
uscle
fetal m
uscle
fetal m
uscle
fetal m
uscle
fetal m
uscle
fetal m
uscle
fetal m
uscle
fetal m
uscle
fetal m
uscle
fetal m
uscle
fetal m
uscle
fetal m
uscle
fetal m
uscle
fetal m
uscle
fetal m
uscle
fetal m
uscle
fetal m
uscle
fetal m uscle , lo wer limbfetal m uscle
, lo wer limb
fetal m uscle
, lo wer limb
fetal m uscle
, lo wer limb
fetal m uscle
, lo wer limb
fetal m uscle
, lo wer limb
fetal m uscle
, lo wer limb
fetal m uscle
, lo wer limb
fetal m uscle
, lo wer limb
fetal m uscle
, lo wer limb
fetal m uscle
, lo wer limb
fetal m uscle
, lo wer limb
fetal m uscle
, lo wer limb
fetal m uscle
, lo wer limb
fetal m uscle
, lo wer limb
fetal m uscle
, lo wer limb
fetal m uscle
, lo wer limb
fetal m uscle
, lo wer limb
fetal m uscle
, lo wer limb
fetal m uscle
, lo wer limb
fetal m uscle
, lo wer limb
fetal m uscle
, lo wer limb
fetal m uscle
, lo wer limb
fetal m uscle
, lo wer limb
fetal m uscle
, lo wer limb
fetal m uscle
, lo wer limb
fetal m uscle
, lo wer limb
fetal m uscle
, lo wer limb
fetal m uscle
, lo wer limb
fetal m uscle
, lo wer limb
fetal m uscle
, lo wer limb
fetal m uscle
, lo wer limb
fetal m uscle
, lo wer limb
fetal m uscle , tr unk fetal m uscle , tr unk fetal m uscle , tr unk fetal m uscle , tr unk fetal m uscle , tr unk fetal m uscle , tr unk fetal m uscle , tr unk fetal m uscle , tr unk fetal m uscle , tr unk fetal m uscle , tr unk fetal m uscle , tr unk fetal m uscle , tr unk fetal m uscle , tr unk fetal m uscle , tr unk fetal m uscle , tr unk fetal m uscle , tr unk fetal m uscle , tr unk fetal m uscle , tr unk fetal m uscle , tr unk fetal m uscle , tr unk fetal m uscle , tr unk fetal m uscle , tr unk fetal m uscle , tr unk fetal m uscle
, trunk
fetal m uscle
, trunk
fetal m uscle , tr unk fetal m uscle , tr unk fetal m uscle , tr unk fetal m uscle , tr unk fetal m uscle , tr unk fetal m uscle , tr unk fetal m uscle , tr unk fetal m uscle , tr unk fetal m uscle
, upper tr unk
fetal m uscle
, upper tr unk
fetal m uscle
, upper tr unk
fetal m uscle
, upper tr unk
fetal m uscle
, upper tr unk
fetal m uscle
, upper tr unk
fetal m uscle
, upper tr unk
fetal m uscle
, upper tr unk
fetal m uscle
, upper tr unk
fetal m uscle
, upper tr unk
fetal m uscle
, upper tr unk
fetal m uscle
, upper tr unk
fetal m uscle
, upper tr unk
fetal m uscle
, upper tr unk
fetal m uscle
, upper tr unk
fetal m uscle
, upper tr unk
fetal m uscle
, upper tr unk
fetal m uscle
, upper tr unk
fetal m uscle
, upper tr unk
fetal m uscle
, upper tr unk
fetal m uscle
, upper tr unk
fetal m uscle
, upper tr unk
fetal m uscle
, upper tr unk
fetal m uscle
, upper tr unk
fetal m uscle
, upper tr unk
fetal m uscle
, upper tr unk
fetal m uscle
, upper tr unk
fetal m uscle
, upper tr unk
fetal m uscle
, upper tr unk
fetal m uscle
, upper tr unk
fetal m uscle
, upper tr unk
fetal m uscle
, upper tr unk
fetal m uscle
, upper tr unk fetal placenta fetal placenta fetal placenta fetal placenta fetal placenta fetal placenta fetal placenta fetal placenta fetal placenta fetal placenta fetal placenta fetal placenta fetal placenta fetal placenta fetal placenta fetal placenta fetal placenta fetal placenta fetal placenta fetal placenta fetal placenta fetal placenta fetal placenta fetal placentafetal placentafetal placentafetal placentafetal placentafetal placentafetal placentafetal placentafetal placenta
fetal placenta
fetal renal cor tex
fetal renal cor tex
fetal renal cor tex
fetal renal cor tex
fetal renal cor tex
fetal renal cor tex
fetal renal cor tex
fetal renal cor tex
fetal renal cor tex
fetal renal cor tex
fetal renal cor tex
fetal renal cor tex
fetal renal cor tex
fetal renal cor tex
fetal renal cor tex
fetal renal cor tex
fetal renal cor tex
fetal renal cor tex
fetal renal cor tex
fetal renal cor tex
fetal renal cor tex
fetal renal cor tex
fetal renal cor tex
fetal renal cor tex
fetal renal cor tex
fetal renal cor tex
fetal renal cor tex
fetal renal cor tex
fetal renal cor tex
fetal renal cor tex
fetal renal cor tex
fetal renal cor tex
fetal renal cor tex
fetal renal pelvis fetal renal pelvis fetal renal pelvis fetal renal pelvis fetal renal pelvis fetal renal pelvis fetal renal pelvis fetal renal pelvis fetal renal pelvis fetal renal pelvis fetal renal pelvis fetal renal pelvis fetal renal pelvis fetal renal pelvis fetal renal pelvis fetal renal pelvis fetal renal pelvis fetal renal pelvis fetal renal pelvis fetal renal pelvis fetal renal pelvis fetal renal pelvis fetal renal pelvis fetal renal pelvis fetal renal pelvis fetal renal pelvis fetal renal pelvis fetal renal pelvis fetal renal pelvis fetal renal pelvis fetal renal pelvis fetal renal pelvis
fetal renal pelvis
fetal skinfetal skinfetal skinfetal skinfetal skinfetal skinfetal skinfetal skinfetal skinfetal skinfetal skinfetal skinfetal skinfetal skinfetal skinfetal skinfetal skinfetal skinfetal skinfetal skinfetal skinfetal skinfetal skinfetal skinfetal skinfetal skinfetal skinfetal skinfetal skinfetal skinfetal skinfetal skin
fetal skin
fetal spinal cordfetal spinal cordfetal spinal cordfetal spinal cordfetal spinal cordfetal spinal cordfetal spinal cordfetal spinal cordfetal spinal cordfetal spinal cordfetal spinal cordfetal spinal cordfetal spinal cordfetal spinal cordfetal spinal cordfetal spinal cordfetal spinal cordfetal spinal cordfetal spinal cordfetal spinal cordfetal spinal cordfetal spinal cordfetal spinal cordfetal spinal cordfetal spinal cordfetal spinal cordfetal spinal cordfetal spinal cordfetal spinal cordfetal spinal cordfetal spinal cordfetal spinal cord
fetal spinal cord
fetal spleenfetal spleenfetal spleenfetal spleenfetal spleenfetal spleenfetal spleenfetal spleenfetal spleenfetal spleenfetal spleenfetal spleenfetal spleenfetal spleenfetal spleenfetal spleenfetal spleenfetal spleenfetal spleenfetal spleenfetal spleenfetal spleenfetal spleenfetal spleenfetal spleenfetal spleenfetal spleenfetal spleenfetal spleenfetal spleenfetal spleenfetal spleen
fetal spleen fetal stomachfetal stomachfetal stomachfetal stomachfetal stomachfetal stomachfetal stomachfetal stomachfetal stomachfetal stomachfetal stomachfetal stomachfetal stomachfetal stomachfetal stomachfetal stomachfetal stomachfetal stomachfetal stomachfetal stomachfetal stomachfetal stomachfetal stomachfetal stomachfetal stomachfetal stomachfetal stomachfetal stomachfetal stomachfetal stomachfetal stomachfetal stomachfetal stomach fetal testesfetal testesfetal testesfetal testesfetal testesfetal testesfetal testesfetal testesfetal testesfetal testesfetal testesfetal testesfetal testesfetal testesfetal testesfetal testesfetal testesfetal testesfetal testesfetal testesfetal testesfetal testesfetal testesfetal testesfetal testesfetal testesfetal testesfetal testesfetal testesfetal testesfetal testesfetal testesfetal testes fetal th ym us fetal th ym us fetal th ym us fetal th ym us fetal th ym us fetal th ym us fetal th ym us fetal th ym us fetal th ym us fetal th ym us fetal th ym us fetal th ym us fetal th ym us fetal th ym us fetal th ym us fetal th ym us fetal th ym us fetal th ym us fetal th ym us fetal th ym us fetal th ym us fetal th ym us fetal th ym us fetal th ym us fetal th ym us fetal th ym us fetal th ym us fetal th ym us fetal th ym us fetal th ym us fetal th ym us fetal th ym us fetal th ym us fibrob last fibrob last fibrob last fibrob last fibrob last fibrob last fibrob last fibrob last fibrob last fibrob last fibrob last fibrob last fibrob last fibrob last fibrob last fibrob last fibrob last fibrob last fibrob last fibrob last fibrob last fibrob last fibrob last fibrob last fibrob last fibrob last fibrob last fibrob last fibrob last fibrob last fibrob last fibrob last fibrob last foreskin foreskin foreskin foreskin foreskin foreskin foreskin foreskin foreskin foreskin foreskin foreskin foreskin foreskin foreskin foreskin foreskin foreskin foreskin foreskin foreskin foreskin foreskin foreskin foreskin foreskin foreskin foreskin foreskin foreskin foreskin foreskin foreskin gingiv al gingiv al gingiv al gingiv al gingiv al gingiv al gingiv al gingiv al gingiv al gingiv al gingiv al gingiv al gingiv al gingiv al gingiv al gingiv al gingiv al gingiv al gingiv al gingiv al gingiv al gingiv al gingiv al gingiv al gingiv al gingiv al gingiv al gingiv al gingiv al gingiv al gingiv al gingiv al gingiv al hear t hear t hear t hear t hear t hear t hear t hear t hear t hear t hear t hear t hear t hear t hear t hear t hear t hear t hear t hear t hear t hear t hear t hear t hear t hear t hear t hear t hear t hear t hear t hear t hear t ips cell ips cell ips cell ips cell ips cell ips cell ips cell ips cell ips cell ips cell ips cell ips cell ips cell ips cell ips cell ips cell ips cell ips cell ips cell ips cell ips cell ips cell ips cell ips cell ips cell ips cell ips cell ips cell ips cell ips cell ips cell ips cell ips cell kidne y kidne y kidne y kidne y kidne y kidne y kidne y kidne y kidne y kidne y kidne y kidne y kidne y kidne y kidne y kidne y kidne y kidne y kidne y kidne y kidne y kidne y kidne y kidne y kidne y kidne y kidne y kidne y kidne y kidne y kidne y kidne y kidne y liv er liv er liv er liv er liv er liv er liv er liv er liv er liv er liv er liv er liv er liv er liv er liv er liv er liv er liv er liv er liv er liv er liv er liv er liv er liv er liv er liv er liv er liv er liv er liv er liv er lung lung lung lung lung lung lung lung lung lung lung lung lung lung lung lung lung lung lung lung lung lung lung lung lung lung lung lung lung lung lung lung lung multi−tissue multi−tissue multi−tissue multi−tissue multi−tissue multi−tissue multi−tissue multi−tissue multi−tissue multi−tissue multi−tissue multi−tissue multi−tissue multi−tissue multi−tissue multi−tissue multi−tissue multi−tissue multi−tissue multi−tissue multi−tissue multi−tissue multi−tissue multi−tissue multi−tissue multi−tissue multi−tissue multi−tissue multi−tissue multi−tissue multi−tissue multi−tissue multi−tissue muscle muscle muscle muscle muscle muscle muscle muscle muscle muscle muscle muscle muscle muscle muscle muscle muscle muscle muscle muscle muscle muscle muscle muscle muscle muscle muscle muscle muscle muscle muscle muscle
musclemyometrium
myometr ium myometr ium myometr ium myometr ium myometr ium myometr ium myometr ium myometr ium myometr ium myometr ium myometr ium myometr ium myometr ium myometr ium myometr ium myometr ium myometr ium myometr ium myometr ium myometr ium myometr ium myometr ium myometr ium myometr ium myometr ium myometr ium myometr ium myometr ium myometr ium myometr ium myometr ium myometr ium ner vous ner vous ner vous ner vous ner vous ner vous ner vous ner vous ner vous ner vous ner vous ner vous ner vous ner vous ner vous ner vous ner vous ner vous ner vous ner vous ner vous ner vous ner vous ner vous ner vous ner vous ner vous ner vous ner vous ner vous ner vous ner vous ner vous pancreas pancreas pancreas pancreas pancreas pancreas pancreas pancreas pancreas pancreas pancreas pancreas pancreas pancreas pancreas pancreas pancreas pancreas pancreas pancreas pancreas pancreas pancreas pancreas pancreas pancreas pancreas pancreas pancreas pancreas pancreas pancreas pancreas pancreatic duct pancreatic duct pancreatic duct pancreatic duct pancreatic duct pancreatic duct pancreatic duct pancreatic duct pancreatic duct pancreatic duct pancreatic duct pancreatic duct pancreatic duct pancreatic duct pancreatic duct pancreatic duct pancreatic duct pancreatic duct pancreatic duct pancreatic duct pancreatic duct pancreatic duct pancreatic duct pancreatic duct pancreatic duct pancreatic duct pancreatic duct pancreatic duct pancreatic duct pancreatic duct pancreatic duct pancreatic duct pancreatic duct prostate prostate prostate prostate prostate prostate prostate prostate prostate prostate prostate prostate prostate prostate prostate prostate prostate prostate prostate prostate prostate prostate prostate prostate prostate prostate prostate prostate prostate prostate prostate prostate prostate skin skin skin skin skin skin skin skin skin skin skin skin skin skin skin skin skin skin skin skin skin skin skin skin skin skin skin skin skin skin skin skin skin spinal cord spinal cord spinal cord spinal cord spinal cord spinal cord spinal cord spinal cord spinal cord spinal cord spinal cord spinal cord spinal cord spinal cord spinal cord spinal cord spinal cord spinal cord spinal cord spinal cord spinal cord spinal cord spinal cord spinal cord spinal cord spinal cord spinal cord spinal cord spinal cord spinal cord spinal cord spinal cord spinal cordtestistestistestistestistestistestistestistestistestistestistestistestistestistestistestistestistestistestistestistestistestistestistestistestistestistestistestistestistestistestistestistestistestis urothelium urothelium urothelium urothelium urothelium urothelium urothelium urothelium urothelium urothelium urothelium urothelium urothelium urothelium urothelium urothelium urothelium urothelium urothelium urothelium urothelium urothelium urothelium urothelium urothelium urothelium urothelium urothelium urothelium urothelium urothelium urothelium urothelium uterus uterus uterus uterus uterus uterus uterus uterus uterus uterus uterus uterus uterus uterus uterus uterus uterus uterus uterus uterus uterus uterus uterus uterus uterus uterus uterus uterus uterus uterus uterus uterus uterus
0 0.5 1 1.5 2 2.5 3 3.5
0 0.5 1 1.5 2 2.5 3 3.5
GWAS P−value Threshold 5e−05 1 Tissue blastula blood blood vessel bone brain brain hippocampus breast cerebellar cervix colon connective embryonic lung epithelium es cell eye
fetal adrenal gland fetal brain fetal heart fetal intestine, large fetal intestine, small fetal kidney fetal lung fetal membrane fetal muscle fetal muscle, lower limb fetal muscle, trunk fetal muscle, upper trunk fetal placenta fetal renal cortex fetal renal pelvis fetal skin fetal spinal cord fetal spleen fetal stomach fetal testes fetal thymus fibroblast foreskin gingival heart ips cell kidney liver lung multi−tissue muscle myometrium nervous pancreas pancreatic duct prostate skin spinal cord testis urothelium uterus
Figure 4.Cell type and tissue enrichment for moderate centribloular emphysema GWAS signals. Using Garfield (Iotchkova et al., 2019) for enrichment
analysis, we tested the enrichment of moderate centrilobular GWAS loci (harboring associations a p<510 5) in DNaseI peaks from 424 cell lines and
cell types in ENCODE and Roadmap. Significant enrichments were observed in fetal lung, fetal stomach, and multiple fibroblast cell types. These significant enrichments are denoted by colored dots located just inside the boundary of the circle of cell types.
Figure 5.The locus zoom plot of GWAS p-values suggests two independent associations (Panel A), and the GWAS signal colocalizes with an eQTL signal in fibroblasts from GTEx (Panel B). rs1690789 is located at one of these GWAS association peaks and lies within a context-specific DNaseI peak (Panel C). GM12878, H1hESC, and K562 cell lines are shown for reference, and the remaining cell types are those with DNaseI peaks that overlap rs1690789. Raw DNaseI data from only one experimental replicate are shown. GM12878 = lymphblastoid cell line. H1hESC = human embryonic stem cell. K562 = leukemia cell line. AG0449-AG10803 refer to fibroblasts from different subjects and sampling sites. HGF = gingival fibroblasts.
HMVECLLy = lung derived microvascular endothelial cells. HPdLF - Periodontal ligament fibroblasts. HRPEpiC – retinal pigment epithelial cells. HSMM – skeletal muscle myoblasts. NHDF – dermal fibroblasts. NHLF – lung fibroblasts.
Chromatin interaction between GWAS peak regions and the TGFB2
promoter
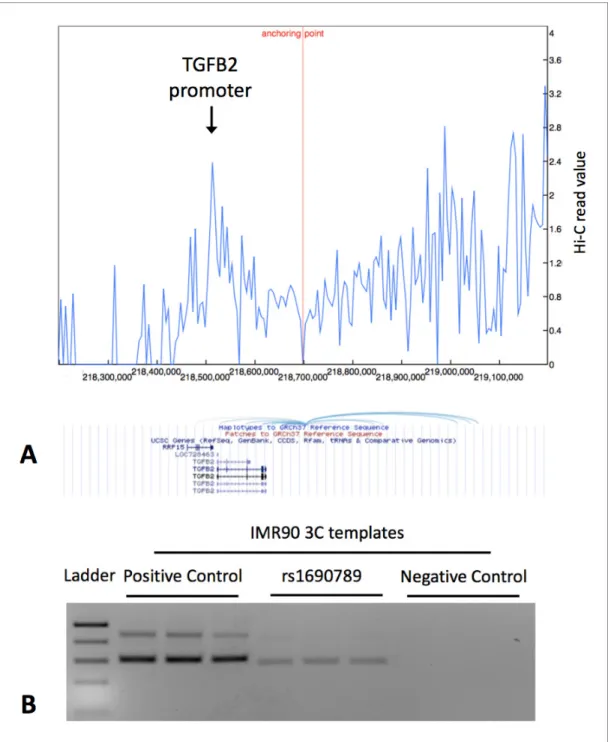
Since rs1690789 is located~200 kb from the transcription start site ofTGFB2, we hypothesized that this region may regulateTGFB2 expression via a long-range chromatin interaction. Using publicly available 4C-Seq chromatin conformation data from IMR90 human lung fibroblasts (Rao et al., 2014), we observed that the 10 kb region containing rs1690789 contacts multiple upstream and
0
2
4
6
8
10
−
lo
g
10(p
−
value)
0
20
40
60
80
100
Recombination r
ate (cM/Mb)
● ●●● ● ●●● ● ● ● ● ● ● ● ● ● ● ● ● ● ● ● ● ● ● ● ● ● ● ●● ●● ● ● ● ● ● ●●● ● ● ● ● ● ●●●● ● ● ●●●●●●●●●● ●● ● ● ● ●●● ● ● ●● ● ● ●● ● ● ● ● ● ● ● ● ● ●● ● ● ● ● ● ●●●●● ● ● ● ● ● ● ● ●● ●● ●●●●● ● ●● ● ●●●●●●●●●●●●● ● ● ●● ● ● ● ● ● ● ●●●●● ● ● ● ● ● ●● ● ● ● ● ● ● ● ● ● ● ● ● ● ● ● ●● ● ● ● ●● ● ● ● ●● ●● ● ● ● ● ● ● ● ● ● ● ● ● ● ● ● ● ● ●● ● ● ●● ● ● ●● ● ● ● ● ● ● ●● ● ● ● ● ● ● ● ● ● ● ●● ● ● ● ● ● ● ● ● ● ● ● ● ● ● ● ● ● ● ● ● ● ● ● ● ● ● ● ●●●● ● ● ● ●●● ●● ● ● ● ● ● ● ● ● ● ● ● ●●● ● ● ● ● ● ● ● ● ● ●● ● ●● ● ●●● ●● ● ● ● ● ● ● ● ● ● ● ● ● ● ● ● ●● ● ● ● ● ● ● ● ●●● ● ● ● ● ● ● ● ● ● ● ● ● ● ●●● ●● ● ● ● ● ● ● ● ● ●●●● ● ● ● ● ● ● ● ● ● ● ● ● ● ●●● ● ● ● ● ● ● ● ● ● ● ● ● ● ● ● ●● ● ● ●●●● ● ● ● ● ● ● ● ● ● ● ● ● ● ●● ● ● ●●●●● ● ● ● ● ● ● ● ● ● ● ● ● ●● ● ● ● ● ● ● ● ● ● ● ● ●●●● ● ● ● ● ● ● ● ● ●● ● ● ● ● ● ● ● ●● ● ● ●●●●●●●●● ● ● ● ● ● ●●●●●●●●● ● ● ● ●●●● ● ● ●●●●●●●●● ● ● ●●●●●● ● ● ● ● ● ● ● ●● ● ● ● ● ● ● ● ● ● ● ●●● ● ● ● ● ● ● ● ●●●●●●●●● ● ●● ● ● ●●●●● ● ● ●●● ● ● ● ● ● ● ● ●● ●● ● ● ● ● ● ● ● ● ●●●●● ● ● ● ● ● ● ●●●● ● ● ● ● ●● ● ● ● ● ● ● ● ● ● ● ● ● ● ● ● ●●● ● ● ● ● ● ● ● ● ● ● ● ● ● ● ●●● ● ● ● ● ● ● ● ● ● ● ● ● ● ● ● ● ● ● ● ● ● ● ● ● ● ● ● ● ● ● ● ● ● ● ●● ● ●● ● ●● ● ● ● ● ● ● ● ● ●●● ● ● ● ●● ● ● ● ● ● ●●● ● ●● ● ● ● ● ● ● ● ● ● ● ● ●● ● ● ● ● ● ● ● ● ● ● ● ●● ● ● ● ●● ● ● ● ● ● ● ● ● ● ● ● ● ● ● ● ● ● ●● ● ● ● ● ● ● ● ● ● ● ● ● ● ● ● ● ● ● ● ● ● ●● ● ● ● ● ● ● ● ● ● ● ● ● ● ● ● ● ● ● ● ● ● ● ●● ● ● ● ●● ● ● ● ● ● ● ● ● ● ● ● ● ● ● ● ● ●●● ●● ● ● ● ● ● ● ● ● ●● ● ● ● ● ● ● ● ● ● ● ● ● ● ● ● ● ● ● ● ● ● ● ● ● ● ● ● ● ● ● ● ● ● ● ● ● ● ● ● ● ● ● ● ● ● ● ●●● ● ●● ● ● ●● ●● ● ● ● ● ● ● ● ● ● ● ● ● ● ●● ● ● ● ● ● ● ● ● ●● ● ●●● ● ● ● ●●●● ● ● ● ●●●●● ●●● ● ● ● ● ● ● ● ● ● ● ● ● ● ● ● ● ● ● ● ● ● ● ● ● ● ● ● ●● ● ● ● ● ● ● ● ● ● ● ●●● ● ● ● ● ● ● ● ● ● ● ● ●● ● ● ● ● ● ● ●● ● ● ● ● ● ● ● ● ● ● ● ● ● ●● ● ● ● ● ● ● ● ● ● ● ● ● ●●● ● ● ● ● ●●● ● ● ● ● ● ● ● ● ● ● ● ● ● ● ●●●● ● ● ●●●●●● ● ● ● ● ● ● ● ● ●● ● ● ● ● ● ● ●● ● ● ● ●● ● ●● ● ● ● ● ● ● ● ● ● ● ● ● ● ● ● ● ● ● ● ● ● ● ● ● ● ● ● ● ● ● ●●●●●●●●●●●●●●●● ● ● ● ● ●●● ● ● ●●●●●●●●●●●●●●●●●●●●●●●●●●●●●●●●●●●●●●● ● ● ● ● ● ● ● ● ● ●● ● ● ● ●●●●●● ● ● ● ● ●●● ● ●●●●●●●●●●● ● ● ● ● ● ● ● ● ● ● ● ● ●● ● ● ● ●● ● ● ●● ● ●●●● ● ● ● ● ● ● ●●●● ● ● ● ● ● ● ●● ● ● ● ● ●● ● ● ●●●● ● ● ● ● ● ● ● ● ● ● ● ● ● ●● ● ● ● ● ● ● ● ● ● ● ● ● ● ● ● ● ● ● ● ● ● ● ● ● ● ● ● ●● ●● ● ● ● ● ● ● ● ●● ● ● ● ●● ● ● ● ● ● ●● ● ● ● ●● ● ● ● ● ● ● ● ● ● ● ● ● ● ● ● ● ● ● ● ● ● ● ● ● ● ● ● ● ● ● ●● ● ● ● ● ● ●● ● ● ● ● ● ● ● ● ● ● ● ● ● ● ●●●● ● ● ● ● ● ●● ● ● ● ● ● ● ● ● ● ● ● ● ● ● ● ● ●● ● ● ● ● ● ● ● ● ●● ● ● ● ● ● ●●●●●● ● ● ●● ●● ● ● ● ● ● ● ● ● ● ●● ● ● ● ● ●●●●●● ● ● ● ● ● ● ● ● ●● ● ● ● ● ● ● ●●● ●● ● ●●●●●● ● ●● ● ●● ● ●●●●●●●● ● ● ●rs3009942
0.2 0.4 0.6 0.8 r2 RRP15TGFB2−AS1 TGFB2
218.5
218.6
218.7
218.8
218.9
Position on chr1 (Mb)
Figure 6.Secondary association for moderate centrilobular emphysema at the TGFB2 locus. Results from genetic association meta-analysis conditioned
downstream regions aroundTGFB2(Figure 7A), suggesting that this region is a hotspot of chromo-somal interaction.
To confirm whether rs1690789 region indeed interacts with the promoter ofTGFB2in lung fibro-blasts, we performed chromatin conformation capture (3C) experiments in human lung fibroblasts (IMR90). Using theTGFB2promoter region as the anchor region, we detected interaction between
Figure 7.Publicly available chromatin conformation capture (4C) results in IMR90 cells show multiple peaks of interaction for the 10 kb region
containing the context-specific regulatory element around rs1690789 (Panel A – blue spikes in top figure indicate regions of high interaction frequency and light blue curved lines in lower figure indicate chromosomal interactions with the 10 kb region containing rs1690789). Newly generated 3C assays in
IMR90 fibroblasts verify the interaction between the region containing rs1690789 andTGFB2promoter (Panel B). Primer sequences are listed in
Supplementary file 1Table 10.
the rs1690789-containing region and theTGFB2 promoter in lung fibroblasts (Figure 7B), suggest-ing long range regulation ofTGFB2by the region containing rs1690789.
Deletion of the rs1690789 region alters TGFB2 expression in lung
fibroblasts
To determine whether the DNA region near rs1690789 has regulatory effects on the expression of
TGFB2in human lung fibroblasts in the endogenous genomic context, we generated CRISPR/Cas-9 constructs containing gRNA pairs targeting the~100 bp region spanning rs1690789 (Figure 8A) to generate genomic deletions in normal primary human lung fibroblasts. With sufficient deletion effi-ciency of the region spanning rs1690789, we detected reduced expression ofTGFB2(Figure 8B and
C,Supplementary file 1Table 11), indicating that this distal genomic region has regulatory effects
on the expression ofTGFB2in normal primary human lung fibroblasts.
Figure 8.Regional knockout of rs1690789 in primary human lung fibroblasts using CRISPR/Cas9 editing. Three pairs of sgRNAs were applied to delete
a DNA region of~100 bp spanning rs1690789 (A). The expression of TGFB2 is downregulated in rs1690789 knockout lung fibroblast cells with qPCR
quantification, n = 4 (B). The editing efficiency is examined to confirm the effect of CRISPR/Cas9 regional knockout, n = 4 (C). *p<0.05 compared to
control by unpairedttest.
Discussion
Previous GWAS studies have demonstrated that common genetic variation contributes to emphysema (Cho et al., 2015), likely through the perturbation of gene regulatory mechanisms (Castaldi et al., 2014). In order to identify putative causal variants and regulatory mech-anisms for these loci, we used a screening approach that leverages large compendia of gene regula-tory information in the GTEx and ENCODE projects. Using Bayesian colocalization, we identified 32 emphysema-associated loci at p<510 5where it is likely that colocalized GWAS and eQTL signals
arise from the same causal variant. It should be noted that these are putative and not confirmed dis-ease variants due to our use of a relaxed GWAS significance threshold and the inherent complexities of colocalization, which continues to be an area of active methodological development. For the genome-wide significant locus nearTGFB2, multiple sources of publicly available and newly gener-ated experimental data link a functional variant, rs1690789, to TGFB2 expression in fibroblasts. These data suggest that naturally occurring genetic variability in TGF-bsignaling plays a causal role in the development of emphysema.
The TGF-bfamily of proteins constitutes a set of highly conserved signaling pathways that play a key role in human development and many other cellular functions (Huminiecki et al., 2009;
Mas-sague´, 2012). With respect to the lung, TGF-b family proteins participate in normal lung
develop-ment and are dysregulated in COPD, emphysema, asthma, and pulmonary
fibrosis (Verhamme et al., 2015;Morris et al., 2003;Thomas et al., 2016). Genetic variants near TGF-b superfamily members TGFB2 (Castaldi et al., 2014; Cho et al., 2014),
ACVR1B(Boueiz et al., 2019),LTBP4(Wain et al., 2017), andBMP6(Loth et al., 2014) have been identified in GWAS for lung function and COPD, but prior to this study the region nearACVR1Bwas the only one linked to a gene in the TGF-bpathway through functional studies (Boueiz et al., 2019). Our findings demonstrate that the emphysema-associated variant rs1690789 is located in an active gene regulatory region in human lung fibroblasts that interacts with the promoter region ofTGFB2
and regulatesTGFB2expression.
These analyses highlight the genetic and gene regulatory complexity of this region. Conditional association analyses identified two independent associations with moderate centrilobular emphy-sema nearTGFB2, and both associations are in linkage equilibrium (i.e. low linkage disequilibrium) with the lead variant identified in a previous GWAS of severe COPD (Cho et al., 2014). In addition, the region containing rs1690789 has multiple interactions with other DNA regions, including the
TGFB2promoter and other downstream regions, indicating that this is a region of active chromatin interaction in human lung fibroblasts.
While our analyses provide evidence that the emphysema-associated GWAS region downstream fromTGFB2interacts with the promoter ofTGFB2and regulates the expression ofTGFB2in human primary lung fibroblasts, many important questions remain about the function of the emphysema-associated locus nearTGFB2. First, the rs1690789 variant appears to be an eQTL for expression of
TGFB2 in fibroblasts, but it is also strongly associated with TGFB2 expression in thyroid tissue in GTEx with an opposite direction of effect, suggesting complex and possibly context-dependent activity of this region. This is further supported by the observation that rs1690789 lies within a DNa-seI peak in some but not all fibroblasts in the ENCODE and Roadmap projects, suggesting that the regulatory element in this region may be active only in certain fibroblast subsets, under certain con-ditions, or that the regulatory activity of this region is influenced by common (but unmeasured) genetic variation in these cells. Additional investigations are warranted to examine the context-spe-cific function of this region. Second, our studies do not explain the function of the secondary associa-tion signal in this region, and it is also possible that both associaassocia-tion regions may have funcassocia-tional effects in other cell types that contribute to COPD susceptibility. Third, it is possible that even within a single, statistically independent association peak, there may be multiple functional variants in tight linkage disequilibrium that contribute to the emphysema-related effects of this region. Future func-tional screening studies of this region can address this question. Finally, gene-level funcfunc-tional studies will be required to characterize the functional consequences of increased and decreased TGFB2
expression on lung fibroblast function.
presence of a functional variant, rs1690789, that likely contributes to the genetic predisposition to emphysema by regulating TGFB2 expression in fibroblasts. This region has multiple independent association signals and an extensive pattern of chromosomal interaction, indicating that additional investigations are required to fully characterize the gene regulatory activity at this locus. In addition to the association nearTGFB2, we identified dozens of other high confidence regions in our colocali-zation analysis, indicating additional functional variants that could be identified by high-throughput functional characterization approaches such as massively parallel reporter assays or CRISPR-medi-ated mutagenesis.
Materials and methods
Study subjects
COPDGene
The Genetic Epidemiology of COPD Study (COPDGene, NCT00608764, www.copdgene.org) is an ongoing multicenter, longitudinal study designed to investigate the genetic and epidemiologic char-acteristics of COPD. The protocols for subject recruitment and data collection for the COPDGene study have been previously described (Regan et al., 2010). At baseline, COPDGene enrolled 10,192 Non-Hispanic White (NHW) and African-American (AA) subjects at 21 centers across the United States between the ages of 45 and 80 years with a minimum of 10 pack-years smoking history. Sub-jects represented the full spectrum of disease severity as defined by the Global Initiative for Chronic Obstructive Lung Disease (GOLD) spirometric grading system. In addition to completing detailed questionnaires, pre- and post-bronchodilator spirometry, and volumetric computed tomography of the chest, participants provided whole blood for DNA genotyping.
Genotyping was performed by Illumina (San Diego, CA) on the HumanOmniExpress array. Sub-jects were excluded for missingness, heterozygosity, chromosomal aberrations, gender check, popu-lation outliers, and cryptic relatedness. Genotyping at the Z and S alleles was performed in all subjects. Subjects known or found to have alpha-1 antitrypsin deficiency were excluded. Markers were excluded based on missingness, Hardy- Weinberg P-values, and low minor allele frequency. Imputation on the COPDGene cohorts was performed using MaCH and minimac (version 2012-10-09) (Li et al., 2010;Howie et al., 2012). Reference panels for the non- Hispanic whites and African-Americans were the 1000 Genomes3 Phase I v3 European (EUR) and cosmopolitan reference panels, respectively.
ECLIPSE
The Evaluation of COPD Longitudinally to Identify Predictive Surrogate Endpoints Study (ECLIPSE; SCO104960, NCT00292552,www.eclipse-copd.com) is a longitudinal study with three-year follow-up data available for 2501 smoking subjects (2164 subjects with COPD and 337 smoking controls). The detailed study protocol and inclusion criteria have been previously published (Vestbo et al., 2008). For this analysis, 1519 subjects with COPD (defined as GOLD spirometric stages 2–4) and available CT scans were analyzed. COPD was defined by FEV1 <80% of predicted and FEV1/ FVC < 0.7.
Genotyping was performed using the Illumina HumanHap 550 V3 (Illumina, San Diego, CA). Sub-jects and markers with a call rate of <95% were excluded. SubSub-jects with alpha-1 antitrypsin defi-ciency based on serum protein levels were excluded from this analysis. Population stratification and genotype imputation was performed using the same procedures and software as described above for COPDGene. GWAS models were adjusted for age, gender, pack-years of smoking history, and genetic ancestry via principal components.
Common variant genetic association analysis of LHE measures
We performed GWAS analyses of the 5 LHE measurements separately in the three cohorts (COPDG-ene NHW, COPDG(COPDG-ene AAs, and ECLIPSE, total N = 11,282 subjects, 18,383,174 SNPs imputed to the 1000 Genomes reference panel, version 3, hg19). Analysis was limited to imputed SNPs with an imputation r2>0.3. Imputed genotypes were analyzed using the –dosage command in PLINK v1.9
(Chang et al., 2015), though for SNPs with genotyped data the observed genotypes were used.
via principal components (Price et al., 2006). Results were meta-analyzed using the METAL (Willer et al., 2010) program using fixed effects meta-analysis with inverse variance weight-ing usweight-ing SNP effect sizes and standard errors. We analyzed SNPs with a MAF >1%, and we meta-analyzed SNPs with results in at least two of the three cohorts.
CT scan acquisition and generation of LHE measures
The generation of LHE measures in COPDGene has been previously described (Castaldi et al., 2013). For the current studies, additional LHE measures were generated in ECLIPSE CT scans using the same method.
Clinical associations of LHE measures in ECLIPSE
LHE measurements have been previously associated with key COPD-related measures (e.g. spirome-try, MMRC) (Castaldi et al., 2013). To test if this relationship was consistent in the measurements generated in ECLIPSE, we visualized the median percentage of each emphysema pattern by GOLD stage.
GWAS lookups of LHE significant variants in GWAS of FEV
1, FEV
1/FVC,
COPD, and smoking behavior
For the 14 lead SNPs associated with one or more of the LHE phenotypes at genome-wide signifi-cance, we queried other COPD-related GWAS for these variants or variants in linkage disequilibrium with these variants (r2>0.8 in the 1000 Genomes EUR reference panel). The queried GWAS studies were published studies of FEV1 and FEV1/FVC (Shrine et al., 2019), COPD status (Sakornsakolpat et al., 2019), or history of smoking. The smoking GWAS results were obtained from the UK Biobank Pheweb server (http://pheweb.sph.umich.edu:5000/) on July 7, 2019 for the phenotype ‘20116_1: Smoking status: Previous.’
eQTL data and colocalization analysis
For colocalization and cell type enrichment analyses, GWAS SNPs significant at p<510 5were
con-sidered. GTEx version six full results for 44 tissues were downloaded from the GTEx portal (https://
www.gtexportal.org/home/datasets), and eQTLs were calculated from blood RNAseq data in 385
NHW subjects from the COPDGene study using the same methods used in the GTEx Study v6 analy-sis. Details on the generation of COPDGene RNAseq data have been previously described (Parker et al., 2017). GWAS-eQTL integrative analysis was performed according to the approach previously described inCastaldi et al. (2015). Briefly, for each set of eQTL results, SNPs with a significantciseQTL association at a 10% FDR threshold were extracted from each of the five sets of LHE GWAS results. Q-values were calculated for each subset of GWAS SNPs separately using the q-value package (Storey et al., 2019), and SNPs demonstrating both significant eQTL and GWAS associations were retained for subsequent analysis (i.e. eQTL-GWAS SNPs). Within each set of eQTL-GWAS SNPs, association regions for colocalization were defined by selecting all SNPs within 250 kilobases (kb) of each independent GWAS association. Colocalization of the GWAS and eQTL signals in these regions was calculated using the Bayesian colocalization method implemented in the R package coloc (Giambartolomei et al., 2014) using the default settings for the prior proba-bility of a SNP being associated to target gene expression, the GWAS phenotype, and both meas-ures (prior probability 110 4, 110 4, and 110 5, respectively).
To confirm the colocalization results forTGFB2, colocalization was also performed for the GWAS results for moderate centrilobular emphysema using the Sherlock method (He et al., 2013). This analysis was performed using all the moderate centrilobular GWAS results referenced against three GTEx v6 eQTL datasets (transformed fibroblasts, lung, and whole blood). The following parameter settings were used: cis eQTL significance threshold p<0.001, trans eQTL significance threshold p<110 5.
Causal SNP estimation with PICS
information from 1000 Genomes reference populations. The EUR reference population was used for this analysis, which was conducted via the PICS web interface (https://pubs.broadinstitute.org/pubs/
finemapping/pics.php).
Identification of variants predicted to effect transcription factor
occupancy
For SNPs with a PICS causal probability of 5% or greater, we queried these SNPs against their Con-textual Analysis of Transcription Factor Occupancy (CATO) model predictions (Maurano et al., 2015), which was trained on deep DNaseI sequencing data from the Roadmap project to predict per-SNP effects on transcription factor occupancy based on the predicted effects of each SNP on the binding energy of overlapping TF motifs and a number of factors related to local genomic sequence content. SNPs exceeding a CATO score of 0.1 were considered likely to alter TF occupancy.
Cell type and cell line GWAS enrichment analysis with garfield
To determine whether LHE GWAS association were enriched in gene regulatory annotations from ENCODE and Roadmap Epigenomics data, we performed enrichment analysis for the LHE pheno-types with genome-wide significant results using the Garfield program and its pre-processed epige-nomic annotations (Iotchkova et al., 2019). The GWAS significance threshold was set at p<510 5,
and the default parameters were used for LD pruning (r2>0.1), LD proxy threshold (r2>0.8), minor allele frequency binning (five bins), LD tag binning (five bins), and TSS distance binning (five bins). The significance threshold was set at p<0.0001 corresponding to Bonferroni adjustment for the effective number of independent annotations.
Overlap of rs1690789 with cell-specific DNaseI peaks
Imputed DNaseI hypersensitivity peaks from Roadmap Epigenomics cell types or cell lines (Ernst and Kellis, 2015) were downloaded from
http://egg2.wustl.edu/roadmap/data/byFile-Type/peaks/consolidatedImputed/narrowPeak/. The overlap of rs1690789 with DNaseI peaks and
enhancer marks was identified using the GoShifter program (Trynka et al., 2015), and the raw DNa-seI data for these cell types was visualized using the UCSC Genome browser.
Cell culture
IMR-90 fibroblasts were purchased from ATCC and cultured in Eagle’s Minimal Essential Medium (EMEM, #12–611F, Lonza) supplemented with 10% fetal bovine serum, penicillin and streptomycin. The cells tested negative for mycoplasma by MycoAlert Detection Kit (#LT07-418, Lonza). Primary human lung fibroblast cells were isolated from the lung tissue of healthy individuals (Marsico Lung Institute, University of North Carolina at Chapel Hill, North Carolina) as previously described (Fulcher et al., 2005). Briefly, lung tissue samples were cut into small pieces and seeded onto culture dishes supplemented with DMEM/F12 medium, 10% fetal bovine serum, penicillin, streptomycin, amphotericin B and gentamicin. Amphotericin B and gentamicin were removed from the medium after the cells were passaged. The primary human lung fibroblasts were passaged twice and grown to 90% confluence prior to subsequent experiments. Human lung tissue was obtained under protocol #03–1396 approved by the University of North Carolina at Chapel Hill Biomedical Institutional Review Board.
4C data in IMR90 cell lines
4C chromosome conformation interaction results from the paper byRao et al. (2014)were queried from the Yue Lab public website (http://promoter.bx.psu.edu/) using the following search parame-ters: Species = human, Assembly = hg19, Tissue = IMR90, Type = Lieberman VC-norm, Resolu-tion = 10 kb, SNP = rs1690789, Extended Region = 500 kb.
Chromatin conformation capture assay (3C)-PCR
with unidirectional primers to indicate specific chromatin interaction by comparing relative band intensity from targeted regions against negative and positive control regions with three technical replicates (i.e. same 3C templates, multiple PCR repeats). Primer sequences used for 3C-PCR are listed inSupplementary file 1Table 10. Detailed description of our methods has been published previously (Zhou et al., 2012).
CRISPR/Cas9 rs1690789 knockout
To generate the rs1690789 CRISPR/Cas9 regional knockout primary human lung fibroblast cells, two guide RNAs (u1 forward: 5’- GATACTCCAGTACATTGAGAAGG-3’; u2 forward: 5’-TGGAGTATCA TTTCAGTGTTAGG-3’) located upstream from the SNP and two guide RNAs (d1 forward: 5’-CAG-CAGCGAGTTTGGCACTCAGG-3’; d2 forward: 5’-TGTCTCATTGCACACTCATGGGG-3’) located downstream from the SNP were cloned into pSpCas9 (BB) 2A-Puro (PX459) V2.0 vectors (Addgene plasmids #62988), individually. Plasmids were verified by DNA sequencing. FuGENEHD was applied to transfect three pairs of gRNA plasmids (u1 and d1, u1 and d2, u2 and d2) into primary normal human lung fibroblast (NHLF) cells according to the manufacturer’s instructions. PX459 empty vec-tors were transfected as control. Forty-eight hours after transfection, cells were selected with 1.2mg/ mL puromycin. After 2–3 weeks of recovery and expansion, cells were collected for DNA, RNA extraction and qPCR. Four biological replicates were performed (i.e. same donor, four different transfections).
Assessment of CRISPR/Cas9 editing efficiency
DNA samples from human lung fibroblast cells were extracted using QuickExtract DNA Extraction solution (#QE0905T, Lucigen, WI) following manufacturer’s instructions. SYBRGreen dye-based quan-titative RT-PCR was performed using the same equipment system and analysis method mentioned above, with the following primers to assess editing efficiency (forward: 5’- GTTACCGATGCTTAAA TGCCAC-3’; reverse: 5’- AGAATATCCCCATGAGTGTGC-3’). The control was cells transfected with PX459 empty vector.
Gene expression measurements by RT-PCR
Human lung fibroblast cell RNA was extracted using RNeasy Mini Kit (#74106, Qiagen, MD), and reverse transcription was performed by using High-Capacity cDNA Reverse Transcription Kit (#4374966, Applied Biosystems, MA). Quantitative RT-PCR was performed on QuantStudio 12K Flex Real-Time PCR System (Applied Biosystems) with gene-specific TaqMan probes (Hs.PT.58.24824921) from IDT (Integrated DNA technologies, IA) for detectingTGFB2 expression. Relative gene expres-sion level was calculated based on the standard 2 DDCT
method, usingGAPDHas a reference gene. For both the TGFB2 expression and editing efficiency tests, qPCR values were normalized against the mean qPCR value for the control cells for each experiment. Comparisons were performed using unpaired t-tests.
Study approval
Written, informed consent was obtained for all participants, and all study and consent forms were approved by the institutional review boards of the participating institutions.