PoS(LeptonPhoton2019)056
Yury Shitov∗Joint Institute for Nuclear Research, Dubna, Russia E-mail:[email protected]
On behalf of the DANSS collaboration
The DANSS is a highly segmented m3ν¯-spectrometer aimed to search for SBL sterile neutrino
oscillations in the reactor sector, as well as to solve applied tasks of monitoring the power and
fuel composition of a nuclear reactor [1]. The detector measures the ¯ν-spectrum by the IBD
method from an industrial nuclear reactor (3.1 GWth, KNNP, Rusia) at distances 10.7-12.7 m
from the core using a mobile platform. The search for sterile neutrino oscillations is carried out through the analysis of the bin-per-bin ratios of the positron energy spectra collected at different distances from the reactor. This relative method is free from systematic errors associated with the calculation of the reactor antineutrino spectra and detector efficiency.
The new results of the DANSS experiment are presented here based on more than 2.1 million
events collected in 2016-2019 (2.4-fold increase over published data [1]). With the current full
data set we do not have a statistically significant sign of the sterile neutrino oscillations excluding
further the large and interesting portion of the 3ν+1ν model phase space. The DANSS’s
abil-ities to measure nuclear fuel composition and to monitor reactor power at high precision (with 1.5/0.5% statistical/systematical uncertainties reached in 2 days of exposure) in long-term scale (during 17 months) have been also undoubtedly demonstrated.
XXIX International Symposium on Lepton Photon Interactions at High Energies - LeptonPhoton2019 August 5-10, 2019
Toronto, Canada
PoS(LeptonPhoton2019)056
trinos. Expected phase space range of this mixing∆m2 ∈[0.1-10] eV2, sin2(2θ) ∈[0.001-0.01]was determined from the global fit of the available experimental data (RAA + GA) with the best fit value∆m2∼2 eV2, sin2(2θ)∼0.1 [7]. Recent experimental hints of possible existence of this new fundamental physics have boosted a huge activity toward experimental tests of this hypothesis in different directions of physical researches.
2. The DANSS detector
The highly segmented (2500 1 x 4 x 100 cm3strips made of plastic scintillator viewed by 2500 SiPMs and 50 PMTs) compact DANSS detector covered by multilayer passive shield and active µ-veto (a detailed description is in [8]) is mounted under the Unit #4 (3.1 GWth) of the Kalinin nuclear power plant (KNPP) on a mobile platform. Data are taken at three distances 10.7 m (Top), 11.7 m (Middle), and 12.7 m (Down) from the reactor (center to center) changed sequentially with a full cycle of passage through 3 positions in a week.
Background control. Permanentγ and neutron background monitoring is carried out inside and outside of the DANSS spectrometer. In addition to this, the (θ,φ) 2D-map of intensity ofµ-flux was measured using the specially designedµ-meter setup. It is also important to emphasize that the reactor and water storage for spent fuel under the DANSS spectrometer provide∼50 m.w.e. protection against cosmic rays, which is very important for background suppression.
The signal signature. The IBD (Inverse Beta Decay) process ¯ν+p→e++n+1.81MeV is used to detect the reactor ¯ν. The positron gives the first (fast, prompt) hit, followed by the second delayed signal in [2-50]µs window from the thermalized neutron captured by gadolinium, introduced into the strip coating (∼0.35 % w.r.t. the whole mass). IBD-signature provides perfect background suppression.
CalibrationsVarious time and energy calibrations are performed regularly using a number of sources: cosmic muons,22Na,60Co,137Cs, and248Cm (see details in the dedicated paper [9]). An important recent innovation in the calibrations is the use of aβ-spectrum of 12B, which is very similar to the positron spectrum from a IBD-signal. Cosmic muon entering the detector (prompt signal) generates a high-energy neutron, which in turn causes the12C(n,p)12Breaction followed by an electron fromβ-decay of12B (T1/2= 20.2 ms, delayed signal). We have used12B calibration data (Fig.1) in order to fix energy scale of a positron spectrum. Also calibrations are more frequent (gain/MIP calibrations are done every 15 min/2 d respectively).
3. Data analysis and results
PoS(LeptonPhoton2019)056
Figure 1: Energyβ-spectrum of12B (in the left picture) and12B decay time distribution. Red curves areMC, while blue and green points are experimental data.
(use of SiPM and PMT signal shapes for T0 and charge determination), MC simulations (signal WF simulations, taking into account Birks effect and Cherenkov radiation), and modified cuts (requirement for PMT-SiPM coincidences to suppress noise, requirement of annihilation photons for 1strip positron clusters to reduce accidental/neutron background). The two lowest detector layers were added to the VETO system. It allowed us to reduce: i) accidental energy added to positron from 100 keV down to 5 keV; ii) accidental coincidence background(ACB) from 71% down to 29% @ Top position; iii)not vetoed cosmic background(NCB) from 2.8% down to 1.9%.
Figure 2:Top: measured IBD-spectra before (blue dots) and after (green dots) subtraction of the ACB (dark red dots) with MC IBD signal shown by red curve. Bottom left: reactor OFF spectra (blue dots) fitted by the VCB (red dashed curve) and the FNB (green dashed curve). Bottom right: the VCB (red dots) tagged by VETO in comparison with ¯ν-signal (blue dots).
Statisticshas been increased from 0.97 up to 2.1 million IBD events includingfirst data col-lected in [10/2016-07/2017] andnew datacollected in 09/2017-01/2019. Sensitivity of experiment
PoS(LeptonPhoton2019)056
between e+/n vertices≤55 cm) was used to suppress the ACB futher (see Fig.2, top right).2) Thefast neutron background(FNB) was subtracted, which was linearly extrapolated from high energy region of reactor OFF data (Fig.2, bottom left).
3) Thevisible cosmic background(VCB) has been directly rejected by VETO (30.9% of neu-trino signal @ Top position, see Fig.2, bottom right).
4) The NCB presents in the IBD-signal due to VETO inefficiency, which was determined to be 6.2% analysing reactor OFF data. The NCB was finally substracted from IBD-signal (in the shape of the VCB) at level of 1.9% (6.2%*30.9%).
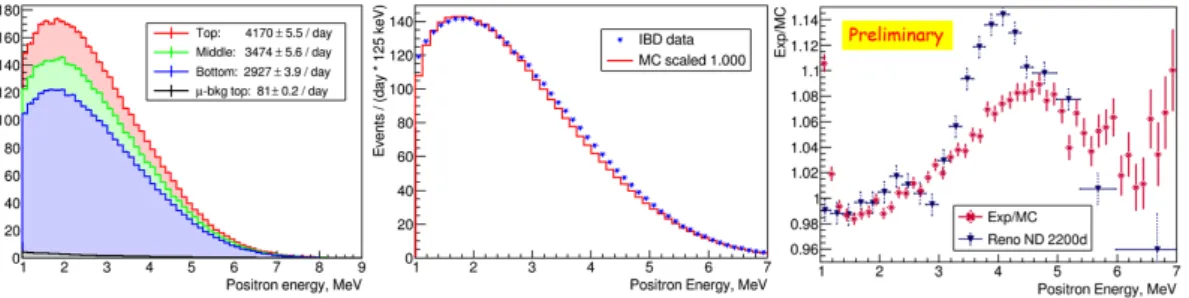
The energy spectra. As a result, the final analyzed spectra do not contain any background components (Fig.3, left, more details about analysis procedure, cuts, etc. are in [1]). The DANSS spectrometer is counting above 4000 ¯ν/d in fiducial volume (78% of all) @ Top position.
Figure 3:Left: reactor ¯ν-spectra measured @ 3 positions by the DANSS. Middle: experimental (blue dots)
vs HM-model (red curve). Right: bin-per-bin ratio of exp. vs theor. ¯ν-spectra for the DANSS (red dots) and
the RENO (blue dots) data [10].
The bump problem. Experimental spectrum is in rough agreement with MC using Huber-Muller (HM) model (Fig.3, middle). Ratio of experimental vs theory data shows some structure (Fig.3, right), but we have no conclusion on the bump existence at the moment due to high sensi-tivity to the energy scale. More work on calibration is required before precision comparison.
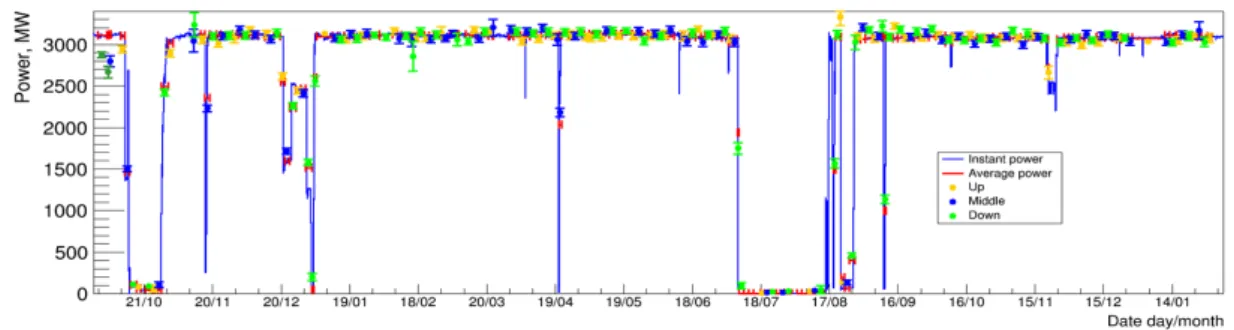
Monitoring of nuclear power and fuel composition. The DANSS is permanently monitor-ing reactor since October 2016 (Fig.4). Reactor power is measured by the DANSS with neutrino flux with 1.5% accuracy in 2 days of exposure. The DANSS is also sensitive to the fuel composi-tion demonstrating clear evidence of spectrum evolucomposi-tion in bin-per-bin ratio of ¯ν-spectra collected during 4 months at the start and end of the reactor fuel cycle campaign (Fig.5).
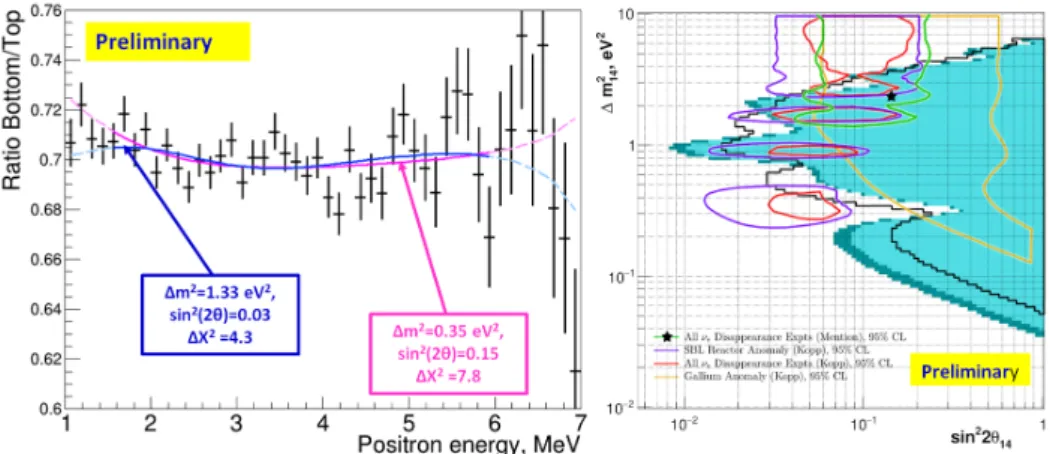
The oscillation testshave been made using Gaussian CLs method [12] (for e+ in 1.5-6 MeV to be conservative), which is also more conservative than usual CI method. The ratio of e+-spectra measured at Down vs Top positions for the current full dataset (2.1 millions ¯ν, Fig.6, left) shows
PoS(LeptonPhoton2019)056
Figure 4: The reactor power (Unit #4 of the KNPP, blue curve) vs the DANSS measurements in the Top(orange dots), Middle (blue dots), and Down (green dot) positions equalized by 1/r2 and normalized to
reactor data at 12 points in 11-12/2016. Backgrounds and adjacent reactor fluxes (0.6%) has been subtracted. Fuel composition has been taken into account. The time range is 10/2016-02/2019. The DANSS results are based on the previous analysis described in [1].
Figure 5: Bin-per-bin ratio of ¯ν-spectrum collected in the last 4 months of the fuel campaign to the ¯ν -spectrum collected in the 2-5 months of the next fuel campaign. Experimental (green dots, stat. errors only) vs MC (blue dots) data. Campaign’s fuel compositions are given in the table.
no significant sign of the sterile neutrino effect with the best fit (∆m2=0.35eV2,sin2(2θ) =0.15)
at CL = 1.8σ only (∆χ2=7.8).
Exclusion regions were calculated taking into account the following systematics: energy reso-lution is +/-10%; energy scale is +/-2%; the NCB is +/-25%; flat background (mostly the FNB) is +/-30%. The influence is small, and results of our method are independent from shape of reactor
¯
ν-spectrum and detector efficiency. Current analysis has allowed to extend excluded area of sterile
4ν-model phase space in comparison with our first results (Fig.6, right) [1].
Acknowledgments The DANSS collaboration is grateful to the directorates of ITEP, JINR, KNPP administration and Radiation and Nuclear Safety Departments for constant support of this work. The detector construction was supported by the Russian State Corporation ROSATOM (state contracts H.4x.44.90.13.1119 and H.4x.44.9B.16.1006). The operation and data analysis is par-tially supported by the Russian Science Foundation, grant 17-12-01145.
PoS(LeptonPhoton2019)056
Figure 6:Left: the ratio of e+-spectra measured at Down vs Top positions (black dots) for 2.1 millions ¯ν-swith current best fit (magenta curve). The fit with the previous best point is also shown (blue curve). Right: the DANSS sensitivity (black curve) and 90%/95% (dark cyan/light cyan shadow areas) CL exclusion plots in 4ν-model phase space based on the current full dataset. Other color curves show expected oscillation
regions for different data [7] with the RAA+GA best fit point (black star) [11].
References
[1] I Alekseev et al. Search for sterile neutrinos at the DANSS experiment. Phys. Lett., B787:56–63, 2018.
[2] Th. A. Mueller et al. Improved Predictions of Reactor Antineutrino Spectra. Phys. Rev., C83:054615, 2011.
[3] J. N. Abdurashitov et al. Measurement of the response of a Ga solar neutrino experiment to neutrinos from an Ar-37 source. Phys. Rev., C73:045805, 2006.
[4] Carlo Giunti and Marco Laveder. Statistical Significance of the Gallium Anomaly. Phys. Rev., C83:065504, 2011.
[5] C. Athanassopoulos et al. Evidence for anti-muon-neutrino —> anti-electron-neutrino oscillations from the LSND experiment at LAMPF. Phys. Rev. Lett., 77:3082–3085, 1996.
[6] A. A. Aguilar-Arevalo et al. Significant Excess of ElectronLike Events in the MiniBooNE Short-Baseline Neutrino Experiment.Phys. Rev. Lett., 121(22):221801, 2018.
[7] Joachim Kopp, Pedro A. N. Machado, Michele Maltoni, and Thomas Schwetz. Sterile Neutrino Oscillations: The Global Picture.JHEP, 05:050, 2013.
[8] I. Alekseev et al. DANSS: Detector of the reactor AntiNeutrino based on Solid Scintillator.JINST, 11(11):P11011, 2016.
[9] I. G. Alekseev et al. DANSS Neutrino Spectrometer: Detector Calibration, Response Stability, and Light Yield. Phys. Part. Nucl. Lett., 15(3):272–283, 2018.
[10] G. Bak et al. Measurement of Reactor Antineutrino Oscillation Amplitude and Frequency at RENO.
Phys. Rev. Lett., 121(20):201801, 2018.
[11] G. Mention, M. Fechner, Th. Lasserre, Th. A. Mueller, D. Lhuillier, M. Cribier, and A. Letourneau. The Reactor Antineutrino Anomaly.Phys. Rev., D83:073006, 2011.
[12] X. Qian, A. Tan, J. J. Ling, Y. Nakajima, and C. Zhang. The Gaussian CLsmethod for searches of new physics.Nucl. Instrum. Meth., A827:63–78, 2016.