Instruction
Manual
VisiSens AnalytiCal 2
Software
© 2014 PreSens Precision Sensing GmbH
VisiSens AnalytiCal 2
Specification:
Software for the VisiSens A2 pH Imaging System
Version VA2.10Document filename: IM_VA2_dv2
All rights reserved. No parts of this work may be reproduced in any form or by any means – graphic, electronic, or mechanical, including photocopying, recording, taping, or information storage and retrieval systems – without the written permission of the publisher.
Products that are referred to in this document may be either trademarks and/or registered trademarks of the respective owners. The publisher and the author make no claim to these trademarks.
While every precaution has been taken in the preparation of this document, the publisher and the author assume no responsibility for errors or omissions, or for damages resulting from the use of information contained in this document or from the use of programs and source code that may accompany it. In no event shall the publisher and the author be liable for any loss of profit or any other commercial damage caused or alleged to have been caused directly or indirectly by this document.
Specifications may change without prior notice.
Manufacturer PreSens Precision Sensing GmbH Josef-Engert-Str. 11 93053 Regensburg, Germany Phone +49 941 94272100 Fax +49 941 94272111 [email protected] www.PreSens.de
© 2014 PreSens Precision Sensing GmbH
Table of Contents
1 Preface ... 3
2 Description of the VisiSens AnalytiCal 2 Software ... 5
3 Installation ... 7
4 Acquisition Module ... 12
4.1 Starting the Software and VisiSens Detector Unit ... 12
4.2 VisiSens AnalytiCal 2 Acquisition Module ... 13
4.3 Session Manager ... 15
4.3.1 Create a New Session ... 15
4.3.2 Open a Session... 16
4.4 Detector Unit Control ... 18
4.5 Settings ... 19 4.5.1 Camera Settings ... 20 4.5.2 General Settings ... 20 4.5.3 System Settings... 21 4.6 Measurement ... 22 4.6.1 Single Measurement ... 22
4.6.2 Time Drive Measurement ... 22
4.6.3 Averaging Images for Noise Reduction ... 24
4.7 View Picture ... 26
5 Evaluation Module ... 27
5.1 Basic Functions ... 28
5.1.1 Load Measurement Data ... 28
5.2 Display Functions ... 30
5.3 Calibration ... 34
5.3.1 Recording Images for the Calibration ... 35
5.3.2 Performing the Calibration in the Evaluation Module ... 35
5.4 Evaluation Functions ... 40 5.4.1 Z-Axis Profiles ... 41 5.4.2 Live Profiles ... 42 5.4.3 ROI Statistics ... 43 5.4.4 Follow Kinetics ... 44 5.4.5 Pseudocolor Image ... 44 5.4.6 Histogram ... 45 5.4.7 3D Plot ... 45 5.4.8 Multiple Plots ... 46 6 Concluding Remarks ... 47
3 VisiSens AnalytiCal 2
© 2014 PreSens Precision Sensing GmbH
Preface
1 Preface
You have chosen a new, innovative technology for measuring pH.
VisiSens A2 is a compact and easy to transport PC controlled device for 2D mapping of pH distributions within samples or on surfaces. Data acquisition and evaluation is PC supported. VisiSens A2 is based on a novel technology, which creates stable, internally referenced measured values. This allows a more flexible use of pH sensors in various fields of interest. Chemical optical sensors (also called optrodes) have several important features:
They allow 2D-sensing (imaging) of pH distributions. They allow very high spatial resolution down to 25 µm.
They may be cut into any desired shape using a pair of scissors. Their signal does not depend on the flow rate of the sample.
They can be physically divided from the measuring system which allows a non-invasive measurement.
They can be used in disposables.
Therefore, they are ideally suited for imaging pH distributions of samples of any shape, for highly parallelized measurements in disposables, and for biotechnological applications. VisiSens A2 consists of 3 components listed in the table on the next page. For detailed information please refer to the respective instruction manual.
4 VisiSens AnalytiCal 2
© 2014 PreSens Precision Sensing GmbH
Preface
Component Name Specification Instruction Manual
Detector device
DU01 Detector unit for spectral 2D read-out of fluorescent oxygen sensor foils
Detector Unit DU01/02/03 for VisiSens A1 / A2 / A3
DU02 Detector unit for spectral 2D read-out of fluorescent pH sensor foils
DU03 Detector unit for spectral 2D read-out of fluorescent CO2 sensor foils
Software VisiSens AnalytiCal 1
Software for the VisiSens A1 oxygen imaging system
VisiSens AnalytiCal 1 Software
VisiSens AnalytiCal 2
Software for the VisiSens A2 pH imaging system
VisiSens AnalytiCal 2 Software
VisiSens AnalytiCal 3
Software for the VisiSens A3 CO2
imaging system
VisiSens AnalytiCal 3 Software
Sensor foil SF-RPSu4 Oxygen sensor foils for imaging sample surfaces or through
transparent glass or plastic vessels
Oxygen Sensor Foils for Imaging
SF-RPSu4 SF-HP5R
SF-LV1R
pH sensor foils for imaging sample surfaces or through transparent glass or plastic vessels
pH Sensor Foils for Imaging SF-HP5R & SF-LV1R
SF-CD1R & SP-MT1R
CO2 sensor foils for imaging sample
surfaces or through transparent glass or plastic vessels
CO2 Sensor Foils for
Imaging SF-CD1R & SF-MT1R
Please feel free to contact our service team to find the best solution for your application. Your PreSens Team
PLEASE READ THE FOLLOWING INSTRUCTIONS CAREFULLY BEFORE WORKING WITH THIS DEVICE. WHEN DISREGARDING THESE INSTRUCTIONS THE SAFETY OF THE DEVICE CAN BE IMPAIRED.
5
VisiSens AnalytiCal 2 Description of the VisiSens AnalytiCal 2 Software
© 2014 PreSens Precision Sensing GmbH
2 Description of the VisiSens
AnalytiCal 2 Software
The software for the VisiSens A2 pH imaging system allows controlling the image recording process and assists image processing and evaluation.
An easy to use acquisition module manages image acquisition and storage. Measurements which belong together can be organized as user defined sessions in separate folders and annotated with a free text comment. Single images or time series measurements can be performed to analyze both spatial and temporal changes in analyte concentration.
The software´s evaluation module allows image processing and multiple options for image display. For analysis a number of functions are supplied. The software is delivered on a USB stick that comes with the VisiSens detector unit DU02. (Please refer to the detector unit instruction manual “Detector Unit DU01/02/03 for VisiSens A1/A2/A3” for further information.)
6
VisiSens AnalytiCal 2 Description of the VisiSens AnalytiCal 2 Software
© 2014 PreSens Precision Sensing GmbH
System requirements:
!
Operating VisiSens AnalytiCal 2 on two computer screens with different screen resolution is not possible.
Minimum System Requirements
Suggested Configuration
Operating system Microsoft® Windows® XP / VistaTM or 7
(32 or 64 Bit)
Microsoft® Windows® 7 (64 Bit)
Processor 2.4 GHz Pentium IV or adequate AMD Athlon Processor
Intel “i” series or adequate AMD Processor (or higher)
RAM 2 GB 4 GB or more
Memory capacity for graphic board
256 MB 1 GB or more
Hard disk 1 GB free memory 250 GB or more free memory
USB USB 2.0 USB 2.0
Screen resolution 1366 x 768 (16 : 9) or 1280 x 800 (16 : 10) or 1280 x 1024 (5 : 4)
1680 x 1050 or higher (16 : 9 or 16 : 10)
7
VisiSens AnalytiCal 2 Installation
© 2014 PreSens Precision Sensing GmbH
3 Installation
1. Please close all other applications as they may interfere with the software.
2. Insert the supplied USB stick / CD into a USB port / respective drive of your PC /
notebook. If no dialog opens automatically, use the explorer to open the file menu on the USB drive.
3. Start the VA2_10_Setup.exe from the directory; it will guide you through the installation process.
4. Installation files will be extracted.
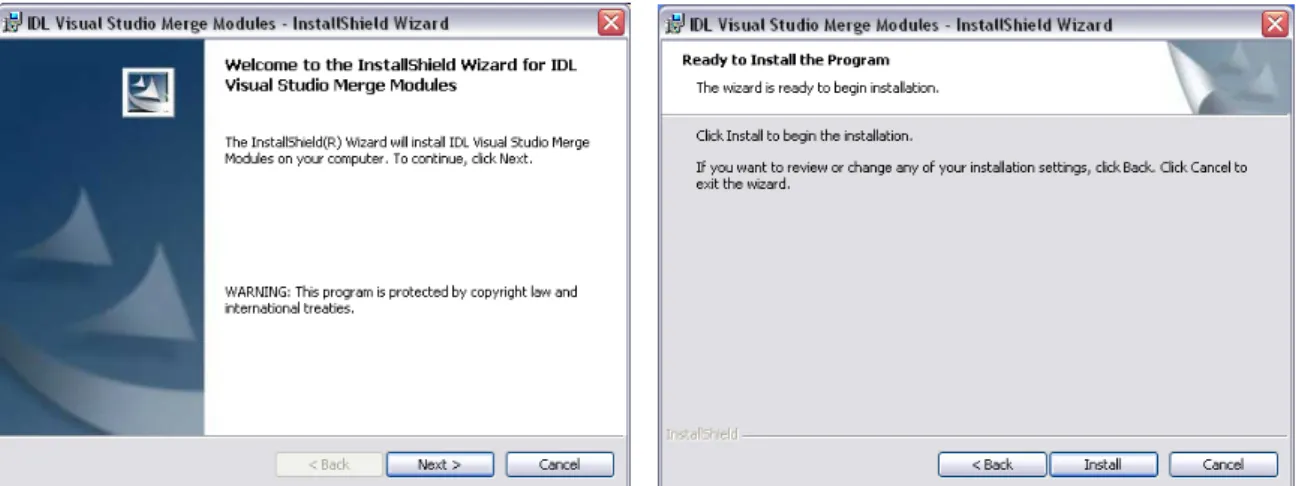
5. The VisiSens AnalytiCal 2 Installer window opens. Press the Start Install button to start the installation.
6. The IDL Visual Studio Merge Modules will be installed first. Click Next to continue then
Install. If the merge modules are already installed on the PC / notebook, you can press
Cancel and continue with the VisiSens AnalytiCal 2 software installation.
Fig. 2 Extracting the installation files
8
VisiSens AnalytiCal 2 Installation
© 2014 PreSens Precision Sensing GmbH
Click the Finish button when the program is successfully installed.
7. When the InstallShield Wizard for the IDL Visual Studio Merge Modules is closed you will get back to the VisiSens AnalytiCal 2 Installer window. Now you can start installing the software by pressing Install VisiSens AnalytiCal 2.
Fig. 4 IDL Visual Studio Merge Modules InstallShield Wizard – ready to install the program
Fig. 6 VisiSens AnalytiCal 2 Installer
Fig. 5 Installation of the IDL Visual Studio Merge Modules completed
9
VisiSens AnalytiCal 2 Installation
© 2014 PreSens Precision Sensing GmbH
8. The VisiSens AnalytiCal 2 Setup Wizard opens. Press Next to proceed.
In case Microsoft.NET Framework 4 is not installed on your system, the setup will install the required components from the USB drive to your computer prior to installing VisiSens AnalytiCal 2.
9. The Select Installation Folder window opens. The Installer will create a folder or you can select a folder in which the software will be installed. If you want other users of the PC to be able to use VisiSens AnalytiCal 2 you can select Everyone in the Select Installation Folder window.
!
This will not change the security settings of your operating system. Please make sure, all users of this PC have read and write permissions for the installed folder.10
VisiSens AnalytiCal 2 Installation
© 2014 PreSens Precision Sensing GmbH
You have to confirm the installation by clicking Next, and then the installation process will start.
Fig. 8 Select Installation Folder
11
VisiSens AnalytiCal 2 Installation
© 2014 PreSens Precision Sensing GmbH
10. Press Close in the Installation Complete window and Exit in the VisiSens AnalytiCal 2 Installer. You have finished installing the VisiSens AnalytiCal 2 software.
Fig. 10 Installation Complete window
12
© 2014 PreSens Precision Sensing GmbH
VisiSens AnalytiCal 2 Acquisition Module
4 Acquisition Module
4.1 Starting the Software and VisiSens Detector Unit
1. Connect the VisiSens detector unit DU02 to a USB port of your PC / notebook.
(Please refer to the detector unit instruction manual for more information about connecting and handling the device.)
2. Please close all other applications as they may interfere with the software. Start the VisiSens AnalytiCal 2 software.
3. In case the software is unable to detect the VisiSens detector unit an information window is displayed. Make sure the VisiSens detector unit is connected correctly to a USB port of your PC / notebook and click OK.
4. After successful initialization the acquisition module is displayed.
The detector unit does not have to be connected, if you want to do evaluation of already recorded pictures. Just press OK on the Camera not found window and proceed with opening the session you want to evaluate.
Fig. 12 Information window – the software has been unable to detect the VisiSens camera
13
© 2014 PreSens Precision Sensing GmbH
VisiSens AnalytiCal 2 Acquisition Module
4.2 VisiSens AnalytiCal 2 Acquisition Module
Structure:
1. Menu bar: Displays the main menus.
2. Button panel: Shows all function buttons and the Current Session Name.
3. Measurement gallery: Displays thumbnails of the captured pictures.
4. Main video capture panel: Shows the picture currently recorded with the VisiSens detector unit.
5. Status bar: Displays used and free disk space.
Fig. 13 VisiSens AnalytiCal 2 acquisition module
1
2
3
4
14
© 2014 PreSens Precision Sensing GmbH
VisiSens AnalytiCal 2 Acquisition Module
BUTTON MENU DESCRIPTION
File / Start Camera Ctrl + S
Start live display: Turn the camera on. If this button is highlighted green, the camera is currently turned on.
File / Stop Camera Ctrl + T
Stop live display: Turn the camera off. If this button is highlighted red, the camera is currently turned off.
Options / Free Scan Ctrl + Shift + F
Single measurement: A single picture of the current measurement will be captured. Options / Evaluate
Ctrl + Shift + E Evaluate: The evaluation module opens. Edit / Open Image Folder
Ctrl + I
View picture: A dialog window opens, in which sessions and measurement data can be selected from a list and a preview image of the selected file is shown.
Edit / Add Comment to Session
Enter comment: A dialog window opens, in which a comment for the current session can be added.
Options / Time Drive Measurement Ctrl + Shift + T
Time drive measurement: A dialog window opens, in which the interval and number of time series measurements can be selected.
15
© 2014 PreSens Precision Sensing GmbH
VisiSens AnalytiCal 2 Acquisition Module
4.3 Session Manager
The Session Manager is displayed first whenever VisiSens AnalytiCal 2 is started. If the software is running for the first time the Session Manager will give you the option to create a new session.
4.3.1 Create a New Session
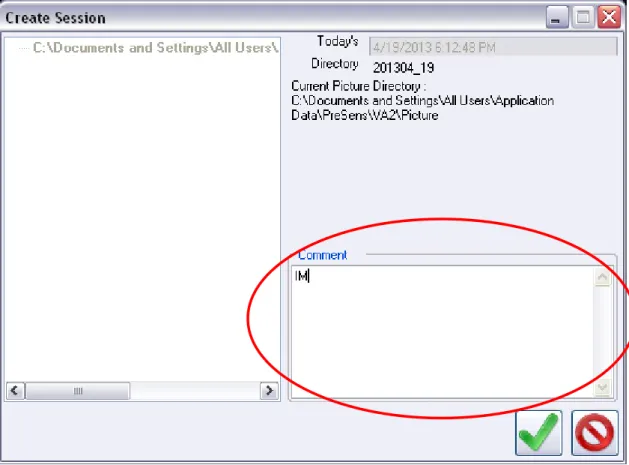
Click the Create button in the Session Manager, to get to the Create Session dialog.
Fig. 14 Initial software screen – the Session Manager is displayed
Fig. 15 Session Manager, when the software is run for the first time.
16
© 2014 PreSens Precision Sensing GmbH
VisiSens AnalytiCal 2 Acquisition Module
The Create Session dialog displays the current date and time, and the directory in which the measurement data will be stored. You can add a comment to your measurement in the respective box. Then click to save changes and close the Session Manager, or press to cancel.
You can also use the menu bar to create a new session. Press File / Create Session to open the Create Session dialog.
4.3.2 Open a Session
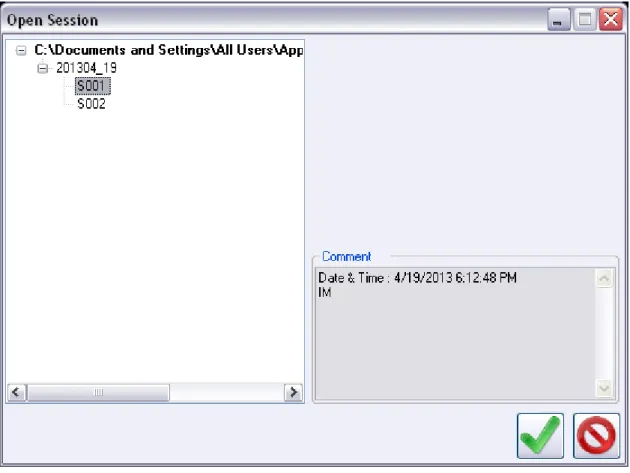
If the software had been used before you can either create a new session (see previous chapter) or open an already existing session with the Session Manager.
Fig. 16 Create Session dialog
Fig. 17 Session Manager, when the software had been run before
17
© 2014 PreSens Precision Sensing GmbH
VisiSens AnalytiCal 2 Acquisition Module
The Open Session dialog displays the file directory in which previous sessions are stored. You can select the respective session by clicking on it. In the Comment box you can see the time and date when the respective session had been created and the comment you have added. Then click to open the session and close the Session Manager, or press to cancel.
You can also use the menu bar to open an existing session. Press File / Open Session to open the dialog.
18
© 2014 PreSens Precision Sensing GmbH
VisiSens AnalytiCal 2 Acquisition Module
4.4 Detector Unit Control
The detector unit will start automatically when starting the software.
The camera settings of the current session will be loaded. To change the camera settings please refer to chapter 4.5.1.
You can stop the detector unit by using the button or the submenu File / Stop Camera. Starting the detector unit can be done by using the button or the submenu File / Start Camera. After starting the software and detector unit, you will have to focus the detector unit first. Use the dial on the detector unit side to focus the camera on the edge of the sensor foil or use the small transparent foil with 5 mm measurements on it (placed in front of the detector unit at the same distance as the sensor will be). Turn the dial until the image turns sharp.
19
© 2014 PreSens Precision Sensing GmbH
VisiSens AnalytiCal 2 Acquisition Module
4.5 Settings
Use the submenu Options / Settings to open the Settings window.
Fig. 20 Settings submenu
20
© 2014 PreSens Precision Sensing GmbH
VisiSens AnalytiCal 2 Acquisition Module
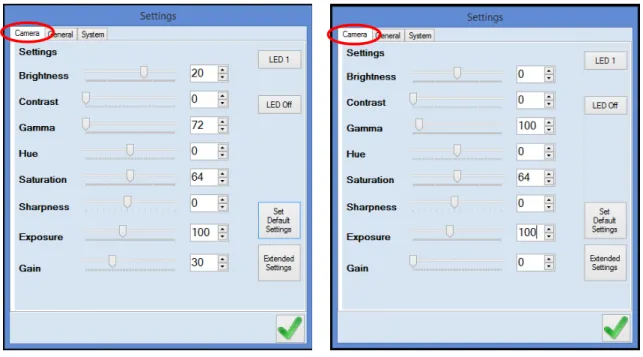
4.5.1 Camera Settings
The Camera settings tab is only accessible when the detector unit is switched on.
Fig. 22 shows the default settings for SF-HP5R and SF-LV1R sensor foils respectively. It is recommended to use the default camera settings for your measurement set-up first. If necessary you can change the values for Brightness and Exposure according to your measurement set-up.
The button LED 1 willswitch on the LEDs, and with LED Off the LED lights can be turned off again. Set Default Settings will restore all settings to their default value. The button
Extended Settings will open a dialog box for camera settings.
4.5.2 General Settings
The General settings tab gives information about the general software settings. The dialog shows, which directory is used for storing the settings files, measurement pictures, and sessions. Also the current session name and directory is displayed. By pressing Change Picture Directory you can change the measurement storage directory.
Fig. 22 Camera settings for SF-HP5R sensor foil and for SF-LV1R sensor foil If necessary change values for Brightness and Exposure only!
21
© 2014 PreSens Precision Sensing GmbH
VisiSens AnalytiCal 2 Acquisition Module
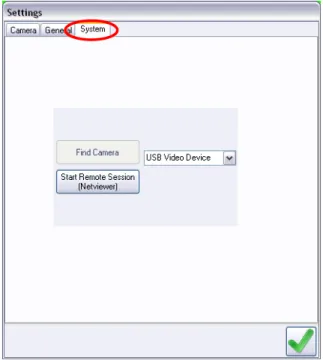
4.5.3 System Settings
On the System settings tab you can use the button Start Remote Session (Netviewer) to open the netviewer meet software and communicate with PreSens.
The other button is currently inactivated.
The drop down menu shows all available cameras currently connected to or integrated in your PC / notebook. In case you have more than one VisiSens detector unit connected you can choose between detector units using this drop down menu.
Fig. 23 General settings
22
© 2014 PreSens Precision Sensing GmbH
VisiSens AnalytiCal 2 Acquisition Module
4.6 Measurement
4.6.1 Single Measurement
To record a single image of your measurements use the button or the submenu Options / Free Scan. This will store a single picture of the measurements currently taken by the
detector unit. A thumbnail of the recorded picture is displayed in the measurement gallery. The filename of a single image taken contains “XX-” and the respective number.
4.6.2 Time Drive Measurement
To record a time series of measurements you can press the button or use the submenu
Options / Time Drive Measurement. This will open the Time Drive dialog. In this dialog you can set the time Interval at which the measurements will be taken and the Total No of measurements you want to take. The smallest possible Interval is 2 seconds. Type into the box or use the up and down arrows to adjust the settings. Then click to start
measurements and close the dialog, or press to cancel. During measurements the button will be blinking.
23
© 2014 PreSens Precision Sensing GmbH
VisiSens AnalytiCal 2 Acquisition Module
Thumbnails of the recorded pictures are displayed in the measurement gallery and a status window of the running time series measurement is shown. Pressing in the status window will stop the time series measurements.
Fig. 26 Time Drive dialog
Fig. 27 Time Drive status window
Fig. 28 Running Time Drive Measurement – thumbnails of the recorded pictures are displayed in the measurement gallery and the status window is displayed in the main video capture panel
24
© 2014 PreSens Precision Sensing GmbH
VisiSens AnalytiCal 2 Acquisition Module
An information window opens when time series measurements are completed. Click OK to continue. The filename of images taken in a time series contains the respective session number, e. g. “01-“, and the number of the image.
4.6.3 Averaging Images for Noise Reduction
VisiSens AnalytiCal 2 supports automatic image averaging for noise reduction. This option evens out random fluctuations of the recorded pixel values referred to as dark- or read-out noise. If applied, this option helps increasing visibility and evaluation of measured analyte gradients or distributions.
In case you select an Interval of 1 min or above the Average option appears in the Time Drive Administration. You can choose the number of pictures (from 1 to 6) to be used for calculating one Average image, which will be stored following the VisiSens file name rules. The images get recorded one after another during time series acquisition. Processing takes a few seconds, so this option only makes sense when measuring steady state analyte
distribution or distributions showing very slow changes over time; this is why the Average
function is not selectable for time intervals below 60 seconds.
Fig. 29 Time Drive dialog: Average
25
© 2014 PreSens Precision Sensing GmbH
VisiSens AnalytiCal 2 Acquisition Module
26
© 2014 PreSens Precision Sensing GmbH
VisiSens AnalytiCal 2 Acquisition Module
4.7 View Picture
Use the button or the submenu Edit / Open Image Folder to look at recorded
measurement pictures of the current session or select another session from the directory. You can navigate through the list of pictures to view measurement data.
The Image Description shows the camera settings with which the picture had been
recorded. If you want to evaluate the picture use the button. To change the directory and browse for other pictures recorded in a different session use the button. To close the dialog press .
27
© 2014 PreSens Precision Sensing GmbH
VisiSens AnalytiCal 2 Evaluation Module
5 Evaluation Module
Clicking the button will open the evaluation module. You can also use the submenu
Options / Evaluate or double click one of the thumbnails of a recorded image to get to the evaluation module.
28
© 2014 PreSens Precision Sensing GmbH
VisiSens AnalytiCal 2 Evaluation Module
5.1 Basic Functions
BUTTON DESCRIPTION
Load: Load a single measurement picture or a whole series of images.
Save: Save the currently loaded data into .jpg or .raw format. .raw format is only available, if a single image had been loaded.
Add Comment: Add a comment to the currently loaded images.
Print: Print the currently loaded picture.
Slide Show: If a series of images had been loaded, this function will display a slide show of all pictures.
Refresh: Refreshes the screen to the initial display. The initial image or the first image of loaded series is displayed on the evaluation screen.
Calibrate Sensor: Perform a calibration to show pH values.
Exit: Close the evaluation module.
5.1.1 Load Measurement Data
Use the button to upload images from the local data storage. Pressing the button will open a dialog in which you can choose a single measurement picture.
Fig. 34 Read VisiSens image file – load stored measurement pictures with the evaluation module
29
© 2014 PreSens Precision Sensing GmbH
VisiSens AnalytiCal 2 Evaluation Module
Check the Series box next to the button to upload time series measurement data. Then click the button and select the first image of your time series measurement in the Read VisiSens image file dialog.
This will open the Read images to stack dialog in which you can type the number of pictures you want to be uploaded to the evaluation module. Click Accept to start uploading the
images.
Fig. 36 Read images to stack dialog - type in the number of images to be uploaded
30
© 2014 PreSens Precision Sensing GmbH
VisiSens AnalytiCal 2 Evaluation Module
5.2 Display Functions
Button Description
Display single image: A single image will be shown in the evaluation screen.
Display 4 images: A maximum of 4 images will be displayed in the evaluation screen. Double click one of the images to return to single image view.
Display 16 images: A maximum of 16 images will be displayed in the evaluation screen. Double click one of the images to return to single image view.
Side by side: Type in the number of the two images you want to be displayed side by side in the evaluation screen.
Alpha blending: The original color image is displayed on the upper left, the processed image on the lower left. A blended image of the two is displayed on the right.
Zoom image: A square will be shown in the evaluation screen. Move the square to the area of interest. With a right mouse click the evaluation screen will show a zoomed in representation of the area. Edit color table: Opens a dialog which allows changing color settings and representation of the images shown in the evaluation screen.
The MIN / MAX bar below the display function buttons shows the minimum and maximum values displayed in the evaluation screen. These values are set automatically by the software. You can change those settings by manually typing in the value range you want to have displayed.
The Slide number bar below shows the number of the image currently displayed. If you have loaded a series of images you can move the button or use the arrows to choose another image to be displayed on the evaluation screen.
Fig. 37 MIN / MAX bar – minimum and maximum values displayed
31
© 2014 PreSens Precision Sensing GmbH
VisiSens AnalytiCal 2 Evaluation Module
Checking the Show colorbar box will display the colorbar with the respective values (either R(atio) values or pH values) on the evaluation screen.
The Side by side function will display two selected images next to each other and give the image details Date and Time of recording, the Path for the directory in which it is stored and the File name.
Fig. 39 Show colorbar selected; left: colorbar for R-value image, right: colorbar for pH image
32
© 2014 PreSens Precision Sensing GmbH
VisiSens AnalytiCal 2 Evaluation Module
Fig. 41 shows an example for Alpha blending.
Press the button to enlarge a part of the displayed image. A square is shown in the evaluation screen which can be dragged to the area of interest. After a right mouse click the evaluation screen will zoom in on this area.
Fig. 41 Alpha blending
33
© 2014 PreSens Precision Sensing GmbH
VisiSens AnalytiCal 2 Evaluation Module
Clicking the button will open the XLoadct dialog. In this dialog you can change the color settings to get the images displayed in the color scheme you prefer.
Fig. 43 Zoomed in on the area of interest
34
© 2014 PreSens Precision Sensing GmbH
VisiSens AnalytiCal 2 Evaluation Module
5.3 Calibration
pH distributions can be visualized in the evaluation module without performing a calibration. During the upload of images, data is processed and sensor response raw values (R-Values) are displayed. High values then represent areas with low pH, while low values show areas with high pH.
For easier and more intuitive evaluation the pH values can be calculated using a 6- or more point calibration. Performing the calibration by pressing , data contained in each image is processed with the calibration parameters and the image is displayed giving pH values.
35
© 2014 PreSens Precision Sensing GmbH
VisiSens AnalytiCal 2 Evaluation Module
5.3.1 Recording Images for the Calibration
Please refer to the SF-HP5R / SF-LV1R instruction manual for more detailed information about the sensor foil and how to handle it.
1. Recording images for different pH values:
You have prepared at least six buffer solutions of different pH value, roughly covering the pH range you expect in your measurements, and that lie within a range of pH 5 to pH 8 for SF-HP5R and pH 2 to pH 5 for SF-LV1R. (For better results calibration should be
performed in a wider range than the optimal dynamic range of the pH sensor foils stated in the respective sensor specifications.) Position the detector unit and focus on the sensor foil. Take a single measurement of the sensor at each different pH value.
!
Please make sure to record calibration images in the same measurement system (set-up) and at the same temperature as the following measurements are performed at.
!
Calibration should be performed at approx. the same ionic strength as the measurements are taken at.Make a note at which pH each of the calibration images has been taken or best place a comment with the current session (see chapter 4.3.1).
2. Perform the measurements with your sample using sensor foil of the same batch as the sensor foil in the calibration vessels.
5.3.2 Performing the Calibration in the Evaluation Module
Load the calibration images to the evaluation module first.
Open the first image and click the button (in the left tool bar of the evaluation module). The pHCalibration dialog opens.
36
© 2014 PreSens Precision Sensing GmbH
VisiSens AnalytiCal 2 Evaluation Module
In the table in the lower half of the dialog six rows for different pH Buf. calibration values are already shown. It is recommended to perform the calibration with at least 6 calibration points.
Add Buf:
Pressing this button will add an additional calibration point to the table in the lower half of the dialog.
Del. Buf:
Pressing this button will remove the currently highlighted calibration point from the table in the lower half of the dialog.
Calibrate:
Pressing the Calibrate button will start the calculation with the calibration values you added in the dialog.
Exit:
Pressing Exit will close the pH Calibration dialog.
37
© 2014 PreSens Precision Sensing GmbH
VisiSens AnalytiCal 2 Evaluation Module
1. Enter the pH values you have chosen for your calibration in the pH Buf. column. They can differ from the pre-set pH values.
!
Perform the calibration in ascending or descending order of the respective pH values (from lowest to highest calibration pH value or vice versa).2. Clicking on the Ratio field next to the first pH value will activate the button ROI for Buf. 1.
3. Press the ROI for Buf. 1 button and mark the appropriate region of interest (showing a homogeneous area and valid values) on the image for the first pH calibration point. Mark a polygon with left mouse clicks; then close the region of interest with a final right mouse click. The respective calibration value will show in the Ratio column next to the first pH value.
4. Use the Slide number bar on the right of the screen to go to the next calibration image. Then mark the next field in the Ratio column, which will activate the button ROI for Buf.2.
!
Your have to go to the next calibration image taken at a different pH by using theSlide number bar before clicking on the next Ratio field and repeating the procedure described above.
38
© 2014 PreSens Precision Sensing GmbH
VisiSens AnalytiCal 2 Evaluation Module
5. Repeat this procedure for all six – or more – calibration values.
6. When you have transferred all the desired calibration points to the table press the
Calibrate button; the image will be processed and pH values calculated for all images you have loaded.
Fig. 48 Go to the next calibration image and mark the respective field in the Ratio column (here: second calibration image, ratio for pH Buf. 2 selected and ROI for Buf. 2 button activated).
Fig. 49 Values for all calibration points have been transferred to the Ratio column
39
© 2014 PreSens Precision Sensing GmbH
VisiSens AnalytiCal 2 Evaluation Module
An information window appears saying that the calibration is completed and the respective calibration data saved with this session. Click OK. All loaded images show pH values now.
!
If you want to repeat a calibration you will have to change back and reopen the R-value images. A message window will appear, saying that calibration has already been performed for these images and whether you want to apply it. Press No and perform a new calibration.Fig. 50 Calibration button was pressed; calibration is in process
40
© 2014 PreSens Precision Sensing GmbH
VisiSens AnalytiCal 2 Evaluation Module
5.4 Evaluation Functions
Button Description
Z-axis profile: Calculates and shows the graph of the average values of all uploaded images in a user defined ROI (region of interest).
Live profiles: Shows the x and y representation of the current row in the loaded image. Move the mouse over the image to get live
representation of the respective row.
ROI statistics: Mark a ROI (region of interest) and get statistics displayed.
Follow kinetics: Shows the distance from the first to the last of the uploaded images.
Pseudocolor image: Displays the pseudocolor image of the currently shown measurement image.
Histogram: Displays a histogram representation of the currently shown measurement image.
3D plot: Shows a 3D representation of the measured values on the currently displayed image.
Multiple plots: Multiple representations of the measured values on the currently displayed image are shown in one diagram.
41
© 2014 PreSens Precision Sensing GmbH
VisiSens AnalytiCal 2 Evaluation Module
5.4.1 Z-Axis Profiles
Z-axis profiles will calculate and display a graph of average values in a certain ROI (region of interest) for all images uploaded.
Click the button. Now you are able to mark a ROI with left mouse clicks. Close the ROI polygon with a right mouse click. The software will calculate average values in the ROI for all images and display the respective graph (see Fig. 53).
A dialog opens asking if the calculated data should be saved. Clicking Yes will save the graphical representation as .jpg and the data as .dat file. Pressing No will close the window without saving the data.
Fig. 53 Z-axis profile – graphical representation
42
© 2014 PreSens Precision Sensing GmbH
VisiSens AnalytiCal 2 Evaluation Module
The .dat file gives information about average values of the area, the number of pixel used for evaluation, the number of valid pixel in the marked area, standard deviation, maximum and minimum values.
5.4.2 Live Profiles
Pressing the button opens the Profiles window that shows x and y representations of the current row in the loaded image. By moving the mouse over the image you can get live profiles for the respective row. Double clicking the image while the Profiles window is open, will switch x and y axis of the representation.
A right mouse click will close the Profiles window.
43
© 2014 PreSens Precision Sensing GmbH
VisiSens AnalytiCal 2 Evaluation Module
5.4.3 ROI Statistics
Clicking the button you can select a ROI on the image. Use left mouse clicks to create a polygon and a right mouse click to close it. The software will calculate and show statistical values for the selected ROI (average, and standard deviation are also shown in the colorbar):
1. (Avg.) average value
2. (max) maximum value
3. (min) minimum value
4. (St. Dev.) standard deviation
5. (valid pixel) the number of valid pixel inside the ROI: the Raw-Values of the pixels are within the valid range for pH calculation, if they are not within the valid range the respective pixels are set to value of x pH and not accounted for in the calculation.
6. (pixel) the total number of pixel inside the ROI
44
© 2014 PreSens Precision Sensing GmbH
VisiSens AnalytiCal 2 Evaluation Module
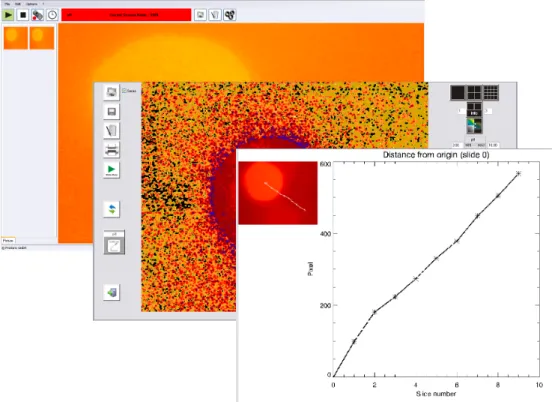
5.4.4 Follow Kinetics
Use the button to get a graphical representation of a distances from the first image to the last image. With this function you are able to investigate the spatial change of an area of interest over time (e. g. the border of an area of low pH that spreads or shifts over time). Press the button and click on the area of interest on the first image. The software will
automatically switch to the next image, click again. Proceed this way until you have clicked on all uploaded images always marking the area you are interested in. The graphical
representation will be shown after clicking the last image giving you the information of distance from origin in pixel.
5.4.5 Pseudocolor Image
Pressing the button will show the pseudocolor image of the currently displayed image.
45
© 2014 PreSens Precision Sensing GmbH
VisiSens AnalytiCal 2 Evaluation Module
5.4.6 Histogram
Use the button to view the histogram representation for the currently displayed image.
5.4.7 3D Plot
The button will enable you to get a 3D plot of the measurement values in the currently displayed image.
Fig. 58 Histogram
Fig. 59 3D Plot of pH buffer drop recording – high values in the center can be clearly distinguished from lower levels towards the edge
46
© 2014 PreSens Precision Sensing GmbH
VisiSens AnalytiCal 2 Evaluation Module
5.4.8 Multiple Plots
Get a graph with multiple representations of the measurement values in the currently displayed picture by pressing the button.
47
© 2014 PreSens Precision Sensing GmbH
VisiSens AnalytiCal 2 Concluding Remarks
6 Concluding Remarks
Dear Customer,With this manual, we hope to provide you with an introduction to work with the VisiSens AnalytiCal 2 software.
This manual does not claim to be complete. We are endeavored to improve and supplement this version.
We are looking forward to your critical review and to any suggestions you may have. You can find the latest version at www.PreSens.de.
With best regards, Your PreSens Team
© 2014 PreSens Precision Sensing GmbH Manufacturer PreSens Precision Sensing GmbH Josef-Engert-Straße 11 93053 Regensburg Germany Phone +49 941 94272100 Fax +49 941 94272111 [email protected] www.PreSens.de