Evaluation of UML Based Wireless Network
Virtualization
S. Singhal
1, G. Hadjichristofi
1 2, I. Seskar
1, and D. Raychaudhri
11WINLAB, Rutgers University, USA 2University of Cyprus, Cyprus {shruti, gh, seskar, ray}@winlab.rutgers.edu
Abstract— Wireless virtualization aims to support concurrent
experiments on shared wireless network resources. This research is based on efforts to enhance the control structure of the wireless test bed ‘ORBIT’ through different forms of virtualization. The focus of this paper is virtualization in frequency or frequency division Multiplexing (FDM), and more specifically using multiple wireless interfaces per node and splitting the wireless medium by assigning a different channel frequency to each interface. A wireless node is then virtualized through User Mode Linux (UML), with each sliver or experiment using a different interface. Extensive experimental results are presented that analyze the effectiveness of this method of virtualization in terms of different types of traffic. We examine cross-coupling effects of coexisting virtualized experiments. This research provides practical guidance for the use of this type of virtualization for simultaneous wireless experiments.
Keywords- UML, virtualization, wireless, frequency
I. INTRODUCTION
Virtualization of wireless networks is recognized to be a difficult problem due to the fact that radios interact with their neighbors at various layers of the protocol stack, making strict isolation of virtual networks (“or slices”) quite challenging [1]. The goal of virtualization is to support concurrent experiments, both long-running services as well as short-term experiments on shared wireless network. In a wireless network, the radio resources that can be shared and hence virtualized are in time, space, and frequency. Efforts have been going on to modify the ORBIT [3] control structure to accommodate different forms of virtualization including VMAC, SDMA, FDMA and TDMA [4]. Among the different possible wireless virtualization techniques, this work is focused on allowing a node to run more than one experiment simultaneously using different frequencies i.e. essentially Frequency Division Multiplexing (FDM). Each node in the ORBIT test bed has two physical wireless cards. Therefore, virtualization is achieved by running a maximum of two User Mode Linux (UML) Operating systems [2] on each node and providing each operating system exclusive access to a radio card.
Experimental results are provided to compare the performance of a virtualized radio node with the non virtualized one for experiments using TCP and UDP. Bounds on performance metrics of throughput, delay and jitter are
determined and provide insights as to how virtualization will affect wireless experiments.
Cross-coupling effects between two virtualized experiments are examined by looking at transient behavior associated with sudden changes in traffic on one of the virtual networks. Finally, the uncertainty in performance measurements for a few typical usage scenarios is investigated, leading to guidelines for the use of virtualized radio nodes for simultaneous ORBIT experiments.
The main contribution of this paper is to (1) quantify the impact of using User Mode Linux (UML) [5], as a part of wireless experiments on the ORBIT test bed, (2) identify the crucial parameters that are affected by its use and (3) provide practical guidance for using this type of virtualization.
The rest of the paper is organized as follows. Section 2 outlines related work to wireless network virtualization. Section 3 gives an overview of wireless network virtualization. Section 4 presents the concept and operation of UML and virtual networking. Section 5 describes the experimental organization and setup, and presents the performance evaluation results. Section 6 provides a proof-of-concept experiment that validates the virtualization analysis of Section 5.
II. PREVIOUS WORK
Virtualization techniques are intended to share a set of computing and communication resources (CPU’s, routers, links, networks) amongst multiple users with the appearance of dedicated, non-interfering allocation of resources. Virtual machine (VM) techniques have been explored in earlier efforts in wired networks. Among the techniques that virtualize the resources of a single node, VMware [7] and Connectix [8] virtualizes the physical hardware of a node and supports a limited number of concurrent instances of Operating Systems (OS) due to the large amount of memory consumed by each OS image. Xen [16] and Denali [17] adopt higher-level virtualization techniques by exporting a subset of the processor’s instruction set and some specialized virtual devices, which requires porting existing OSs to run on top of these VMs. Another approach is adopted by Planetlab [6], Ensim [9] and UML [2], which virtualizes at the level of system calls and provide reduced isolation of the resources of a node in favor of supporting a large number of users per node.
In this research we adopt the UML OS virtualization for the ORBIT testbed and couple it with the FDM method of virtualization. UML is a relatively lightweight virtual OS compared to other virtual OSs, such as Xen, and it also provided better support for the wireless interfaces on the ORBIT nodes. Koh et al [10] studied the packet-processing overheads in a UML through a methodical analysis of packet processing in the TCP/IP stack with the aim of applying a few optimization techniques to TCP/UDP packet processing. However, their analysis was executed over wired networks and did not study any form of wireless virtualization (e.g., FDM).
III. WIRELESS NETWORK VIRTUALIZATION
To form a virtualized network, available network resources are split into multiple logical resources. A slice is a collection of such orthogonal resources that forms a wireless network on top of the underlying resources [4]. Many such orthogonal slices can coexist and may be allotted to different experiments at the same time, thus allowing multiple simultaneous experiments.
Wireless network virtualization needs to address two key issues [4]:
1. Isolation of wireless resources of experiments coexisting at the same time to ensure minimal interference among the experiments
2. Monitoring resource utilization to ensure that an experiment does not encroach upon the resources of another experiment
Figure 1. FDM Based Virtualization
Virtualization in a wireless medium can be applied in a number of ways, such as Space Division Multiplexing (SDM), Frequency Division Multiplexing (FDM), Time Division Multiple Access (TDMA), Code Division Multiple Access (CDMA) and various combinations of the aforementioned schemes [6]. This paper investigates the FDM approach to wireless network virtualization. A schematic of two simultaneous wireless experiments using the FDM approach is shown in Figure 1. These two experiments, i.e., two slices, utilize the same wireless infrastructure to execute different experiments forming different topologies. This type of
virtualization assumes the existence of more than one radio per node.
IV. OVERVIEW OF UML
The UML operating system runs as a regular user level process or guest process on an OS [5]. The OS that accommodates UML is referred to as the host OS. The UML architecture [1] is shown in Figure 2. The UML memory, network devices, and their configurations can be easily specified through command line options. Resources such as CPU and memory are allocated according sharing and scheduling policy of the host OS.
The support for I/O devices, such as network devices, is provided through corresponding virtual devices. In this work, we set up networking within UML by creating a virtual interface in the guest OS and linking it to a TUN/TAP interface in the host OS.
Figure 2. UML System Architecture
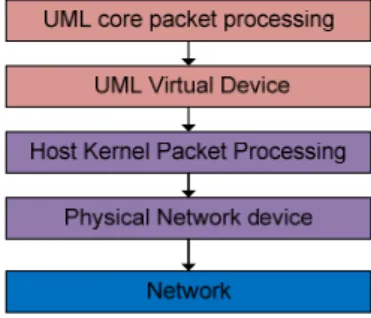
The path of a packet from UML to the network can be divided into five layers (see Figure 3).
Figure 3. UML Packet Processing Layers
UML executes the same steps in packet processing as in a typical OS, including routing decisions, header filling, network queue processing, and packet forwarding. It then sends packets to the virtual network device, which passes them to the host kernel. Processing control is then transferred from the UML to the host kernel. The host kernel forwards the packets to an appropriate physical network device, which in our experiments is a wireless device. Finally, the device transmits the packets to the network.
UML being a user level process supports the existence of multiple virtual machines on a single piece of hardware, offering excellent security and safety without affecting the configuration of the host’s environment or its stability.It is simple to install and having a UML up and running involves downloading a UML kernel and a file system, and running a shell command. UML also allows all of the Linux tools and techniques to be applied to any problem in UML itself.
However, using UML as a part of UDP/TCP experiments is the additional processing overheads it incurs. All of the OS functions are implemented through system calls to the host kernel. In terms of support for multiple experiments, it should be noted that a drawback of the current UML implementation in the case of wireless networks is that it only offers a virtual Ethernet interface and not a virtual WLAN wireless interface. Thus, the wireless parameters can only be configured through user access to the host OS. This limitation provides limited flexibility and does not allow multiple experimenters to share a machine and configure the wireless interfaces from within UML. In this case, virtualization modifications would need to be made to provide that functionality while retaining the isolation between experiments.
V. EXPERIMENT SET UP AND RESULTS
We use the ORBIT test bed to evaluate our UML based wireless network virtualization. The frontline of the ORBIT test bed is 400 nodes designed as custom made personal computer platforms, each equipped with two wireless 802.11a/b/g interfaces. In addition, each node has four Ethernet interfaces and a serial port with the purpose of remote access, supervision, and control. The nodes are placed in the two-dimensional rectangular grid separated by 1-meter distance. Details of the test bed hardware purpose, structure, and functionality are presented in [1].
We bring up two instances of UML on each ORBIT node. Since each node is equipped with two physical wireless cards, we configure each UML to have exclusive access to one card. Thus, ORBIT nodes can support a maximum of two concurrent experiments. A schematic of a virtualized node is presented in Figure 4.
Figure 4. Schematic of Virtualized ORBIT Node
In order to characterize and test the performance of a virtualized network, we run a set of experiments on the native non-virtualized network, i.e., using the host OS. We then repeat the same experiments on the virtualized network. We analyze the performance deviations introduced by the use of virtual machines for the case of UDP, TCP, and RTP transport protocols. We also carry a transient analysis of a virtual environment and look at the impact of coupling dynamically wireless experiments.
The metrics we compare are throughput, delay, and jitter. These metrics represent the most popular metrics and are typically used in the characterization of wireless networks. Based on the results, guidelines are presented in terms how virtualization will impact a wireless experiment. The results presented are specific to ORBIT nodes. Since the operation of UML is mostly CPU dependant, we expect variations in results
with the use of different hardware configurations. However, the specific trends of the recorded measurements would be similar. The verification of these similarities is left as future work.
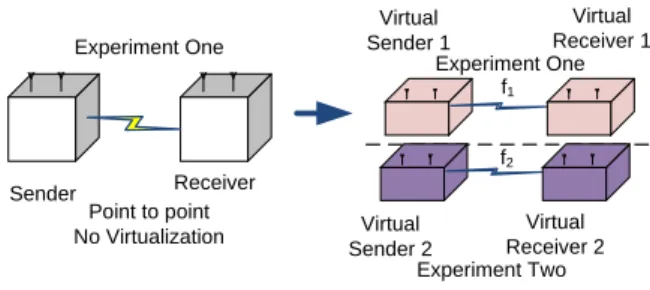
The basic experiment set up is shown in Figure 5. The experiments in this work have been designed using TCP, UDP, and RTP transport protocols. We run a single UDP/TCP/RTP traffic flow on two native ORBIT nodes and then repeat the same experiment on a virtualized wireless network with 2 traffic flows, i.e. in effect running two experiments at the same time. Note that both scenarios use two ORBIT nodes and each traffic flow uses a dedicated pair of radio transceivers. The virtualized scenario uses two different orthogonal frequencies. These experiments are designed with varying traffic loads, channel rate and payload sizes.
Point to point No Virtualization Experiment One Sender Receiver Virtual Sender 1 Virtual Sender 2 Virtual Receiver 1 Virtual Receiver 2 Experiment One Experiment Two f1 f2
Figure 5. Experiment Set Up for Virtual Network Performance Analysis
A. Performance Analysis with UDP
The values of the experimental parameters for the case of UDP are shown in Table I. The experiments have been designed by varying one of the parameters while keeping others constant.
TABLE I. UDP EXERIMENT PARAMETERS
Parameter Value
Channel Rate 36 Mbps (802.11a)
Frequency 5.18 (Exp. 1), 5.32 (Exp. 2)
Packet Size 1470 Bytes
Input Traffic 50 Mbps
Protocol UDP
1) Throughput vs. Offered Load (UDP): We measure throughput for varying input traffic on the wireless link. The throughput comparison for virtualized and non virtualized network is shown in Fig. 6. The throughput reported is the average of the two experiments running on the virtualized network. For offered loads of up to 50Mbps, i.e., when the network is saturated, the drop in throughput for virtualized network is less than 0.25 Mbps. Notice that the link saturates when the offered load is approximately 30 Mbps. The variance of the throughput when the system saturates increases by approximately 10 times for the virtualized scenario as shown in Figure 7. This increase is due to the overhead of buffering the packets by one UML while another UML is using the CPU.
Channel Rate 36 Mbps, Packet Size 1470 Bytes 0 5 10 15 20 25 30 35 5 10 15 20 30 40 50 Offerd Load (Mbps) T h roupghput ( M bps ) No Virtualization With Virtualization z
Figure 6. Throughput vs. Offered Load (UDP)
Channel Rate 36 Mbps, Packet Size 1470 Bytes
0 1 2 3 4 5 6 7 8 9 10 10 20 30 40 50
Off ered Load (Mbps)
T ime V a ri a n c e in T h ro ug hp ut (M b p s ) No Virtualization Virtualization
Figure 7. Throughput Variance vs. Offered Load (UDP)
Thus, from the perspective of an experimenter, virtualization has trifling effects on long duration average UDP throughput experiments. On the contrary, experiments that measure instantaneous throughput could give erroneous results on the virtualized platform as there is a considerable increase in variance of throughput close to saturation (i.e., at 30 Mbps).
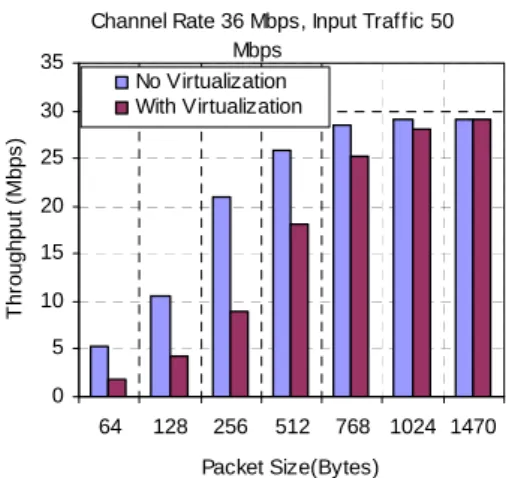
2) Throughput vs. Payload Size (UDP): To analyze the impact of payload size on the behavior of virtual network, we run a constant UDP traffic load of 50 Mbps in experiment #1 and #2 in Figure 5 but with varying packet sizes. Throughput as a function of packet size, (64,128, 256, 512, 768, 1024, and 1470 bytes) for virtual and non-virtual wireless network, is shown in Figure 8. As expected, shorter packet lengths provide lower throughput because as the packet size decreases the lower layer processing overhead increases and the percentage of the IP headers size over the payload increases. In the case of UML, the throughput decreases more rapidly with decreasing packet sizes because of the additional processing required at the UML level.
Channel Rate 36 Mbps, Input Traffic 50 Mbps 0 5 10 15 20 25 30 35 64 128 256 512 768 1024 1470 Packet Size(Bytes) T h ro ugh put ( M bps ) No Virtualization With Virtualization
Figure 8. Throughput vs. Payload Size (UDP)
To investigate the impact of payload size further, we plot the number of packets per second that a UML is able to transmit for a particular packet size in Figure 9. Irrespective of the packet size, the actual number of packets per second that are sent out through each UML, while both virtualized experiments are running simultaneously, is less than ~ 30,000 for small packets. The same number for experiments without virtualization was measured to be ~ 80,000. Thus, we observe that a virtual experiment based on 2 slivers is able to support less than half the number of packets compared to a non-virtualized experiment. Note that larger packet sizes saturate the link and thus the total number of packets decreases.
Channel Rate 36 Mbps, Offered Load 50 Mbps
0 5000 10000 15000 20000 25000 30000 35000 40000 45000 64 128 256 512 768 1024 1470 Packet Size (Bytes)
N u m ber of P a c k e ts /S e c 0 5 10 15 20 25 30 35 T h ro u ghp ut ( M b p s ) Packets/sec (Virtualization) Throughput (Virtualization)
Figure 9. Packets per Second vs. Packet Size
Virtualization poses a strong limitation on experiments that require smaller packet sizes and higher bit rates. As a guideline to a user we can say that only long term average UDP experiments with a frequency of less than ~30000 packets per second can be supported by a virtualized platform. If the packets are small the results would need to be adjusted to reflect the non-virtualized condition. However, in the case of large packet sizes, the results would have negligible deviations from the non virtualized platform.
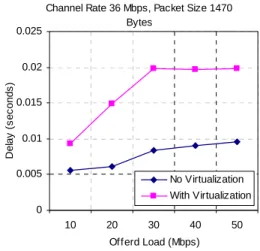
3) Delay and Jitter vs. Offered Load (UDP): UDP Packet transmission delay and jitter for the virtualized and non-virtualed network are plotted in Figures 10 and 11 respectively. Delay for both cases increases with the offered loads and it becomes almost constant once saturation is attained, as at saturation the maximum processing capacity of the system is reached. Delay for the virtualization scenario exceeds the non-virtualized one by a factor of approximately 2 at saturation. The increase is due to processing overheads in the UML and in the TUN/TAP virtual devices. Extra copies of the packets are made when the UML writes the packet to the virtual device and vice versa.
Channel Rate 36 Mbps, Packet Size 1470 Bytes 0 0.005 0.01 0.015 0.02 0.025 10 20 30 40 50 Offerd Load (Mbps) D e la y ( s ec o nds ) No Virtualization With Virtualization
Figure 10. Packet Transmission Delay vs. Offered Load (UDP)
Jitter for the two cases increases as the offered loads increase on the experiments, but the difference between the two remains almost constant at approximately 0.18 milliseconds. When two UML instances or two experiments are running on the same machine, the packets are buffered for a random amount of time (while the UML is context switched) before they are sent out over the wireless network; thus, resulting in increase of packet reception jitters. Based on these deviations we conclude that a virtualized platform should be carefully used for delay and jitter constrained/measuring experiments. The delay and jitter results as obtained from an experiment performed on the virtualized network might be higher due to the UML layer and thus would not accurately reflect wireless channel conditions. A user performing such experiments should be aware of the overhead delay and additional jitters and should accordingly adjust the results based on the constant difference so as to reflect their correct measures.
B. Performance Analysis with the Transmission Control Protocol (TCP)
1) TCP Bandwidth vs. Channel Rate: The TCP bandwidth for virtualized wireless network is compared to native wireless network for various channel rates and shown in Figure 12. We observe a slight drop in the throughput for virtual network, but the drop remains less that 0.3 % for all channel rates.
Packet Size 1470 Bytes
0 5 10 15 20 25 30 35 6 9 12 18 24 36 48 54 Channel Rate (Mbps) T C P B andw id th ( M bps ) No Virtualization With Virtualization
Figure 11. Jitter vs. Offered Load (UDP)
Channel Rate 36 Mbps, Packet Size 1470 Bytes 0 0.1 0.2 0.3 0.4 0.5 0.6 10 20 30 40 50 Offerd Load (Mbps) Ji tt e r ( m se c) No Virtualization With Virtualization
Figure 12. TCP Bandwidth Analysis
2) TCP Delay Analysis: To analyze the delays introduced by the UML for TCP we perform a large file transfer (1 GB) experiment using TCP as the transmission protocol. This delay is different from the delay of UDP as it is delay for the delivery of an entire file and not the packet delay. We believe that this scenario reflects more accurately the typical usage of TCP and might provide more useful measurement data as compared to investigating packet delay. The experiment set up is the same as shown in Figure 5. We repeat the experiment for different channel rates and compare the time taken to complete the file transfer for virtualized and non-virtualized network, which is shown in Figure 13. We observe that there is an increase of approximately 5 seconds in the time taken for file transfer in case of virtualization for all the channel rates which can be taken as very lowcompared to total time of transfer. For example, for the worst case scenario with a channel rate of 54 Mbps the delay is approximately 2%). This slight increase is due to the delay overheards introduced by the additional UML layers.
From the point of view of an experimenter, introducing UML in TCP experiments would have insignificant effect on experiment results.
File Size - 1GB, Protocol TCP 0 200 400 600 800 1000 1200 1400 1600 1800 2000 6 12 24 36 54 Channel Rate (Mbps) T im e ( S ec onds ) With Virtualization No Virtualization
Figure 13. File Transfer Delay vs Channel Rate
C. Performance analysis with Real Time Protocol (RTP)
The objective of this experiment is to analyze the performance of virtualized networks for time-constrained protocols (e.g., RTP in this case). We stream videos coded with different bit rates and compare the video bit rates and jitter on the virtualized network to that of a non-virtualized network as observed by the client of an experiment. The experiment set up is the same as in Figure 5. The experimental parameters are provided in Table II. Video server and clients are set up with a Video LAN Client (VLC) and we use the RTP protocol to stream the videos.
TABLE II. TRANSIENT EXERIMENT PARAMETERS
Parameter Value
Channel Rate 6 Mbps
Frequency 5.18 (Exp. 1), 5.32 (Exp. 2)
Video Bit Rate Variable (0.3 to 5 Mbps)
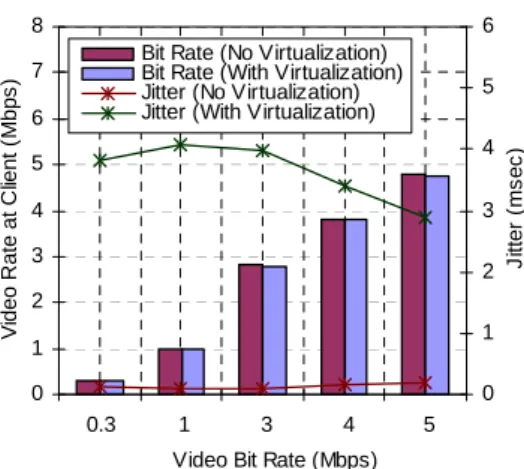
Protocol RTP In Figure 14 the bar plot compares the bit rates while the line graph plots the jitter. The video bit rates obtained are similar for both the cases whereas there is an increase in jitter by a factor of approximately 10 times higher for the virtualized network compared to the non-virtualized. Relating these results to UDP, jitter with UDP had increased by a factor of ~4, which is lower than when using RTP. RTP is different from the transport protocols, like UDP and TCP. It is essentially application level framing that uses the underlying transport protocol (mainly UDP) to transmit its frames. This additional layer processing in UML results in the considerable increase in jitter. With the sizeable jitter increases, running real time applications successfully on a virtualized platform using UML depends on the sensitivity and constraints of the specific experiment in terms of jitter and delay. It is to be kept in mind that these results are true only for single hop experiments. With multi hop real time experiments, the jitter will be higher and it might increase beyond acceptable limits.
0 1 2 3 4 5 6 7 8 0.3 1 3 4 5
Video Bit Rate (Mbps)
V ideo R a te at C lie n t ( M bp s ) 0 1 2 3 4 5 6 J itt e r ( m se c)
Bit Rate (No Virtualization) Bit Rate (With Virtualization) Jitter (No Virtualization) Jitter (With Virtualization)
Figure 14. Jitter and Bit Rate vs. Video bit Rates
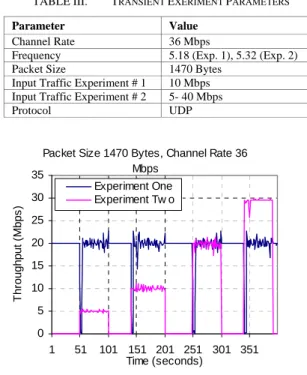
D. Transient and Cross-coupling Analysis
In this section we analyze the cross coupling effects between two virtual machines (UML’s). The purpose of this study is to investigate how a sudden change in traffic on one UML experiment affects the performance of existing UML processes that are running concurrently on the same node and are part of another experiment. This experiment aims to emulate a real time experimental scenario during virtualization of network resources, whereby two users would randomly start their experiments at different time instances unaware of the activity on the other experiment. The set up for these experiments is as shown in Figure 15.
Figure 15. Experiment Set Up for Cross-coupling Analysis
We start a UDP traffic flow between virtual sender and receiver #1 (Experiment One / Slice one) shown in Figure 15 and after some time delay we start another UDP traffic flow between virtual sender and receiver #2 (Experiment Two / Slice 2). We analyze the effect of experiment #2 on the throughput of already running experiment #1 for various experimental parameters.
The experimental parameters to calculate the coupling coefficient are shown in Table III. Fig. 16 shows the coupling effect between the two virtual machines with time. Experiment #1 runs constantly at an offered load of 20 Mbps. The traffic from experiment #2 however goes off and on periodically with varying loads. It can be seen that as soon as experiment #2 starts, the throughput on experiment #1 drops to zero for an instant and then again settles down around its original value. Thus, if a user is already running an experiment on a set of
nodes and another experiment kicks in randomly using the same physical node, it would unfavorably affect the instantaneous results for that user. Experiments focusing on long term average results might not be affected as much though.
TABLE III. TRANSIENT EXERIMENT PARAMETERS
Parameter Value
Channel Rate 36 Mbps
Frequency 5.18 (Exp. 1), 5.32 (Exp. 2)
Packet Size 1470 Bytes
Input Traffic Experiment # 1 10 Mbps
Input Traffic Experiment # 2 5- 40 Mbps
Protocol UDP
Packet Size 1470 Bytes, Channel Rate 36 Mbps 0 5 10 15 20 25 30 35 1 51 101 151 201 251 301 351 Time (seconds) T h roug hp ut ( M bp s ) Experiment One Experiment Tw o
Figure 16. Cross-Coupling Analysis
In order to better characterize the coupling effect, we define a constant called coupling coefficient that is given in (1) as
(1)
Where C = coupling coefficient
R = Average throughput obtained at Virtual Receiver 1 when it is the only experiment running
R' = Average throughput obtained at Virtual Receiver 1 after experiment two has also started running.
Fig. 17 plots the coupling coefficient, C as a function of offered load on experiment #1. The coefficient increases with the offered load on the experiment #1 and does not depend upon the traffic load on the experiment #2 as both loads on experiment 2 give approximately the same values for the coupling coefficient. Therefore, the higher the traffic experiment #1 is carrying; the more it gets affected regardless of the burst load on experiment #2. It can be inferred that this transient behavior is more CPU driven as it is less dependent on the load on experiment #2. Hence, using the virtualized platform, a user should be aware that errors might be introduced unknowingly by a concurrent experiment. These errors might be fatal for instantaneous throughput
measurements and on the other hand could be harmless for long term averaging experiments.
Packet Size 1470 Bytes, Channel Rate 36 Mbps 0 0.001 0.002 0.003 0.004 0.005 0.006 0.007 0.008 0.009 5 10 15 20 25 30 40
Offered Load on Experiment One
C o up lin g C o ef fic ien t Experiment 2 Load - 10 Mbps Experiment 2 - Load 25 Mbps
Figure 17. Coupling Coefficient plot .
VI. DISCUSSION
Based on the experimental results we observe that virtualization poses a strong limitation on UDP experiments that require small packet sizes and higher bit rates. The throughput with average UDP experiments that use small packets would need to be adjusted to reflect a non-virtualized environment. Furthermore, the number of packets per second that can be supported in a virtualized environment is a factor of the total number supported by a non-virtualized node and that is dependent on the number of virtual machines per node. In this research, ~30000 packets per second were supported with two virtual machines as compared to ~80000 packets for a non-virtualized machine. However, for larger packets (e.g., 1470 bytes) throughput results are insignificantly impacted. In terms of the UDP and RTP jitter and delay, we conclude that a virtualized platform should be used carefully for delay and jitter constrained experiments. A user performing such experiments should be aware of the overhead and accordingly adjust the results. For RTP, there can be sizeable jitter increases and therefore running real time applications successfully on a virtualized platform using UML depends on the sensitivity and constraints of the specific experiment. For TCP experiments, virtualization has insignificant effects on the experiment results. Finally, our coupling analysis has shown that instantaneous errors can be introduced in coexisting experiments and this can be fatal for experiments focusing on instantaneous throughput measurements.
VII. CONCLUSION
In this work we have provided experimental results to compare the performance of a virtualized radio node with the non virtualized one for basic point-to-point experiments using TCP and UDP. We have tried to determine bounds on performance metrics of throughput, delay, and jitter and have examined cross-coupling effects between two virtualized experiments. We also looked at transient behavior associated with sudden changes in traffic on one of the virtual networks,
leading to guidelines for the use of virtualized radio nodes for simultaneous ORBIT experiments.
Current UML implementation offers a virtual Ethernet interface and not a virtual WLAN wireless interface. Thus, the wireless parameters can only be configured on the host machine. Therefore, there is need for a virtual WLAN interface. The results presented in this work are specific to ORBIT nodes.
As future work we plan to investigate the impact of using more UMLs and different hardware. Also, virtualization has been experimented using only UML. Virtualization platforms, such as VMWare, XEN etc., can be used in place of UML and their effect on the wireless networks can be investigated.
REFERENCES
[1] D. Raychaudhuri, I. Seskar, M. Ott, S. Ganu, K. Ramachandran, H.
Kremo, R. Siracusa, H. Liu, and M. Singh, Overview of the ORBIT radio grid testbed for evaluation of next-generation wireless network protocols," IEEE Wireless Communications and Networking Conference, March 2005. [Online]. Available: http://www.orbit-lab.org/download/publications/Orbit Overview.pdf
[2] Us nsf - national science foundation." [Online]. Available:
http://www.nsf.gov/
[3] Group-GENI, \Technical document on wireless virtualization,"
September 2006. [Online]. Available: www.geni.net/GDD/GDD-06-17.pdf
[4] J. Dike, A user-mode port of the linux kernel," 5th Annual Linux
Showcase and Conference, Oakland, California, 2001.
[5] User mode linux kernel." [Online]. Available:
http://user-mode-linux.sourceforge.net/
[6] A. Bevier, M. Bowman, B. Chun, D. Culler, S. Karlin, L. Peterson, T.
Roscoe, T. Spalink, and M. Wawroniak, Operating system support for planetary-scale network services," In proceedings of the NSDI., San Francisco, California, 2004. [Online]. Available: http://www.cs.princeton.edu/ acb/nsdi04/paper.pdf
[7] S. Devine, E. Bugnion and M. Rosenblum, “Virtualization system
including a virtual machine monitor for a computer with a segmented architecture”, US Patent, 6397242, Oct. 1998.
[8] Connectix, Product Overview: Connectix Virtual Server, 2003.
http://www.connectix.com/products/vs.html.20)
[9] Ensim Corp. Ensim Virtual Private Server.
http://www.ensim.com/products/materials/datasheet_vps_051003.pdf, 2000.
[10] Y. Koh, C. Pu, S. Bhatia, and C. Consel, Efficient packet processing in
user-level operating systems: A study of uml," Proceedings of the 31st
IEEE Conference on Local Computer Networks LCN , 2006.
[11] Vmware: Virtual infrastructure software." [Online]. Available:
www.vmware.com
[12] A. Whitaker, M. Shaw, , and S. Gribble, \Scale and performance in the
denali isolation kernel," In Proc. of the OSDI., Boston, MA, December
2002 2003.
[13] S. Banerji, Time based virtualization of an 802.11-based wireless
facility." Available: www.geni.net/docs/banerji.pdf
[14] Videolan vlc media player." [Online]. Available:
http://www.videolan.org/
[15] P. Barham, B. Dragovic, K. Fraser, S. Hand, T. Harris, A. Ho, I. Pratt,
A.War¯eld, and R. Neugebauer, \Xen and the art of virtualization," In
Proc. of the ACM SOSP., October 2003.
[16] P. Barham, B. Dragovic, K. Fraser, S. Hand, T. Harris, A. Ho, R.
Neugebauer, I. Pratt, and A. Warfield, "Xen and the Art of Virtualization," SOSP, 2003.
[17] A. Whitaker, M. Shaw and S. D. Gribble, “Scale and Performance in the
Denali Isolation Kernel”, Proceedings of the 5th Symposium on Operating Systems Design and Implementation, pages 195–209, Boston, MA, December 2002.