DOES IT MATTER WHAT TYPE OF PENSION SCHEME
YOU HAVE?
David Blake
If you are concerned about your pension, then the type of pension scheme you have matters considerably. Because of demographic imbalances, unfunded state pension schemes are unlikely to be sustainable, unless the real growth rate in pensions is severely constrained or the effective working life is increased substantially. In contrast, high real returns available in the world's capital markets make it more likely that funded pension schemes will be able to deliver the pension promise. But there is an important choice to make between the two key types of funded pension scheme: de®ned bene®t and de®ned contribution. There are both costs and bene®ts to each type of scheme. De®ned bene®t schemes can provide a reasonable replace-ment ratio for those who stay with one scheme for their whole career, but frequent job changers can experience large portability losses from these schemes. Most schemes being established today in the UK and elsewhere are de®ned contribution. Although these schemes are portable between jobs, they are often associated with high charges, a wide dispersion in investment performance and annuities that are poor value for money. When choosing your pension scheme, you have a dif®cult set of choices to make.
The combined values of the claims1 against the four main types of British pension scheme are enormous: in 1994 they were valued at (with the ratio to GDP given in parentheses): basic state pensions £703bn (105%), SERPS2 £202bn (30%), occupational pensions £743bn (111%) and personal pensions £140bn (21%). Collectively, the value of pension rights accounted for 49% of total personal sector wealth in 19943. In this article we ask: Who is in the best position to operate your pension scheme? The state or the private sector? Is it better for the scheme to be funded or unfunded? What are the costs of switching between the two types of scheme? If the scheme is funded, how should the accumulating ®nancial assets be managed? Is it better for the scheme to be de®ned bene®t (as in the state schemes and most occupational schemes) or de®ned contribution (as with personal pension schemes and an increasing number of company schemes)? What are the different risks asso-ciated with the different types of scheme and how are those risks shared?
Retirement income is an extremely important component of every indivi-dual's life cycle. It can come from one of the four key pillars of support in old age: unfunded state pensions (that is, transfers from the current working population via the tax system), funded private pensions (that is, from savings accumulated in private sector pension schemes), direct private savings, and Publishers, 108 Cowley Road, Oxford OX4 1JF, UK and 350 Main Street, Malden, MA 02148, USA.
I am very grateful for very helpful discussions with Richard Disney, Michael Orszag, Allan
Timmermann and, particularly, the Editor, Stephen Machin, and an anonymous referee.
1 By claims we mean either the expected discounted value of accrued rights in de®ned bene®t
schemes (whether funded or unfunded) or the value of accumulated ®nancial assets in funded de®ned contribution schemes.
2 The State Earnings Related Pension Scheme.
post-retirement work. For most people in developed countries, the key sources of retirement income are state and private pension schemes. Individuals will therefore be concerned with the ability of these schemes to deliver the pension promise that they make. This will depend on a range of factors, the most important of which are the ratio between the number of people in retirement and the number of people in work (the so-called dependency ratio), the productivity of those in work, and the rate of return generated on assets accumulated in pension funds. The relationship between these factors will determine which type of pension scheme, funded or unfunded, is likely to be more effective in delivering pensions; indeed they will affect the very viability of each type of scheme. Other factors are also important. The capital markets will be important for determining the ef®ciency of the two main types of funded scheme: the de®ned bene®t and the de®ned contribution scheme. Similarly, changing labour market conditions (which affect the frequency of job changes, for example) will in¯uence the suitability of each type of scheme.
1. How Does Funding Matter?
There are two main types of organised pension arrangement: pay-as-you-go (PAYG) and funded. A pension scheme can be thought of as a long term savings programme to transfer resources from the young to the old (in the case of an unfunded or PAYG scheme) or from youth to old age (in the case of a funded scheme).
1.1. Unfunded Schemes
Most state pension schemes are ®nanced on a PAYG basis. The pensions of the retired generation are paid from the contributions of the current working population. To be viable over the long run, they require suf®cient people in work, making suf®cient contributions to pay for those who have retired. Technically, we need the sum of the growth rates in the working population and labour productivity (i.e., output per worker) to exceed the sum of the growth rates in the retired population and real pensions (for contribution rates not to rise)4. This is equivalent to saying that the real growth rate in the national wage bill must exceed the real growth rate in the national pension bill. But in the United Kingdom, as in the rest of Europe, the population growth rate is slowing down (and in some countries is actually negative) and, due to advances in medical science, people are living longer. Thus the population is ageing dramatically, resulting in the so-called demographic timebomb, the inter-generational risk that there will insuf®cient younger workers to pay the pensions of the large numbers of pensioners.
In 1990, there was one pensioner in the United Kingdom for every four workers. By 2030, there is projected to be nearly two pensioners for every ®ve
workers.5It is worse elsewhere in Europe. The worst case is Germany where the ratio is projected to rise from one-in-®ve to one-in-two between 1990 and 2030. While, in all developed countries, there is a net transfer of resources from the young to the old, the required increase in resources ¯owing between these generations is likely to be too large to be politically or socially sustainable. For example, in the case of Germany, contribution rates to the state pension scheme would have to rise from 23% of workers' incomes in 1995 to 42% by 2050, while the corresponding increase in the case of Italy would be from 43% to 68%.6 The United Kingdom is the only major country that has so far made any signi®cant attempt to reduce its state pension costs: in her case by linking increases in state pensions to the retail price in¯ation rate rather than to the (on average) higher wage in¯ation rate, by reducing the bene®t accrual rate for SERPS (both these factors induce the replacement ratio to fall over time) and also by raising the state retirement age of women.7
While the share of state pension costs as a proportion of GDP has been contained in the case of the United Kingdom over the next half century and is expected to fall in the case of Ireland, it is projected to grow substantially in other parts of Europe, rising by 61% in Italy, by 66% in Germany and more than doubling in the case of the Netherlands and Portugal. Estimates have been made of the size of unfunded state pension liabilities in Europe (calcu-lated as the difference between the present values of promised future pension payments and expected future contributions).8 Ireland has the lowest net liability (at 19% of GDP), closely followed by the United Kingdom (at 24%), while Sweden and Belgium have the highest net liabilities (at 132% and 153% respectively). If these liabilities had been recognised as part of the national debt of each country and added to the of®cial measure of national debt, then nomember state of the EU would have satis®ed one of the Maastricht criteria for participating in the euro currency (namely that national debt must not exceed 60% of GDP)!
Labour productivity is not making up the shortfall caused by the declining population growth rate. There are a number of reasons for this. High labour productivity requires high capital per worker, but net investment (additions to the capital stock after taking depreciation into account) in the United King-dom and in many other parts of Europe has been inadequate: it has typically been considerably less than gross investment, and, indeed, net investment by public sector corporations has frequently been negative.9 The long-term consequences of inadequate investment is illustrated by the decline of the coal, steel and shipbuilding industries across Europe. On top of this, and despite the headline stories of inward direct investment from abroad, capital is ¯owing
5 World Bank (1994a); see also OECD (1996), Disney (1996) and Blake (1997a).
6 Chand and Jaeger (1996).
7 See also World Bank (1994b).
8 Roseveareet al.(1996).
9 For example, between 1980 and 1996, gross investment in the UK averaged 17.1% of GDP, while net
investment averaged just 5.7%. During the 1980s, net investment by United Kingdom public
out of Europe to the low-wage parts of the globe, such as the Far East and Latin America: during the 1980s outward direct investment from Europe was occurring at more than twice the rate of inward direct investment into Europe (as a proportion of GDP).10
Also European unit labour costs are the highest in the world: they average US$20 per hour (of which US$8 per hour covers the provision of social bene®ts). In China, unit labour costs are US$1 per hour, while in Africa, they are US$1 per day.11 Workers in European and many other advanced economies appear to be pricing themselves out of the formal labour market. The OECD (1998) estimated that the number of people out of work in OECD countries in 1997 was about 35m, up from 25m in 1990. There was also estimated to be another 11m `discouraged workers' who no longer register. The worst situation is in Europe where 23m people or 12% of the workforce are of®cially out of work, compared with 6.7m in the United States and 2.3m in Japan. Further-more, there has been a steady increase in unemployment in Europe over the last 40 years: 2% in the 1960s, 4% in the 1970s, 10% in the 1980s and 12% in the 1990s. The OECD's explanation for this is that the service sector has failed to take up the workers released by the decline in manufacturing industry; indeed, within the European Economic Area, the net growth in employment has been entirely con®ned to the public sector, with no net additional private sector jobs created since 1973. Even worse is the duration of unemployment: 45% of those who are unemployed in Europe have been out of work for more than a year, compared with 20% in Japan and only 10% in the United States.
There is, therefore, a potentially catastrophic combination in Europe, with the dependency ratio increasing inexorably but unemployment at unprece-dented levels and rising. At the same time, Europe's relative competitiveness is declining. This is re¯ected in Europe's share of world markets: her share of high technology export markets, which accounts for most of the growth in world trade, is now less than half that of the US or Japan.12
Table 1 shows that unfunded pension schemes are notviable in the long run
10 Eltis (1994). Total gross investment in the Far Eastern economies of Japan, Korea, Taiwan,
Singapore, Hong Kong, Indonesia, Malaysia, and Thailand averaged 35% of GDP in 1990 compared with only 20% in the OECD economies; the growth rate in real GDP per capita averaged 5.5% in the Far Eastern economies between 1965 and 1990, and only 2.5% in the OECD economies (see World Bank (1993)). Asia receives 60% of world capital ¯ows, Latin America 20%, Africa and the Middle East
4%, and Europe and North America between them just 16% (see Financial Times, 6 March 1997).
Recent research has concluded that the `Golden Age' of European economic growth between the early 1950s and mid-1970s, when per capita real incomes grew by an average of 3.8% p.a., will never be repeated. This growth was stimulated by a range of factors, such as post-war reconstruction, technology transfers from the United States (causing `catch up' growth), structural change (as a result of a new accommodation between workers and employers), and an investment boom. The subsequent slowdown began with the oil crises of the 1970s, and continued with the rise of newly industrialising countries in the Far East and Latin America, the effect of technological change on unskilled labour, and the impact of information technology and international communications on the location of service industries, all factors leading to a permanent shift in comparative advantage away from Europe (see Crafts and Toniolo (1996) and van Ark and Crafts (1996)).
11 DRI McGraw Hill/Morgan Stanley Research and ILO (1998). It should be noted that these striking
differences in nominal unit labour costs do not allow for differences in either local price levels or local productivity levels.
Table
1
Test
ing
the
Viability
of
the
Pensio
n
Systems
in
Differe
nt
Cou
ntries
in
the
Next
Centu
ry
Unf unded pension scheme viabl e: k Funded pension scheme viabl e: Fun ded Grow th ra te Grow th rate in Real rate of schem e Coun try in wo rking po pulation (%) labo ur produc tivity { (% ) return on pensi on fund assets { (%) Grow th rate in ret ired popu lation } (%) if real pensio ns grow in line with produc tivi ty? if real pensi on growth is zero ? if real pensi ons grow in line with producti vity? if real pensi on growth is zero? super ior to unfu nded scheme? {{ UK 0.0 2.1 6.3 0.7 No Yes Yes Yes Yes Ge rmany ÿ 0.7 2.5 5.5 0.8 No Yes Yes Yes Yes Ne therla nds ÿ 0.3 2.1 4.3 1.2 No Yes Yes Yes Yes Swede n 0.1 1.8 2.8 0.6 No Yes Yes Yes Yes De nmark ÿ 0.3 1.9 5.8 0.5 No Yes Yes Yes Yes Swi tzerland ÿ 0.2 1.5 2.2 1.1 No Yes Yes Yes Yes US A 0.4 1.6 3.9 1.4 No Yes Yes Yes Yes Can ada 0.4 2.6 4.1 1.7 No Yes Yes Yes Yes Japa n ÿ 0.6 4.1 2.9 1.4 No Yes No Yes Yes Au stralia 0.5 1.8 4.2 1.9 No Yes Yes Yes Yes Notes : Projec ted ann ual ave rage growth ra te in wor king popula tion aged 15 to 64 betw een 1990 and 2050 (sour ce: World Populatio n Prospect s: The 1994 Rev ision, United Na tions, 1995). { An nual average grow th rate in real GDP per capi ta between 1967 an d 1990, assum ed to ho ld over the period 1990 ±2050 (source : Penn-Wor ld Tables, http: //www .nber .org/pwt 56.html ). { An nual ave rage real ret urn between 1967 and 1990, assumed to hold over the period 1990 ±2050 (source :Davis (199 5, Tabl e 6.1 5)) } Projected annu al average growth rate in po pulation over the age of 65 between 1990 and 2050 (sour ce: World Pop ulation Prospe cts: The 1994 Revision ,United Na tions, 1995). k Unf unded pen sion schem es are viabl e if the sum of the grow th rates in the working popu lation and in labo ur producti vity exceeds the sum of the growth rates in the retired populatio n and in rea lpensi ons. Fu nded pen sion schem es are viabl e if the rea lreturn on pension assets exceeds the grow th ra te in real pensi ons. {{ Fun ded schemes are super ior to unfu nded schem es if the real return on pensi on asse ts exceed s the sum of the grow th rates in the wor king populatio n and in labo ur produc tivity .in any major country if real pensions grow in line with the growth rate in labour productivity. They would be viable in the long run if the real growth rate in pensions was zero (as it is in the UK state pension scheme); but this implies that pensioners would receive a constantly falling share of their country's resources. This led the Pension Provision Group to conclude that, in the United Kingdom at least, state pensions are affordable, but that is because they are now so low. Furthermore, expectations concerning the level of state pension provision are now much lower in Britain than they are in the rest of Europe.13Unfunded pension schemes could also be made viable if there was a suf®cient increase in the effective working life and a corresponding reduction in the retirement period. However, increasing the normal pension age will do little to increase the average effective working life in an economy where many workers have in reality left the labour force well before the existing normal pension age. To illustrate, male unemployment rates in the 60±64 age range are already above 50% in most major economies (except Japan where the rate is 24%): 83% in France, 81% in Holland, 70% in Italy, 65% in Germany, 50% in the United Kingdom and 47% in the United States.14
1.2. Funded Schemes
If PAYG state pension schemes are likely to become increasingly unviable (unless state pensions are constrained from growing in real terms or the effective working life is increased), then governments have little alternative but to transfer the burden of pension provision to funded pension schemes; and while these funded schemes could be in the public sector (as in the case of Sweden, for example), they are most likely to be in the private sector. In fact, there is a result in the pension economics literature (®rst identi®ed by Aaron (1966)) which shows the condition under which, in the long run, funded pension schemes are superior to unfunded schemes. It requires the real rate of return on the assets in funded schemes to exceed the real growth rate in the wage bill (which is equal to the `rate of return' on a pay-as-you-go system). This condition appears to hold in the case of the United Kingdom and elsewhere (see Table 1), not least because pension funds are able to generate higher returns by investing in the fastest-growing economies of the world, rather than in Europe. There is also a good theoretical reason for supposing that, in long run equilibrium, the average return on assets will exceed the growth rate in the wage bill (which, in turn, equals the growth rate in national income if the share of wages in national income is constant). This has to do with the `dynamic ef®ciency' of the economy. Saving via a pension fund helps the
12 Eltis (1994).
13 Ross (1998).
14 Johnson (1999, Table 1.4) ± the ®gures are for the early 1990s. Gruber and Wise (1997) show that
generous state disability bene®ts are being used as early retirement vehicles. The extreme case is Holland where 25% of 60±64 year old men are receiving disability bene®ts of 70% of previous earnings (up to a maximum of 125% of average earnings). Gruber and Wise conclude that `social security program provisions have indeed contributed to the decline in the labor force participation of older persons, substantially reducing the productive capacity of the labor force' (p. 26).
process of capital accumulation, which, in turn, improves the productivity of workers. However, it is possible to accumulate so much capital that the rate of return on capital assets falls below the growth rate in national income and the economy becomes `dynamically inef®cient': people could be made better off by saving less and consuming more. Dynamically inef®cient economies are unlikely to be sustainable in the long run, since the owners of capital are likely to transfer their capital to economies offering higher returns.15
However, funding is not a panacea as argued by economists such as Diamond (1977, 1997). Funded pension arrangements can give an illusion of security which disregards the political risks associated with the presence of a large pool of ®nancial assets that has accumulated on the basis of generous tax breaks: cash-strapped ®nance ministers can later change the rules of the game (as happened, for example, in 1997 when the Chancellor of the Exchequer re-moved the right of pension funds to recover the advance corporation tax paid on dividends). Further, individually-funded pension arrangements are subject to the following types of risks: the risk attached to contribution in¯ows arising from the possibility of unemployment, ill-health, disability or death-in-service during the working lifetime, the risk to the accumulating pension fund arising from the uncertainties attached to asset returns, and the risk related to the provision of pension annuities when lifetimes are uncertain. These are risks that are either expensive or impossible to hedge using private insurance markets: individuals are unable to transfer risks ef®ciently to the companies operating in these markets. Diamond argues that mandatory unfunded state pensions pro-vide the mechanism for insuring these risks collectively, although there is still the problem that unfunded schemes face a risk from the demographic time-bomb that funded schemes do not. Finally, the individual funding of pension arrangements might not be suitable or, indeed, feasible for the low paid: state-run PAYG systems permit minimum welfare standards to be established via income redistribution in a way which private sector funded schemes do not. 1.3. The Transition De®cit
Even if the move from an unfunded to a funded pension system is recognised as being desirable, there is a major transitional problem to solve. Existing pensioners in the unfunded scheme still have to be paid. With an unfunded system, pensions are paid from the contributions of those currently in work. If a funded pension system is introduced, the contributions from those in work will be invested in a fund and will no longer be available to pay the pensions of those who remain in the unfunded system. The introduction of a funded system creates what is known as a `transition de®cit'. This has to be ®nanced by extra taxation or by the issue of `recognition bonds' by the government (effectively a form of deferred taxation that formally `recognises' the unfunded liabilities of the state PAYG system). In short, the next generation has to pay twice for its pensions: once in the form of direct contributions into its own
pension fund and again in the form of extra taxation to pay for the previous generation's pensions.
Some economists question whether, in a democracy, the transition genera-tion would ever agree to make the switch, given that it is made worse off and that the future generations who would bene®t from it are not in a position to vote on the matter. The issue boils down to whether the switch is Pareto-improving: could future generations compensate the transition generation for making the switch without making themselves worse off? The answer depends on the assumptions made. For example, Breyer (1989) (see also Geanakoplos et al. (1998a,b)) uses an in®nite-horizon overlapping generations (OLG) model in which the labour supply of each worker is ®xed exogenously and there is a perfect capital market trading a single ®nancial instrument (essentially a government bond) with a real return (r) that exceeds the growth rate (g) in the population; because the labour supply is ®xed, the real wage bill (measured in wage units) also grows at rate g. Suppose the government replaces the PAYG system by issuing recognition bonds equal to the value of the unfunded pension liabilities. Workers start paying into the new funded scheme which invests in government bonds payingr. While this is higher thang, the rate of return in the unfunded scheme, workers also have to pay extra taxes to meet the interest payments on the recognition bonds. The maximum extra taxes that workers can pay is at the rate (r ÿg), otherwise they would be worse off than under the PAYG system. With tax payments of just (r ÿg) to pay the interest on the recognition bonds, the recognition bond debt will grow at rate g. But because the population is also growing at rate g, the recognition bond debt per worker will remain constant over time. However, the important point to note is that the recognition bond debt can never be paid off without making future generations worse off, since the tax rate would have to be higher than (r ÿg) to pay off the debt in ®nite time. Therefore the switch to funding can never be Pareto-improving if the assumptions of this model are valid.
However, when the assumptions are changed, we can get a different out-come. Breyer and Straub (1993), for example, allow labour supply to be endogenous and respond to net wages. Since the payroll taxes (social security contributions) collected to pay PAYG pensions are usually proportional to earnings, this will distort labour supply decisions to such an extent that PAYG is no longer Pareto-ef®cient. Breyer and Straub show that switching to lump sum payroll taxes can both remove labour supply distortions and raise suf®cient revenue to pay off the recognition bonds in ®nite time, so that a switch to funding can lead to an intergenerational Pareto-improvement. Similarly, if the capital markets trade not only bonds, but also equity with a higher return than bonds (rE.r), then the switch to funding could also be Pareto-improving,
since the tax payments to fund the recognition bond debt could be marginally higher than (r ÿg) and the debt could be paid off in ®nite time and all future generations would be better off. Geanakoploset al.(1998a,b), however, argue that equity is riskier than bonds, and that, appropriately adjusting for risk, the return on equity does not exceed that on bonds. But as we argue in Section 3.2.2 below, the absolute risk attached to a ®nancial instrument is not the
relevant measure of risk when considering a pension fund portfolio. Instead what is relevant is surplus risk, the risk on the assets relative to that on the liabilities, since the assets in an optimal pension fund portfolio are chosen to match as closely as possible the returns and risks on the liabilities. Equity is a natural long-term matching asset for pension liabilities growing at the rate of real wage in¯ation, for the simple reason that the shares of labour and capital in national income are fairly contant over time (or at least do not trend in a signi®cant way) and equity represents the ownership of capital. In contrast, ®xed income bonds are riskier than equity when liabilities grow with wage in¯ation. Pension funds gain the long run equity risk premium (rEÿr) by
investing in equities rather than bonds. Geanakoplos et al. (1998a,b) do concede that when there are capital market imperfections and the poor are constrained from holding equities, the investment of pension fund contribu-tions by the poor in equities could be Pareto-improving. As a ®nal illustration, consider an OLG model with a ®nite horizon: the burden of paying the transition de®cit could be transferred like a hot potato to the last generation alive, since it pays into a pension fund but will not be in a position to draw it down.
There are other potential bene®ts from a switch to funding as listed in ValdeÂs-Prieto (1997), such as, positive externalities in the capital markets (e.g., greater capital market deepening), access to international risk diversi®cation, more transparent ®scal accounting and greater (although as indicated above not complete) insulation from political risk.
To illustrate the size of the potential bene®ts from a switch to funding, the Conservative government in the United Kingdom announced in March 1997 plans to privatise the state pension system from the turn of the century and to end its unfunded nature. All individuals in work would receive rebates on their social security contributions which would be invested in a personalised pension account. The initial costs in terms of additional taxation were estimated to be £160m in the ®rst year, rising to a peak of £7bn a year in 2040. However, the long term savings to the taxpayer from the end of state pension provision were estimated to be £40bn per year (all in 1997 prices).16 In contrast, in Chile, the government ®nanced the transition from an unfunded to a funded system in the early 1980s by issuing recognition bonds.
2. How does the Structure of Your Pension Scheme Matter?
There are two main types of funded scheme: the de®ned bene®t (DB) scheme and the de®ned contribution (DC) scheme.17 With a DB scheme, it is the pension bene®t that is de®ned. In the United Kingdom, for example, most DB schemes are arranged by companies and are known as occupational ®nal salary schemes, since the pension is some proportion of ®nal salary, where the 16 Basic Pension Plus, Conservative Central Of®ce, 5 March 1997. These plans were put on hold as a result of the Conservative government's defeat in the May 1997 general election.
17 However, there is an increasing number of hybrid schemes being introduced which combine
proportion depends on years of service in the scheme. A typical scheme in the United Kingdom has a bene®t formula of one-sixtieth of ®nal salary for each year of service up to a maximum of 40 years' service, implying a maximum pension in retirement of two-thirds of ®nal salary, and with the pension indexed to in¯ation up to a maximum of 5% per annum (this is known as limited price indexation). In contrast, with a DC scheme, what is de®ned is the contribution rate into the fund, e.g. 10% of earnings. The resulting pension depends solely on the size of the fund accumulated at retirement. Such schemes are also known as money purchase schemes and in the United Kingdom they are better known as personal pension schemes. The accumu-lated fund must be used to buy a life annuity from an insurance company (although, in the United Kingdom, up to 25% of the fund can be taken as a tax-free lump sum on the retirement date).
2.1. The Costs and Bene®ts of DB Schemes
De®ned bene®t and de®ned contribution schemes have different costs and bene®ts. De®ned bene®t schemes offer an assured (and in many cases a relatively high) income replacement ratio in retirement. People in retirement can expect to enjoy a standard of living that is related to their standard of living just prior to retirement. But this is the case only for workers who remain with the same employer for their whole career. Fewer than 5% of workers in the United Kingdom do this: the average worker changes jobs about six times in a lifetime.18
Every time workers switch jobs they experience a `portability loss' in respect of their pension entitlement. This is because DB schemes are generally provided by speci®c employers and when a worker changes jobs they have to move to a new employer's scheme. When they do so, they will either take a transfer value equal to the cash equivalent of their accrued pension bene®ts with them or leave a deferred pension in the scheme that they are leaving. Accrued bene®ts are valued less favourably if someone leaves a scheme than if they remain an active member of the scheme. This is because scheme leavers (whether they choose a transfer value or a deferred pension) have their years of service valued in terms of their leaving salary (although this is uprated annually to the retirement date by the lower of the in¯ation rate or 5%), whereas continuing members will have the same years of service as the early leaver valued in terms of their projected salary at retirement which is likely to be higher. Long stayers are therefore subsidised at the expense of early leavers. In the United Kingdom, the portability loss is more commonly known as a `cash equivalent loss'.
For a typical worker in the United Kingdom changing jobs six times during their career, Table 2 shows that the portability loss lies between 25 and 30% of the full service pension (i.e., the pension of someone with the same salary
18 Burgess and Rees (1994), Gregg and Wadsworth (1995), Booth et al. (1996), and Disney and
experience but who remains in the same scheme all their working life). Even someone changing jobs once in mid-career can lose up to 16% of the full service pension. It is possible to reduce portability losses by, for example, indexing leaving salaries between the leaving and retirement dates to the growth in real earnings or by providing full service credits on transfers between jobs, but this is not common in the UK (except on transfers between different public sector occupational pension schemes).
2.2. The Costs and Bene®ts of DC Schemes
With DC schemes, it is important to distinguish between the accumulation and decumulation stages.
2.2.1. The accumulation stage
De®ned contribution schemes have the advantage of complete portability when changing jobs. However, individual DC schemes (such as personal
Table 2
Portability Losses from De®ned Bene®t Schemes
(Percentage of Full Service Pension Received at Retirement)
Worker type
Job separation
assumptions Transfervalue{ pension{Deferred
De®ned contribution
pension (employer-run)}
Personal pension (employer
contributions)k
Personal pension (no employer
contributions)
Average UK A 75 75
worker (MFR B 71 71
assumptions C 84 84 71 61 37
realised){{
Average UK A 75 88
manual worker B 71 86
C 84 96 78 66 45
Average UK non- A 75 86
manual worker B 71 83
C 84 94 79 68 44
Notes:
This table presents estimates of the size of the portability losses experienced by three different types
of UK workers (based on typical lifetime earnings pro®les) under three different sets of job separation assumptions: A ± separates at ages 28, 29, 30, 40 and 57; B ± separates at 26, 27, 30, 31, 38, 44 and 55; C ± separates at 45. The loss is expressed in the form of a reduced pension compared with what each of the three workers would have received had they remained in a single scheme for their whole career.
{Leaving worker takes transfer value to new scheme.
{Leaving worker leaves deferred pension in leaving scheme.
}Leaving worker transfers into employer-run DC scheme.
kLeaving worker transfers into personal pension scheme where the employer also contributes.
Leaving worker transfers into personal pension scheme where the employer does not contribute.
{{The MFR (Minimum Funding Requirement) assumptions are the assumptions speci®ed in the 1995
Pensions Act concerning future in¯ation, earnings growth and investment returns that must be used by UK pension funds from April 1997 to determine the minimum contribution level needed to meet projected pension liabilities.
pension schemes) tend to have much higher operating costs than occupational DB schemes (although occupational DC schemes may have lower operating costs than occupational DB schemes on account of their much simpler structure). Individual DC schemes in the United Kingdom take around 2.5% of contributions in administration charges and up to 1.5% of the value of the accumulated assets in fund management charges. The Institute of Actuaries has estimated that all these costs are equivalent to a reduction in contributions of between 10 and 20%; in contrast, the equivalent costs of running an occupational scheme work out to between 5 and 7% of annual contributions.19 On top of this, most of the costs associated with an individual DC scheme relate to the initial marketing and set-up. To re¯ect this, charges are also frontloaded, i.e. they are extracted at the start-up of a scheme rather than spread evenly over the life of the scheme. In many schemes, much of the ®rst two years of contributions are used to pay sales commissions. This has a dramatic effect in reducing the surrender value of a scheme if contributions cease early on and it is transformed from an ongoing to a paid-up basis. The cumulative effect of these charges in respect of DC schemes is shown in Table 3. Over a 25-year investment horizon, the average scheme with a full contribu-tion record takes around 19% of the fund value in charges, while the worst scheme provider takes around 28%.20 There is also evidence of a substantial absence of persistency in regular premium personal pension policies: the estimated average lapse rate is 27% after two years, 53% after four years and 84% after 25 years. The lapse rate±adjusted reduction in contributions for a 25-year policy is 88%: the effective contributions into this scheme for a typical policy holder are just 12p in the £.21
19 Blake (1995, sec. 7.34).
20 It is the high costs associated with individual personal pension schemes in the UK that has led
many small companies without the resources to run either occupational DB or occupational DC schemes to establish group personal pension schemes (GPPs) which have lower unit costs than personal pension schemes.
21 The lapse rates come from Personal Investment Authority (1998), while lapse rate-adjusted
reductions in contributions are estimated in Blake and Board (1999).
Table 3
Percentage of DC Fund Value Represented by Charges
5 years 10 years 15 years 20 years 25 years
Regular premium scheme (£200=month)
Best commission-free fund 3.1 4.1 7.2 8.5 9.8
Best commission-loaded fund 4.0 4.1 7.4 8.9 10.6
Industry average 11.6 13.0 14.8 17.7 19.0
Worst fund 19.2 22.0 24.6 28.2 27.8
Single premium scheme (£10,000)
Best commission-free fund 3.8 7.1 9.2 10.6 10.4
Best commission-loaded fund 3.8 7.1 9.2 10.6 10.4
Industry average 9.6 13.3 16.3 19.1 21.9
Worst fund 17.4 20.5 27.0 32.9 38.2
Further, although individual DC schemes are portable between jobs, they are not fully portable between scheme providers or even between different investment funds operated by the same provider. Transfers between personal pension scheme providers, for example, can incur charges of between 25 and 33% of the value of the assets transferred. Transfers from DB schemes into DC schemes can cost even more than this. Table 2 shows that even if a worker changes jobs only once in mid-career and moves out of a DB scheme, he would receive a reduced pension of: 71-79% of the full service pension if he moved to an employer-run DC pension (with the same total contribution rate as the DB scheme and no extra charges), 61-68% if he moved to a personal pension scheme (where the employer also contributes), and only 37±44% if he moved to a personal pension scheme (without employer contributions). Moving to a DC scheme involves a `backloading loss' in addition to the cash equivalent loss incurred when leaving a DB scheme. The backloading loss arises because bene®ts are backloaded in ®nal salary schemes but not in DC schemes; this follows because salary and therefore accrued bene®ts generally increase with years of service. Individuals transferring to a DC scheme (with age-indepen-dent contributions) forego these backloaded bene®ts: the marginal bene®t from an additional year's membership of a DC scheme is simply that year's contributions (plus the investment returns on these) which are usually a constant proportion of earnings. If the DC scheme happens to be a personal pension scheme then there are also initial and annual charges to pay, plus the possible loss of the employer's contribution. The impact of these factors can be extensive as the above portability losses indicate.22
Another problem with DC schemes, in practice, is that total contributions into them tend to be much lower than with DB schemes. In a typical DB scheme in the United Kingdom, the employee's contribution is about 5±6% of employee earnings, while the employer's contribution is double this at about 10±12%.23 The size of the employer's contribution is not widely known amongst employees; and, to an extent, the size of the employer's contribution is irrelevant from the employee's viewpoint, since the pension depends on ®nal salary, not on the level of contributions. This is not the case with DC schemes where the size of the pension depends critically on the size of contributions. When personal pension schemes ®rst started in the United Kingdom in 1988, most employers refused to contribute anything towards these schemes and many workers were not fully aware of the penalty in terms
22 There are other costs which are more dif®cult to quantify, the most important of which are search
and information costs. The Of®ce of Fair Trading's 1997Inquiry into Pensionsfound (on the basis of a
survey it conducted) that most people in the United Kingdom did not regard themselves as being ®nancially literate and also they did not tend to shop around (80% of the survey's respondents had little or no interest in ®nancial matters and 85% of respondents who had sought advice on pensions had used only one source). Traditional providers of pensions (such as insurance companies) were regarded as offering complex products that were dif®cult to understand and therefore required additional training by sales staff. Newer providers (such as direct-selling pension providers) were regarded as offering pension products that were easy to understand and therefore to sell. The tax rules were also regarded as a major source of confusion.
of the reduced pension they were incurring as a result of foregoing the employer's contribution.
However, most (about 85%) of the new occupational schemes being estab-lished in the United Kingdom are DC schemes.24 The average employee contribution into such schemes is 3%, while the average employer contribu-tion is again double at 6% (although some employers only match the em-ployee's contribution).25 Total contributions into occupational DC schemes are therefore around 9% of employee earnings compared with 15±18% for occupational DB schemes. Nevertheless, administration costs are much lower with occupational DC schemes than with personal pension schemes, so even if employers made the same contribution into an employee's personal pension scheme as into their own DC scheme, the ®nal pension would still be lower in the personal pension scheme.
While there appears to be the beginning of a global trend towards DC pension schemes in both the private and public sectors,26 it is not clear that this trend is consistent, at least in a European context, with the Community Charter of the Fundamental Social Rights of Workers(1989). The Charter states that (quoted from Atkinson (1991, p.1)):
1 Every worker of the European Community must, at the time of retire-ment, be able to enjoy resources affording him or her a decent standard of living (para. 24).
2 Any person who has reached retirement age but who is entitled to a pension or who does not have other means of subsistence, must be entitled to suf®cient resources and to medical and social assistance speci®cally suited to his needs (para. 25).
Atkinson (1991) questions whether personal pensions are compatible with the Charter. He argues that:
With personal pensions. . .there is no guaranteed pension at retirement
. . .There must be concern about those who are unlucky in their choice of investments: there is no redistribution between those whose investments have performed well and those whose turn out to be less well chosen. A guarantee is replaced by a lottery. The uncertainty surrounds both the capital sum which will be available at retirement and the rate of annuity which it will purchase (p. 20).
Asset risk is not the only risk borne by DC scheme members and their dependants. They also bear some of the other types of risk identi®ed by Diamond (1977) above, namely ill-health, disability and death-in-service. In DB
24 National Association of Pension Funds (1997); the majority (85%) of existing schemes are still DB,
however.
25 National Association of Pension Funds (1997).
26 Estimates in Blake and Orszag (1999), for example, show that for the UK, the share in total private
sector pension assets accounted for by DC schemes rose from 1% in 1980 to 18% in 1994. In the United
States, DC schemes accounted for 43% of total private sector pension assets in 1991 (Gordonet al.
schemes, these risks exist, but are typically carried by the scheme sponsor. In DC schemes, protection against these risks has to be purchased directly by the member as additional insurance policies.
Nevertheless, Table 4 shows that so long as individuals join a DC scheme at a suf®ciently early age and maintain their contribution record over a suf®ciently long investment horizon (and so get the bene®ts of compounded returns), a decent pension in retirement can be achieved for a modest contribution rate. The table indicates that a 25-year old male can expect a pension of two-thirds of ®nal salary (the maximum available from a DB scheme in the UK) with a total net contribution rate of just under 11% of earnings. The required contribution rate rises sharply with age, however. Someone joining at 35 would need a contribution rate of around 17%, and by the age of 40, the required contribution rate is above the maximum permissible under the regulations establishing such schemes.
2.2.2.
The decumulation stage: annuities
As we argued above, the trend towards private sector DC schemes will only be a success if such schemes can deliver adequate pensions in retirement. There is an impediment to this happening in the UK and elsewhere: the annuities market.
The market for immediate annuities is relatively thin: of around 240 authorised life companies in the United Kingdom, only about 10 are serious providers of life annuities at any given time.27There are a number of problems facing both annuitants and annuity providers.28 First, there is an adverse selection bias associated with mortality risk. This is the risk that only individuals who believe that they are likely to live longer than the average for the
Table 4
Contributions Needed to Achieve a Pension of Two-Thirds of Final
Salary
Age at commencement
(male) Required contributions(% of salary) Maximum contributions(% of salary)
25 10.90 17.5
30 13.41 17.5
35 16.81 17.5
40 21.66 20.0
45 28.92 20.0
50 40.81 25.0
55 64.15 30.0
60 129.83 35.0
Assumptions: Male retiring at age 65; no previous contributions into any other pension scheme; salary increases by 3% p.a.; investment return 6% p.a.
27 Association of British Insurers. The top four providers account for about 60% of sales.
population of the same age will wish to purchase annuities. Second, mortality tends to improve over time and there can be severe consequences if insurance companies underestimate mortality improvements. Insurance companies add substantial cost loadings to cover these risks, something of the order of 10± 12% of the purchase price.29 Third, there is in¯ation risk, the risk that with level annuities, unanticipated high in¯ation rapidly reduces the real value of the pension. Fourth, there is interest rate risk. Annuity rates vary substantially over the interest rate cycle. They are related to the yields on government bonds of the same expected term; and since these yields vary by up to 150% over the cycle,30annuity rates will vary by the same order of magnitude.
Even worse, the market for deferred annuities is extremely thin, particularly at distant starting dates (where the market is virtually non-existent). Where deferred annuities are available, they are very poor value for money. Deferred annuities are particularly important in the case where a DB scheme is wound up, say, as a result of the insolvency of the sponsoring company. The assets of the scheme, which is often in de®cit at the time (since the company, recognis-ing its serious ®nancial position, usually ceases makrecognis-ing contributions into the scheme some time before the insolvency is formally declared) are insuf®cient to pay the current and future pension liabilities in full. In the past, the residual assets in the scheme were used to buy non-pro®t policies for current pen-sioners and deferred annuities for deferred penpen-sioners. But fewer and fewer insurance companies are willing to sell deferred annuities because of the uncertainties attached to forecasting mortality improvements.
Insurance companies use the government bond market to protect them-selves against both interest rate and in¯ation risk. When an insurance company sells a level annuity it uses the proceeds to buy a ®xed-income government bond of the same expected term as the annuity (typically 15 years) and then makes the annuity payments from the coupon payments received on the bond. Similarly, when an insurance company sells an indexed annuity, it buys an index-linked bond of the same expected term as the annuity; few, if any, insurance companies sell indexed annuities with expected maturities beyond that of the most distant trading indexed-linked gilt. As a consequence, interest and in¯ation risk are transferred to the annuitant. If a DC scheme member retires during an interest rate trough (as happened in the mid 1990s), he can end up with a very low pension. Similarly, if a 65-year old annuitant chooses an indexed annuity, he will receive an initial cash sum that is about 30% lower than a level annuity, and, with in¯ation at 3% p.a., it would take 11 years for the indexed annuity to exceed the level annuity.31 Since
29 MacDonald (1996) found that mortality forecast errors of 15±20% over intervals of 10 years are
not uncommon. US studies (e.g., Mitchellet al.(forthcoming) and Poterba and Warshawsky (1998))
found that the deduction from the actuarially fair value of an annuity for a 65-year old US male was 15% if the male was a typical member of the population as a whole (calculated using the mortality tables for the whole US male population) and 3% if the male was typical of the population buying annuities voluntarily (calculated using the select mortality tables for male annuity purchasers), implying a 12% deduction for the greater mortality risk. Finkelstein and Poterba (1999), using UK data, estimated cost loadings for 65-year-old males of 10%
30 BGC (1998).
retired people tend to underestimate how long they will continue to live, most prefer to buy a level annuity and thereby retain the in¯ation risk. In 1995, as a result of falling interest rates, the UK government was pressed into allowing income drawdown: it became possible to delay the purchase of an annuity until annuity rates improved (or until age 75 whichever was sooner) and in the interim take an income from the fund which remained fully invested.
However, until very recently, the insurance industry (especially in Europe) has been reluctant to offer products that help annuitants hedge the risks, especially interest rate risk, that they have been forced to assume. Yet a whole range of ®nancial instruments and strategies is available to enable them do this. The simplest strategy, based on the principle of pound cost averaging, involves a planned programme of phased deferred annuity purchases in the period prior to retirement which must be of suf®cient length to cover an interest rate cycle (say, 5±7 years). A more sophisticated solution for the pre-retirement period is protected annuity funds which employ derivative instru-ments. One example places a fraction (e.g., 95%) of the funds on deposit and the rest in call options on bond futures contracts: if interest rates fall during the life of the option, the pro®t on the options will compensate for the lower interest rate. Another example places a fraction of the funds in bonds and the rest in call options on an equity index, thereby gaining from any rise in the stock market over the life of the options. However, there are very few providers of these products in the United Kingdom.
A possible solution for the post-retirement period is provided by variable annuities. These were ®rst issued in 1952 in the United States by the TIAA-CREF.32 In the United Kingdom, they are better known as unitised or with-pro®t annuities, but only a few insurance companies offer them. A lump sum is used to buy units in a diversi®ed fund of assets (mainly equities) and the size of the annuity depends on the income and growth rate of assets in the fund. The annuity can fall if the value of the assets falls substantially, so there is some volatility to the annuity in contrast with a level annuity. But since the pension from a level annuity is based on the yield on gilts, it is likely that the pension from a variable annuity, based on the return on equities, will generate a higher overall income (assuming that the duration of the annuity is suf®ciently great). The government could also do more to ameliorate these market failures in the private provision of annuities which arise, in part, from aggregate risks that are beyond the abilities and resources of private insurance companies to hedge. A number of proposals have been suggested recently. For example, in order to help the private sector hedge against in¯ation risk more effectively, the Goode Report (1993, sec. 4.4.44) suggested that the government introduce a new type of bond, with income and capital linked to the retail price index, but with payment of income deferred for a period. Such bonds were given the name `deferred income government securities' (DIGS): they could be intro-duced with different starting and termination dates and would allow all deferred pensions to be indexed to prices. DIGS were never of®cially
duced, but the introduction of the gilt strips market in 1997 could help insurance companies construct them synthetically. Similarly, the introduction of limited price index (LPI) bonds would allow post-retirement in¯ation risk to be hedged more effectively.
But the main causes of market failure are the risks associated with adverse selection and mortality. Making second pensions mandatory rather than voluntary would do much to remove the adverse selection bias in the demand for annuities.33 The government could also help insurance companies hedge the risk associated with underestimating mortality improvements by issuing `survivor bonds', a suggestion made in Blake and Orszag (1998) and Blake, Burrows and Orszag (1999). These are bonds whose future coupon payments depend on the percentage of the population of retirement age on the issue date of each bond who are still alive on the date of each future coupon payment. For a bond issued in 2000, for instance, the coupon in 2010 will be directly proportional to the amount, on average, that an insurance company has to pay out as an annuity at that time. The insurance company which buys such a security bears no aggregate mortality risk and, as a consequence, cost loadings fall. There is therefore much that could be done by both government and the insurance industry to improve the market for annuities which at the moment are the weak tail in DC pension provision.
Although Atkinson's concerns are valid in the sense that there can be a wide variation both in the returns generated by DC pension funds and in the annuity rates that are available over different phases of the interest rate cycle, the most important challenges with DC schemes remain the inadequate contributions that are made into them during the working lifetime and their high charges. Furthermore, there exist fund management techniques available to reduce the volatility in fund values as the retirement date approaches; these will be discussed in Section 3 below.
3. How Does the Management of Your Pension Fund Matter?
In the last section, we examined the costs and bene®ts of DB and DC schemes without discussing how the two schemes were related. In this section, we demonstrate the relationship between the two types of scheme, using an approach developed in Blake (1998). This will make it easier to understand the different investment management strategies appropriate for DB and DC schemes.
33 There is a growing body of support for mandatory contributions into second pensions, including
Field and Owen (1993), Borrie (1994), World Bank (1994b), Dahrendorf (1995), and Anson (1996), as
well as surveys of customers conducted by NatWest Bank and Coopers & Lybrand (reported in Field (1996, pp. 52±3)). Compulsory contributions are seen as one way of dealing with individual myopia and the problem of moral hazard. The ®rst issue arises because individuals do not recognise the need to make adequate provision for retirement when they are young. The latter problem arises when individuals deliberately avoid saving for retirement when they are young because they know the state will feel obliged not to let them live in dire poverty in retirement.
3.1. The Relationship Between DB and DC Schemes
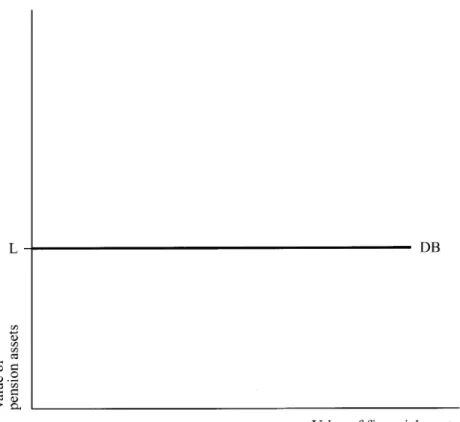
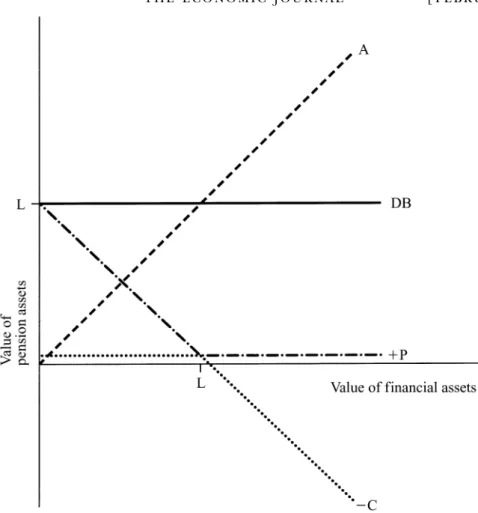
Fig. 1 shows that the present value of the DC pension on the retirement date depends entirely on the value of the fund's assets on that date. Fig. 2 shows that the present value of the DB pension (L) is independent of the value of the fund's assets. Fig. 3 shows that the DB pension can be replicated using an implicit long put option (P) and an implicit short call option (ÿC) on the underlying assets of the fund (A), both with the same exercise price (L) which equals the present value of the DB pension at the member's retirement age. The put option is held by the scheme member and written by the scheme sponsor, while the call option is written by the member and held by the sponsor. If, on the retirement date of the member, which coincides with the expiry date of the options, one of the options is in-the-money, it will be exercised. If the value of the fund's assets is less than the exercise price, so that the scheme is showing an actuarial de®cit, the member will exercise his or her put option against the sponsor who will then be required to make a de®ciency payment (LÿA). If, on the other hand, the value of the assets exceeds the exercise price, so that the scheme is showing an actuarial surplus, the sponsor will exercise his or her call option against the member and recover the surplus (AÿL). This implies that a DB scheme is, in effect, a risk-free investment from
the member's viewpoint: DB scheme members end up with the same pension whatever the value of the underlying assets.
It is clear from this how DB and DC schemes are related. A DC scheme is invested only in the underlying ®nancial assets. A DB scheme is invested in a portfolio containing: the underlying assets (and so is, in part, a DC scheme) plusa put optionminusa call option on these assets. The actuarial surplus with a DB scheme is de®ned as the difference between the values of the pension assets and liabilities. The pension assets at any time comprise the ®nancial assets accumulated by that time plusthe present value of the promised future contributions into the scheme. The pension liabilities at any time are equal to the present value of the future pension payments from the scheme. By de®nition, the surplus is always zero with a DC scheme. The surplus risk (i.e., the volatility of the surplus) with a DB scheme depends on both the difference between the volatilities of the pension asset and pension liability values and on the correlation between these values. The main sources of these volatilities are uncertainties concerning future investment returns, real earnings growth rates and in¯ation rates. This is because investment returns determine the rate at which contributions into the pension fund accumulate over time, the growth rate in real earnings determines the size of both contributions into the scheme and the pension liability at the retirement date, and the in¯ation rate
ences the growth rate of pensions during retirement. With a DC scheme, the surplus risk is zero by de®nition.
The options embodied in a DB scheme are known as `exchange options'. They are a variant of the more familiar Black-Scholes options which recognise that, if exercised, risky assets are exchanged at an exercise price that is indexed to the uncertain value of the pension liabilities, in contrast with the standard model where the exercise price is constant. The value of these options depends on the magnitude of both the surplus and surplus risk. In particular, if both the surplus and surplus risk can be maintained at zero, the call and the put both have zero value. It follows that, if these conditions are satis®ed, DB and DC schemes are equivalent in the sense of delivering the same pension in retirement. In other words, it is possible to manage a DC scheme in such a way that it generates the same pension in retirement as a ®nal salary DB scheme: such schemes are known as `targeted money purchase schemes'.
3.2. The Optimal Management of DB and DC Schemes 3.2.1. DC schemes: maximising risk-adjusted expected value
The optimal management of a DC scheme is fairly straightforward, once the critical task of determining the attitude to risk of the scheme member has been undertaken. This usually involves assessing the degree of risk tolerance of the scheme member. The greater the degree of risk tolerance, the greater the risk that can be borne by the scheme's assets and hence the greater the expected value of the pension fund at the retirement date. This can be explained in terms of the risk-adjusted expected value of the asset portfolio which is de®ned as the expected value of the pension assets net of a risk penalty, where the latter equals the ratio of the volatility of the fund's assets to the member's degree of risk tolerance. The higher the asset risk and the lower the risk tolerance, the greater the risk penalty. The fund manager's task is to maximise the risk-adjusted expected value. It is possible to increase the expected value of the pension assets by taking on more risk, but if too much additional risk is taken on, the risk-adjusted expected value will fall, especially if risk tolerance is low. The risk penalty shows the cost of taking on more risk.
Personal pension DC schemes in the United Kingdom are provided by ®nancial institutions such as insurance companies, banks, building societies, unit trusts (i.e., open-ended mutual funds), investment trusts (i.e., close-ended mutual funds), and open-ended investment companies. The scheme provider will offer the scheme member a choice of investment vehicles in which the pension assets will accumulate, ranging from low risk (e.g. a deposit adminis-tration scheme), through medium risk (e.g. an endowment scheme from an insurance company) to high risk (e.g. a unit-linked scheme). The deposit administration scheme is targeted at a scheme member with a very low degree of risk tolerance, while the unit-linked scheme is targeted at a scheme member with a high degree of risk tolerance. However, it is arguable whether low-yielding deposits are a suitable investment vehicle for long-horizon investment programmes such as pension schemes. Other asset categories, such as equities, have, in the past, offered much higher long-run returns. Furthermore, equities may have high short-term volatility, but long-run returns have been much more stable. Investing in deposit administration schemes or bonds has been described as a strategy of `reckless conservatism': these assets, while having stable capital values in nominal terms over short horizons, do not tend to have long-term returns that match the real growth rate in earnings. Despite this, surveys of personal pension scheme members in the United Kingdom and elsewhere tend to show that fear of short-term capital loss drives many individuals towards investment strategies that are recklessly conservative in the long run. Nevertheless, once a scheme member has selected a particular type of scheme, the fund manager's task is to choose the asset mix (between equities, bonds, property etc.) that maximises the risk-adjusted expected value of the assets.34
3.2.2. DB schemes: asset-liability management
The appropriate investment management strategy for pension funds running DB schemes is asset-liability management (ALM) (also called surplus risk management).35 This involves constructing a portfolio of ®nancial assets that (together with promised future pension contributions) matches the pension liabilities in two key respects: size and volatility.
First, if pension schemes are always fully funded, so that assets are always suf®cient to meet liabilities in full, then the surplus will always be zero. This can be achieved by adjusting the contribution rate (especially the employer's contribution rate) into the fund. In practice, there are usually some tolerance limits. In the United Kingdom, for example, it is permissible for the value of assets to vary between 90% and 105% of the value of liabilities. If the value of assets exceeds the 105% limit, the scheme has up to 5 years to reduce the value to 100% of liabilities (Finance Act 1986). The most common means of doing this is the employer's contribution holiday, although other means are avail-able: an employee's contribution holiday, improved pension bene®ts or selling off ®nancial assets, the proceeds from which are returned to the sponsor subject to a 40% tax. If the value of assets falls below 90% of the value of liabilities, the scheme has one year to raise the value of assets to 90% of liabilities and up to a further 5 years to raise it back to 100% (this is known as the `minimum funding requirement' of the Pensions Act 1995). The most common means of doing this is additional employer contributions (i.e., de®ciency payments), since most DB pension schemes operate on a balance of cost basis.
Second, if the assets in the pension fund are selected in such a way that their aggregate volatility matches that of the liabilities, then the surplus risk can be reduced to zero, which combined with a zero surplus, implies that the implicit options in the DB scheme can be issued free of charge. This requires the assets in the pension fund to have both the same variance as the pension liabilities and to be perfectly correlated with them (although it is unlikely in practice that ®nancial assets with these precise properties exist, unless governments in the near future begin to issue zero-coupon wage-indexed bonds). This, in turn, requires the assets to constitute a `liability immunising portfolio', that is, a portfolio that immunises (or hedges) the interest rate, real earnings growth rate and in¯ation rate risks embodied in the pension liabilities.
Structuring the liability immunising portfolio is the most important part of determining the fund's strategic asset allocation (SAA). The SAA is usually determined by the fund manager in collaboration with the fund's sponsor on the advice of the fund's actuary. Given the nature of the fund's liabilities
35 See, e.g., Fabozzi and Konishi (1991) or Blake (1995, Ch.13). Formally the fund manager's
objective with a DB scheme is to minimise surplus risk each period subject to the condition that the surplus is always zero. The control variables in this dynamic programming exercise are the contribution rate into the fund and the composition of the assets in the funds (i.e. the portfolio weights or the asset allocation). See Blake (1992) for an analysis of UK pension fund investment behaviour over a period when DB schemes were broadly unconstrained by their liabilities and hence pursued investment strategies more akin to maximising risk-adjusted expected value.
(which are typically indexed to real wage growth), the liability immunising portfolio during the early life (i.e., immature stage) of a pension scheme will contain a high proportion of equities and other `real' assets such as property, on the grounds that (as we argued above), the shares of factors of production in national income tend to be relatively stable, so that the returns to capital (equity) and land (property) will over the long run match that on labour (real wages). The actuary's advice will be based on an asset-liability modelling (ALM) exercise. ALM is a quantitative technique used to help structure asset portfolios in relation to the maturity structure of liabilities. It begins by making forecasts about how a pension fund's liabilities are going to accrue over a particular time horizon, that might be 5, 10 or 15 years ahead. To do this, assumptions concerning salary growth rates, staff turnover, and the age distribution and sex composition of the workforce have to be made. Then forecasts concerning the funding position of the pension scheme have to be generated. This involves making projections of future contribution rates and also assessing the value of assets in relation to accrued liabilities. These forecasts and projections are made under different scenarios concerning likely outcomes. Typically three scenarios are adopted: most likely, best-case and worst-case. This provides a realistic range of possible outcomes, and, in the latter case, spells out the extent of the risks that the pension fund sponsor faces.
There are two main uses of ALM. The ®rst is to indicate the consequences of adopting any particular investment strategy. The second is to discover alter-native strategies that increase the likelihood of meeting the fund's objectives. Proponents of asset-liability modelling argue that the strategy allows pension funds to generate higher returns without any consequential increase in risk. The modelling exercise might indicate, for example, that if current investment returns are sustained, there would be no need to change the employer contribution rate into the pension fund over the next 5 years. However, the worst-case scenario might indicate the employer contribution rate might have to rise by 10% over the next 5 years. The exercise therefore allows the scheme sponsor to plan for this possibility. As another illustration, the modelling exercise might indicate that because a pension fund is maturing, it should switch systematically out of equities into ®xed-income bonds (in the ®ve or so years prior to retirement), which are more likely to meet pension liabilities with lower risk of employer de®ciency payments; this is known as `lifestyle' fund management (or `age phasing').
Some fund managers are concerned that ALM gives an unwarranted role to outsiders, such as actuaries, in designing the strategic asset allocation. Actu-aries have always had a role in determining the value of a pension scheme's liabilities. But with the advent of ALM, actuaries have begun to have a role in setting the long-term or strategic asset allocation over, say, a 10-year horizon. Some fund managers claim they are being reduced to the subsidiary role of determining tactical asset allocation (or market timing) and stock selection relative to this new long-term strategic asset allocation benchmark. However, not all fund managers are critical of the rede®nition of their respective roles.
Many fund managers have positively welcomed the formal separation of long-term policy decisions from short-long-term tactical decisions that ALM allows.
Another potential problem concerns the interpretation of measures of investment performance in the light of the technique. ALM justi®es different pension funds pursuing different investment policies. For example, small, fast-growing funds might pursue very aggressive investment policies, while large mature funds might adopt more passive investment policies. This makes it very dif®cult to interpret a single performance league table drawn up on the assumption that all funds are pursuing the same objective of maximising expected returns. Performance measurement services have begun to take this into account by constructing peer-group performance league tables, drawn up for sub-groups of funds following similar objectives. We now discuss perform-ance measurement in more detail.
4. How Does the Investment Performance of Your Pension Fund
Matter?
Good or bad investment performance by DB and DC pension schemes have very different consequences for scheme members. With DB schemes, the investment performance of the fund's assets are of no direct relevance to the scheme member, since the pension depends on the ®nal salary and years of service only and not on investment performance. The scheme member can rely on the sponsoring company to bail out the fund with a de®ciency payment if assets perform very badly (i.e. the member exercises the implicit put option against the sponsor). In extreme circumstances, however, it is possible for a ®rm and possibly the scheme to become insolvent. Of course, if the assets perform well, the surplus is retained by the sponsor (who exercises the implicit call option against the member in this case).
However, investment performance is critical to the size of the pension in the case of a DC scheme: scheme members bear all the investment risk in such schemes. Scheme members, especially personal pension scheme members, can ®nd themselves locked into a poorly performing fund, facing very high costs of transferring to a better performing fund. In addition, the type of funds in which personal pension scheme members invest can and do close down and then the assets do have to be transferred to a different fund. In this section, we examine the investment performance of pension scheme assets, beginning with those of DC schemes.
4.1. Investment Performance of DC Schemes
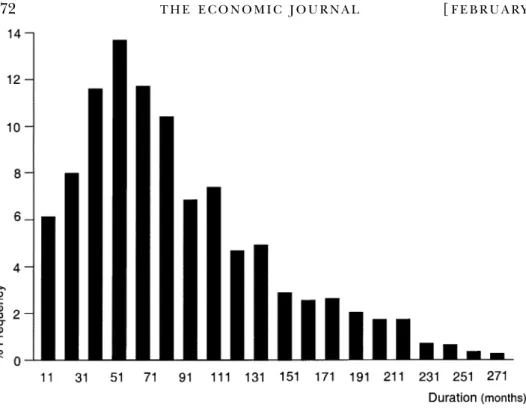
The anticipated return in a high-risk investment vehicle must be greater than that in a low-risk investment vehicle, but there can be wide differences in realised returns, even for schemes in the same risk class. Blake and Timmer-mann (1998) conducted a study of the investment performance of unit trusts in the United Kingdom, one of the key investment vehicles for DC schemes. Table 5 shows the distribution of returns generated by unit trusts operating in