© 2019, IRJET | Impact Factor value: 7.211 | ISO 9001:2008 Certified Journal
| Page 7222
Brain Tumor Detection Using Digital Image Processing
Amit D. Mudukshiwale
1, Prof. Y M. Patil
21
Student, Dept. of Electronics Engineering, KIT’s college of Engineering Kolhapur, Maharashtra, India
2
Professor, Dept. of Electronics Engineering, KIT’s college of Engineering Kolhapur, Maharashtra, India
---***---Abstract -According to International Agency for Research on Cancer (IARC), the rate of diagnosis of brain tumor is estimated to be comparatively greater than the mortality rate. Brain tumor is one of the major causes for the increase in Mortality among people. A tumor is an abnormal growth caused by cells reproducing themselves in an uncontrolled manner. Brain tumors are the tenth most common cause of cancer death.Generally, CT scan or MRI that is directed into intracranial cavity produces a complete image of brain. This image is visually examined by the physician for detection and diagnosis of brain tumor. However this method of detection resists the accurate determination of stage and size of tumor. Most Medical Imaging Studies and detection conducted using MRI, Positive Emission Tomography (PET) and Computed tomography (CT) Scan.
Brain tumor diagnosis is done by doctors. For detecting brain tumor grading always gives different conclusion between one doctors to another. For helping doctors diagnose brain tumor grading, we have taken this project. This project made a software program in MATLAB which detects the brain tumor. The algorithm incorporate steps for preprocessing, image segmentation, feature extraction and image classification using MRI image.
Key Words: Median filter, K-means segmentation,
Watershed segmentation, Fuzzy c means segmentation, Morphological operators
1. INTRODUCTION
The nervous system consists of the brain, spinal cord, and a complex network of neurons. This system is responsible for sending, receiving, and interpreting information from all parts of the body. The nervous system monitors and coordinates internal organ function and responds to changes in the external environment. The central nervous system (CNS) is a part of nervous system. It is the processing center for the nervous system. It receives information from and sends information to the peripheral nervous system. The two main organs of the CNS are the brain and spinal Cord.
The brain processes and interprets sensory information sent from the spinal cord. The brain is the anterior most part of the central nervous system. Nowadays, detection of anatomical brain structures with their exact location and orientation has become an extremely important task in the diagnosis of brain tumor. Detection of anatomical brain structures plays an important role in the planning and
analysis of various treatments including radiation therapy and surgery. Because of this, development of efficient and accurate MRI segmentation technique has become one of the most important areas of research today.
These days, in most of the hospitals, radiologists performs the diagnosis of brain tumor manually on MR images, this process is error prone, in particular because of large number of image slices of single patient and due to the large variation in the intensity of various images representing different brain structures. Due to the involvement of various kinds of abnormalities, pathology, radiologist’s perception and image analysis. At diagnosis stage, manual segmentation of brain tumor from MR
2. METHODOLOGY
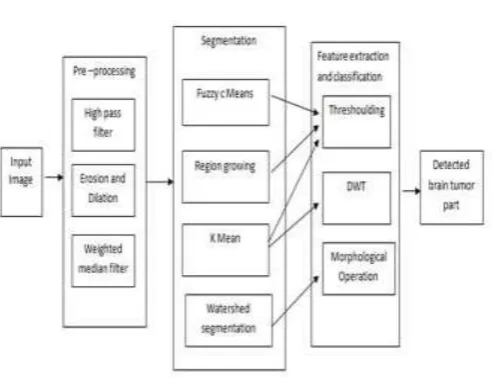
Here fig.2.1 shows the block diagram of our brain tumor detection system. it contains the steps such as preprocessing , segmentation and feature extraction and classification. For processing this different brain images should be preprocessed to remove the film artifacts, labels for that tracking algorithm is used. Median filter is used to remove high frequency component also morphological techniques are used for to remove skull portion. The position of tumor objects is separated from other part of a brain image by using different segmentation algorithms. K-means clustering is a type of clustering algorithms.
© 2019, IRJET | Impact Factor value: 7.211 | ISO 9001:2008 Certified Journal
| Page 7223
[image:2.595.35.282.85.274.2]
Fig 2.1: Block Diagram
2.1 IMAGE AQUISISION
Preprocessing and enhancement techniques are used to improve the detection of the suspicious region from Magnetic Resonance Images (MRI). From the fig 2.2 the preprocessing and enhancement method consists of two steps; first the removal of film artifacts such as labels and X-ray marks are removed from the MRI using tracking algorithm. Second the removal of high frequency components using median filtering technique. Film artifacts that are removed using tracking algorithm which removes the high intensity value of film artifacts are removed from MRI brain image. Median Filter can remove the noise, high frequency components from MRI without disturbing the edges.
Fig 2.2: Block Diagram of stages of preprocessing
Images of a patient obtained by MRI scan is displayed as an array of pixels and stored in Matlab 18.Here, grayscale or intensity images are displayed of default size 256*256 by giving a large matrix whose entries are numbers between 0 and 255, with 0 corresponding to black, and 255 to white. The brain MR images are stored in the database in JPEG format.
2.2 Use of median filter for de-noising
Median Filter can remove the noise, high frequency components from MRI with-out disturbing the edges and it is used to reduce salt and pepper noise. This technique calculates the median of the surrounding pixels to determine the new (de-noised) value of the pixel. A median is calculated by sorting all pixel values by their size, then selecting the median value as the new value for the pixel. For each pixel, an 3*3, 5*5, 7*7, 9*9, 11*11 window of neighborhood pixels are extracted and the median value is calculated for that window. The intensity value of the center pixel is replaced with the median value. This procedure is done for all the pixels in the image to smoothen the edges of MRI.
2.3 Use of Segmentation Methods
K means segmentation is type of clustering methods use greedy interactions with existing clusters to come up with a good overall representation. For example, in agglomerative clustering we repeatedly make the best available merge. However, the methods are not explicit about the objective function that the methods are attempting to optimize. An alternative approach is to write down an objective function that expresses how good a representation is, and then build an algorithm for obtaining the best representation. A natural objective function can be obtained by assuming that we know there are k clusters, where k is known. Each cluster is assumed to have a center; we write the center of the ith cluster as ci. The jth element to be clustered is described by a feature vector xj. For example, if we were segmenting scattered points, then x would be the coordinates of the points; if we were segmenting an intensity image, x might be the intensity at a pixel. Notice that if the allocation of points to clusters is known, it is easy to compute the best center for each cluster. However, there are far too many possible allocations of points to clusters to search this space for a minimum. Instead, we define an algorithm which iterates through two activities: first is Assume the cluster centers are known, and allocate each point to the closest cluster center and second one is to assume the allocation is known, and choose a new set of cluster centers. Each center is the mean of the points allocated to that cluster.
[image:2.595.56.260.496.631.2]© 2019, IRJET | Impact Factor value: 7.211 | ISO 9001:2008 Certified Journal
| Page 7224
2.4 Fuzzy C means segmentation
FCM algorithm based on the concept of fuzzy C partition, which was introduced by various researcher in this field Ruspini , developed by Dunn and generalized by Bezdek. The aim of FCM is to find cluster centers (centroids) that minimize dissimilarity functions. In order to accommodate the fuzzy partitioning technique, the membership matrix (U) is randomly initialized. In the first step, the algorithm selects the initial cluster centers from SOM clustering algorithm. Then, in later steps after several iterations of the algorithm, the final result converges to actual cluster center. Therefore a good set of initial cluster is achieved and it is very important for an FCM algorithm. If a good set of initial cluster centers is chosen, the algorithm make less iterations to find the actual cluster centers. The winning neural units and their corresponding weight vectors from each layer result in a hierarchical structure termed as an abstraction tree. Each node in the abstraction tree represents the region of the image at a specified level of abstraction. A segmented image is generated on demand by traversing the abstraction tree in the breadth first manner starting from the root node until some criterion is met. The size of the abstraction tree (weight vector) is expanded if the sum of the variances of weight vector divided by size of the weight vector is less than element of weight vector. Otherwise the node is labeled as a closed node and none of its descendants are visited. Regions corresponding to the closed nodes constitute a segmented image and the resulting segmented image usually contains the regions from different abstraction levels.
The Fuzzy C-Means algorithm is an iterative algorithm that finds clusters in data and which uses the concept of fuzzy membership. Instead of assigning a pixel to a single cluster, each pixel will have different membership values on each cluster.
2.5 Watershed segmentation method
In this technique the MRI image is extracted using watershed segmentation method and the exact tumor part is classified using morphological operators like erosion and dilation. Grey-level image may be seen as a topographic relief, where the grey level of a pixel is interpreted as its altitude in the relief. A drop of water falling on a topographic relief flows along a path to finally reach a local minimum. Intuitively, the watershed of a relief corresponds to the limits of the adjacent catchment
basins of the drops of water. In image processing, different watershed lines may be computed. In graphs, some may be defined on the nodes, on the edges, or hybrid lines on both nodes and edges. Watersheds may also be defined in the continuous domain.
There are also many different algorithms to compute watersheds. It is more preva-lent in the fields like biomedical and medical image processing, and computer vision. In topography, watershed means the edge that partitions area drained by diverse river system. If image is viewed as geological landscape, the watershed lines find out boundaries which separate image regions. The watershed transform figures catchment basins and ridgelines (otherwise called watershed lines), where catchment basins relating to image regions and ridgelines identifying with region boundaries. Segmentation by watershed embodies many of the concepts of the three techniques such as threshold based, edge based and region based segmentation. It gives very good segmentation results, and meets the criteria of less computational complexity.
2.6 Threshold Segmentation
© 2019, IRJET | Impact Factor value: 7.211 | ISO 9001:2008 Certified Journal
| Page 7225
[image:4.595.166.433.141.438.2]3. RESULT
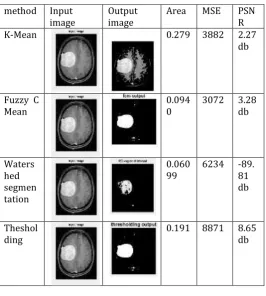
Table 3.1:Comparison of results
4. CONCLUSION
In this system brain tumors have been segmented with the help of 4 methods. The execution time for watershed and k means method is less compared to the other segmentation methods. Regarding the number of tumor pixels, thresholding and Fuzzy C-means clustering give a better result than the other methods.
REFERENCES
[1] Nilakshi Devi and Kaustubh Bhattacharyya "Automatic Brain Tumor Detection and Classification of Grades of
Astrocytoma"
[2] Shrutika Santosh Akshata Raut Swati Kulkarni et al "Implementation of Image Processing for Detection of Brain
Tumors"(Proceedings of the IEEE 2017 International Conference on Computing Methodologies and Communication (ICCMC))
[3] S. G, Ranjith Balakrishnan “Brain Tumor Diagnosis from MRI feature Analysis A Comparative Study” (IEEE-2nd
International Conference on Innovation in Information Embedded and Communication Systems ICIIECS'15, 2015.)
[4] D. M. Joshi, Dr.N. K. Rana, &, V.M. MisraMisra,_Classi_cation of “Brain Cancer Using Artificial Neural
Network”(IEEE-2nd International Conference on Electronic Computer Technology (ICECT), 2010.)
[5] Asra Aslam, Ekram Khan, M.M. Sufyan Beg, “Improved Edge Detection Algorithm for Brain Tumor Segmentation”,
(Elsevier, Science Direct, Procedia Computer science , pp. 430-437., 2015.)
[6] Shobana G, "Brain Tumor Diagnosis From MRI Feature Analysis - A Comparative Study” (IEEE Sponsored 2nd
International Conference on Innovations in Information Embedded and Communication Systems ICIIECS'15)
[7] P. Sangeetha, "Brain Tumor Classification Using PNN and Clustering"(International Journal of Innovative Research in
Science, Engineering and Technology, 2014. Pp. 796-803.)
[8] R. Shelkar, M. N. Thakare, "Brain Tumor Detection and Segmentation by using Thresholding and Watershed
Algorithm",(IJACT, Volume 1, Issue 3, July 2014)
[9] C. Arizmendi, Alfredo Vellido, Enrique Romero, "Binary Classification of Brain Tumors Using a Discrete Wavelet
Transform and Energy Criteria", (IEEE 2011, 2011, pp. 1-4.) method Input
image Output image Area MSE PSNR
K-Mean 0.279 3882 2.27
db
Fuzzy C
Mean 0.0940 3072 3.28 db
Waters hed segmen tation
0.060
99 6234 -89. 81 db
Theshol
© 2019, IRJET | Impact Factor value: 7.211 | ISO 9001:2008 Certified Journal
| Page 7226
[10] applied science and technology (ajast) (open access quarterly international journal) volume 2, issue 2, pages 274-276,april-june 2018.
[11] Anujaraj V1, C B Bromy2, Johns Vinod3, Nithin Prakash4, Binsa Mathew5 “An OBD Based Heads up Display for
Automobiles” proceeding of 2017International Journal of Advanced Research in Electrical, Electronics and Instrumentation Engineering