by
Giovanni Andrea Cornia* and Frances Stewart**
* International Child Development Centre UNICEF, Florence ** Queen Elizabeth House, University of Oxford
by Giovanni Andrea Cornia and Frances Stewart1
"This scheme [noonday meals] is the outcome of my experience of extreme starvation at an age when I knew only to cry when I was hungry. But for the munificence of a woman next door who extended a bowl of rice gruel to us and saved us from the cruel hand of death, we would have departed this world long ago. Such merciful women folk, having great faith in me, elected me as Chief Minister of Tamil Nadu. To wipe the tears of these women I have taken up this project...To picture lakhs and lakhs of poor children who gather to take up nutritious meals in thousands of hamlets and villages all over Tamil Nadu and blessing us in their childish prattle, will be a glorious event". [Chief Minister of Tamil Nadu. M.G. Ramachandran on noon meals scheme - quoted in Harriss, 1992, p10]
I. INTRODUCTION
This chapter considers the appropriate design of food interventions in developing countries if they are to meet their objectives effectively.
The first issue is what is the objective? Until one knows this, one cannot assess alternative policy instruments. In practice, food subsidies have been intended to meet a variety of objectives, including keeping urban wages low, maintaining political support, avoiding inflation, as well as the more obvious ones of reducing poverty and improving nutrition (see Pinstrup-Andersen (ed) 1988). In fact one reason why some food subsidies have been ineffective in transferring incomes to the poor is that this was not their main objective.
1We are grateful to participants at the seminar, Steven Coate, and the editors of this volume for useful comments on an earlier draft.
In this chapter, we assume that the overriding objective of food interventions is to transfer incomes to poor households. We also consider issues of intra-household distribution in relation to the appropriate design of food interventions.
At first, it might appear that the best way to achieve resource transfers to poor households is to design interventions to achieve minimum leakage to the non-poor, so that any given resource transfer will have maximum impact on poor households. A well targeted program, then, will be one which achieves minimum leakage. This is a common view in the literature (see, for example, Mateus, 1983; Grosh, 1992). But this may be incorrect for a number of reasons, including administrative and efficiency costs, political factors and other general equilibrium effects2. These will be ignored or considered only briefly below. An important additional reason why the criterion of minimizing leakage may not be the right one lies in the existence of two errors of targeting: errors of omission of the poor from the scheme, as well as errors of inclusion of the non-poor. (These two types of error correspond to type I and type II errors in statistical analysis). These two errors are the main focus of this chapter.
The next section defines the two errors of targeting, considers likely relationships between them, and suggests ways of measuring them. Next we summarize evidence from a variety of food subsidy programs with respect to the two errors. The following section looks at distribution within the family as a
2In selecting interventions, general equilibrium effects should also be considered - in particular the effects of alternative food interventions on food prices. General food subsidies are more likely to affect food prices across-the board- than narrowly targeted schemes. In the short run they may therefore lower food prices, thereby generating additional benefits for poor (and other) consumers. But the long run effects depend on how far producer prices are affected. This chapter does not explore such general equilibrium effects.
further source of errors. We then make an attempt to evaluate the two errors, and show how the "optimum" scheme can change when errors of omission are also included. The net budgetary costs of leakage to the non-poor depend on how far the additional benefits conferred on the non-poor can be "clawed-back" through the tax system. This issue is briefly considered followed by some concluding remarks.
II. TWO TYPES OF MISTAKES IN TARGETING
In terms of the efficiency of the targeting mechanism, there are two types of mistakes to which any intervention may be subject. The first is that of failing to reach the target population. We shall describe this as an F-mistake, i.e. a failure in the prime objective of the intervention. The second type of mistake is that made when the intervention reaches the non-target population; this we shall call an E-mistake (since what is involved is excessive coverage). A major criticism of nutritional schemes in general, and a fortiori of untargeted schemes, is that E-mistakes are high. For example, in a study of targeting, Mateus (1983) argues that total costs are unnecessarily high because of the high number of E-mistakes in a variety of interventions; he notes that in Morocco, it was estimated that 80 percent of the budgetary costs in the rural areas and 70 percent in the urban areas "increased the consumption of the already well-nourished" (op. cit. p. 9).
In designing targeted interventions, attention has tended to be focused on mistakes brought about by excessive coverage, with much less attention on mistakes resulting from failures to reach the target group. Narrowly targeted interventions often show apparently favorable cost-benefit ratios (Mateus op. cit.; Pinstrup-Andersen 1991). This arises from the
smaller size of the target group and the fact that the more the intervention is restricted to groups in extreme deprivation, the greater one would expect the improvements from the intervention to be - measured say by gains in weight of malnourished children. But to date, cost benefit analyses of food interventions have not included any evaluation of F-mistakes, or the costs of failing to cover the whole target population. F-mistakes are particularly serious where it is the ultra-deprived who are left out, and are likely to be largest where malnutrition is widespread. The larger the proportion of the population which is malnourished, the higher the potential F-mistakes and the lower the potential E-mistakes. This is one reason why the controversy (see Sukhatme, 1977; Dasgupta and Ray 1987) about the extent of malnutrition is so relevant to the design of nutrition interventions.
For the most part, pursuit of low E-mistakes tends to raise F-mistakes because some of the target group tend to be eliminated from the scheme along with the non-target population, for the following reasons:
- lack of information about the targeted schemes among the target group;
- costs of acquiring entitlements to targeted schemes. These may require travel, registering applications, appearing at a clinic etc. depending on the targeting mechanism.
- qualifications for entitlement, which while excluding the non-poor, also almost invariably exclude some of the target group (e.g. use of geographical qualification for entitlement).
- social stigma.
Measuring E and F-Mistakes:
the target of the food intervention) and non-poor people NP, for each intervention one can observe four categories illustrated below:
Table 1: Classification Matrix: E and F-Mistakes of Food Interventions
Poor Non Poor All covered by
nutritional intervention
Pc NPc
[E mistakes] Nc
All non-covered by
nutritional intervention
Pnc
[F-mistakes]
NPnc Nnc
Total P NP N
Where
P + NP = Nc + Nnc = Pc + Pnc + NPc + NPnc = N In the ideal case, E and F-mistakes are nil, i.e.
Pc + NPnc = N
while in the case of total mistargeting (i.e. when none of the poor are covered by the intervention and all the non-poor are) NPc + Pnc = N
F-mistakes consist of Pnc and may be measured as a proportion of the total population, N, or Pnc/N, or as a proportion of the target population, Pnc/P. The latter is the measure of F-mistakes which is used in this section. It is a good indication of how far a scheme is failing in its primary intention to reach the target group.
E-mistakes consist of NPc and may be measured as a proportion of the total population, NPc/N, or as a proportion of the total non-target population, NPc/NP. E-mistakes may also be estimated as the money cost of the excess coverage, or vNPc where v is the average money cost of the subsidy received by the non-target population, and may be expressed as a proportion of the total costs of the subsidy, i.e. vNPc/S,
where S is the total money value of the subsidy. Where the subsidy consists of a given sum, equal for each recipient, (as with school meals), this ratio is equivalent to the ratio of NPc/[NPc + Pc].
The most common measure of E-mistakes is vNPc/S as it gives an estimate of the financial costs of the mistake. This is shown below as E'. Where data is available we also show the proportion of the non-target population covered, NPc/NP, which we describe as E". Where the non-target population is a small proportion of the total population, as in very poor areas, a high E" can be associated with low E'; conversely if the non-target population is a high proportion of the total, a small E" could be associated with a high E'.
III. THE TWO ERRORS IN PRACTICE
This section reviews evidence from eight countries showing how the two major errors vary with the type of food support scheme; the country studies illustrate that the magnitude of the errors depends not only on the design of the scheme but also on the environment in which it is introduced. The cases examined include countries from each of the three developing regions, and both middle and low-income countries.
(i) Tamil Nadu - India
A scheme providing free school meals and infant feeding was introduced in Tamil Nadu in 1982. The noon meals scheme is politically very popular, and was one factor behind the re-election of the ruling party, ADMK, in 1984. In addition, people have access to subsidized rice through the public distribution system (PDS).
Coverage in principle: Pre-school children registered at nurseries (age two and older); all registered school attenders below 10; extended to old age pensioners, ex-servicemen and widows below a poverty line.
Cost: 10 percent of state budget, which is equivalent to the
deficit of the state electricity board, and exceeds the state's annual investment in agriculture. It is financed out of general revenue, additional taxes on luxuries, some voluntary contributions plus compulsory contributions from government salaries.
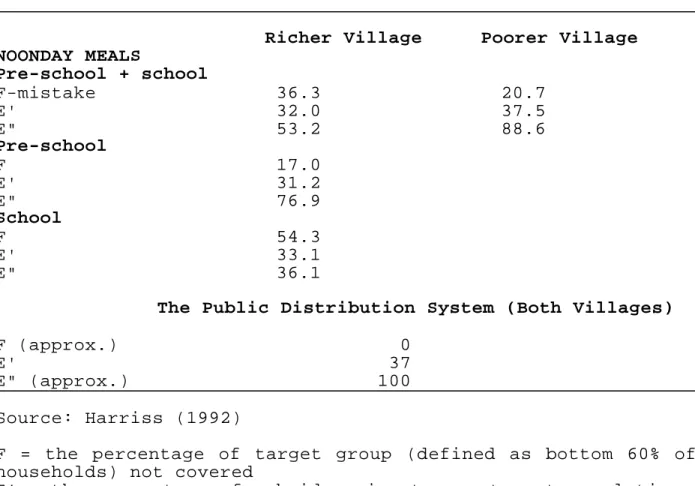
Mistakes: The most detailed evidence is provided by Harriss
(1992) in a study of two villages in North Arcot, a "richer" village and a poorer village. In both villages, the same proportion (over 80%) of the children from higher income groups attend school, but a lower proportion eat at school in the richer village so that the richer village had a lower E-error. In the richer village, significantly fewer children among poor households attend school than in the poor village because of greater employment opportunities (56% compared with 77% in the poor village). Hence the poorer village had a lower F-error. Overall 60 percent of dropouts were female, so that girls suffered proportionately more F-mistakes. In both villages, there was almost universal uptake of pre-school meals (which could be taken home) and therefore high E and low F-errors.
Table 2: E and F-Mistakes in North Arcot (In Percentages)
Richer Village Poorer Village
NOONDAY MEALS
Pre-school + school
F-mistake 36.3 20.7 E' 32.0 37.5 E" 53.2 88.6 Pre-school
F 17.0 E' 31.2 E" 76.9 School
F 54.3 E' 33.1
E" 36.1
The Public Distribution System (Both Villages) F (approx.) 0
E' 37 E" (approx.) 100 Source: Harriss (1992)
F = the percentage of target group (defined as bottom 60% of households) not covered
E' = the percentage of subsidy going to non-target population. E" = the percentage of non-target group covered by subsidy.
In the public distribution system, the ration of subsidized rice per household had more-or-less universal uptake. A more general all-India investigation of the PDS found that it did not - as is often suggested - have an anti-rural or pro-rich bias, but was broadly universally accessible (Mahendra Dev and Suryanarayana, 1991). This implies low F-mistakes, and substantial E-mistakes, but the study did not provide data to permit calculation of E-mistakes on an all-India basis.
(ii) Jamaica
Jamaica abolished general food subsidies in 1984 and replaced them with a more targeted food stamp scheme and school feeding program. Some general food subsidies were reinstated in
1986-88. The general food subsidies were again phased out in 1989 and replaced by increased benefits via the targeted program, but without full replacement in value.
The targeting was to: (i) all pregnant and lactating women; children under five, the elderly; and the handicapped; and (ii) the poor. The benefits were broadly maintained in real terms. Targeting was of two types: self-targeting was achieved though the requirement that children and mothers attend clinics/schools to get benefits; and through income-testing and successful registration.
Table 3: E and F-Mistakes in Jamaica (In percentages)
F E' E"
Poorest 20%a Top 60%a Top 20%a General subsidies very low 66 100
Food stamps 50 43 6 Pregnant and
Lactating women 25 -- 4
Children under five 39 -- 11
The Elderly 45 -- 13
Source: Grosh (1992). a
Data relates to households
Conclusion: As shown in Table 3, E-mistakes were significantly reduced as a result of the switch to targeting from general subsidies, but F-mistakes were sharply increased. The F-mistakes occurred because not all the poor attended clinics, and because registration was required for the means tested food stamps and for the elderly. The F-mistakes were high (about half of all households with malnourished children did NOT receive benefits).
On the basis of the traditional approach (i.e. judging only on the basis of E-mistakes), Grosh (1992) concludes that "the targeting of food stamps is much better than the targeting of
general food subsidies".
(iii) Pakistan
Pakistan had a system of subsidized rations available only from ration shops. This system was removed in 1987 and replaced by a smaller general subsidy on unlimited quantities of wheat, which was intended to be temporary.
The pre-1987 subsidized rations were for an inferior brand of flour and were available much more readily in urban than in rural areas because of the lack of rural ration shops. The budget share of rationed flour was 0.056 for the poorest group and 0.006 for the richest group. There was considerable diversion because the flour subsidy went to wheat released to mills and a large proportion (an estimated 69%) of subsidized wheat did not reach the ration shops.
Table 4: E and F-Mistakes in Pakistana (In Percentages)
RURAL URBAN
Ration scheme:
F 65 50 E' 52b 81c E" 20 21 General subsidy
F 0
E' 78b E" 100 Source: Alderman (1988)
a
Data relate to families; b percentage leakage to the top two-thirds of the population assuming no diversion; c same as in b but assuming a 60 percent diversion.
The general subsidy saved 20 percent of the costs of the ration scheme. Because of lower cost and greater coverage, the rate of subsidy was lower for each recipient.
Conclusions: The ration shop scheme was much worse in terms of F-mistakes. E-mistakes were probably a little smaller in the targeted scheme because of the diversion problem. Administrative costs of the new general scheme were lower than the rationed scheme.
The more targeted subsidy had low political support and therefore was replaced. ("While the concentration of users of the ration system on low-income users achieved a degree of targeting, it also isolated users from a broader political base." (Alderman 1988, p. 251).
(iv) Egypt
Egypt has a generous system of food subsidies with two main elements: a general unrestricted subsidy on coarse and refined flour and bread; and ration cards for other basic commodities. The schemes are very expensive (10 to 15% of total government expenditure in the 1970s and 1980s) and were associated with (and often blamed for - although defence expenditure at 14.4 percent of government expenditure might equally be held responsible) large budget deficits. The International Financial Institutions have devoted considerable efforts to persuading Egypt to move away from the general subsidies to more targeted schemes and some plans in this direction are under consideration.
In contrast to many other countries, Egypt has a good network of rural ration shops, and rural coverage is nearly as good as urban coverage. In the urban areas, the total value of food interventions are considerably greater for the poor than the rich (for whom they are negative because deviations from world prices, resulting from government interventions raise the price of some commodities consumed by the rich), but in the
rural areas the absolute value is somewhat greater for the top income group (see Table 5). However, food interventions are sharply progressive for both, when expressed as a percentage of income, being (based on 1981-2 data) 13 percent of the total expenditure of the bottom (urban) quartile and minus 4 percent of the top in urban areas; and in rural areas, 18 percent of the bottom and 5 percent of the top.
Nutrition: Egypt has better standards of nutrition than might be expected for its per capita income. This is likely to be due to the food subsidies as calorie consumption exhibits a high income elasticity. Alderman and von Braun (1984) calculate that the consumption of poor households is 100 to 200 calories greater per day than it would be in the absence of the interventions.
Mistakes: There is very high uptake of rations in both rural and urban areas (well over 90% of households). In the rural areas, the limited number of bakeries means the bread subsidy is often not accessible and rural consumers rely on the flour subsidy. However, the careful investigation conducted by Alderman and von Braun indicates that for around 12 percent of households, neither bread nor flour was available.
Table 5: E and F-Mistakes in Egypt (In Percentages)a Urban Rural
F-mistakes
Households without 6.9 8.1 ration cards
People without ration 4.5 7.0 cards
Non-availability of subsidized
- bread 21.7 74.7
- bread/flour 2.9 12.2 E-mistakesb
E' - top three-quarters 55.7 75.0
E' - top quarter - 5.2c 22.9
E' (total, R and U)
- top 3/4 69.5
- top 1/4 14.9
Source: calculated from Alderman and von Braun (1984 and 1986).
a
Data relate to households b
Data for calculation of E"-mistakes are not available, but the reasons for failure of comprehensive coverage include (a)head of household working abroad; and (b)not wanting newly weds to claim separate ration cards. Both are likely to be greater among the non-poor so that coverage is probably greater among low-income groups, and the true F-mistakes are likely to be lower than shown above.
c
The value of the subsidy is calculated as the effect on food prices of government interventions compared with world prices.Import restrictions on luxuries lead to a negative value for urban upper income groups.
Conclusions: Egypt's food subsidies show very low F-mistakes, in both rural and urban areas (slightly higher in the rural areas). E-mistakes are large if all subsidies going to the top three-quarters of the income distribution are included. Naturally, they are much lower if one only includes the subsidies going to the top quarter of the population. Targeting - in terms of E-mistakes - would be improved if the subsidy on coarse flour and the basic rations were maintained, while other interventions were abolished. This would reduce the E-mistakes without raising the F-mistakes. As is well established through the bitter resistance to their removal, the food interventions have strong political support.
(v) Sri Lanka
Before 1979, Sri Lanka had a universal rice, wheat and sugar subsidy which provided a minimum of two pounds of rice per week to the whole population at highly subsidized prices. From 1977, a new more market-oriented government reduced and then replaced the subsidies. Entitlement was means tested, and subsequently the subsidy which was administered via ration shops was replaced by food stamps issued to households according to income and number of children. Registration was frozen in 1980. A fixed nominal sum was allocated to the stamps, whose real value declined over time. Changes in June 1986 extended the number of beneficiaries from 6.8 million to 7.2 million, and provided some increases in the value of stamps for children under 12.
Costs: The universal rice subsidy was expensive, amounting to
15 percent of government expenditure in the mid-1970s, whereas by 1984 the cost of food subsidies had dropped to only 3 percent of government expenditure. As a result of the failure to index the value of food stamps, their real value fell severely (by over half per recipient by 1981/2 compared with
the rice rations).
Mistakes: The pre-1979 system ensured virtually complete coverage of the target population at the cost of high E-mistakes. In absolute amounts, per capita receipts were greater among high income groups than low-income groups because they could afford to buy their full ration. But as a percentage of income, the subsidies were much greater for low-income groups. (Per capita subsidies were equivalent to 25 percent of expenditure of the bottom quintile compared to 8.7% of expenditure of the top quintile.) In contrast, the new program reduced E-mistakes, although not as much as had been envisaged as a large number of households whose incomes were above the cutoff line nonetheless secured stamps. But there was a large increase in F-mistakes, so that 30 percent of the bottom quintile were not covered. These mistakes arose from the complexity of the administrative process, and from the fact that from 1980 registration was frozen.
Table 6: E and F-Mistakes in Sri Lankaa (In Percentages)
Pre-1979 rice subsidies
F-mistakes very low E-mistakes
E' (top 80%) 82 E' (top 60%) 62 E" 100 1981/2 food stamps
F-mistakes
(bottom 20%) 29 (bottom 40%) 30 E-mistakes
E' (top 80%) 64 E' (top 60%) 31 E" (top 60%) 34 Source: Edirisinghe (1987), Table 45. a
Nutrition: The change to the targeted food stamp scheme was associated with a significant worsening in nutrition among the bottom 20 percent of the population, who reduced their calorie consumption by 9 percent from 1979 to 1981-2. The next quintile reduced calorie consumption per capita marginally, while all other groups increased their consumption. This worsening is attributed by Edirisinghe (1987) to the loss in income associated with the reduced value of (and reduced access to) food subsidies as a result of the introduction of the scheme. Food subsidies contributed nearly a third of the food budget of the bottom 20 percent in 1978/9; this was reduced to one fifth in 1981/2.
Politics: Politically, there was strong support for the pre-1979 subsidies, as evidenced by organized protest against their removal on several occasions. ("these subsidies continued in part because a remarkably high degree of active political participation by the population, particularly the organized sector of labor force, provided sufficient pressure to ensure that they did." Edirisinghe, p 11) Once the change-over was achieved, it appears that there was much less political support for the new scheme, so that the government was able to reduce the value of the stamps without arousing much opposition (Edirisinghe 1987, 1988).
(vi) Tunisia
Tunisia is a middle income country, and malnutrition is estimated to affect less than 10 percent of the population. Tunisia has general unrestricted food subsidies on cereals, oils, milk and sugar, amounting to 8 percent of government expenditure. High income groups receive three times the absolute amount per capita of low-income groups; nonetheless, the subsidies represent a lower proportion of total income for upper income groups than for lower.
very few subsistence farmers, F-mistakes are non-existent. But E-mistakes are high. E-mistakes are significantly worse for the urban population than the rural, mainly because there are more high income people in urban areas (Yusuf, 1989). As Table 7 shows, there is considerable variation according to commodity, with extremely high E-mistakes on milk (over 90%), and much lower ones for hard wheat than for the other commodities.
Thus E-mistakes could be significantly reduced, while maintaining negligible F-mistakes, by concentrating the subsidy on hard wheat. If the rate of subsidy on hard wheat were increased 2.1 times and the remaining subsidies were abolished, the poorest 35 percent would be as well off while the total cost of the subsidies would be reduced by half. The one doubt about this procedure - which would also save administrative costs - is whether it would be viable politically. There is strong political support for the current subsidies, as indicated by food riots in 1984, when abolition was proposed (Yusuf 1989).
Table 7: E' Mistakes in Tunisiaa (In Percentages) All subsidies
E' - (top 90%) 96 E' - (top 65%) 75 E' - (top half) 65
By commodityc U R Total Commodity composition of
subsidiesb
All Groups Lower Income
groupsd
Milk 93.1 74.3 91.4 3.2 1.6 Soft wheat 87.5 60.8 81.1 29.5 21.9 Sugar 89.0 55.3 74.9 14.4 13.8 Oil 87.6 52.1 72.1 6.2 12.2 Hard wheat 83.5 52.4 64.8 32.2 44.6
Source: calculated from Yusuf (1989), Table 10. a
Data relates to households. b
There are also subsidies on meat, eggs, soap and school supplies, so total does not add to 100.
c
Refers to the top 65% of households. d
Refers to the bottom 35% of households.
(vii) Mexico
Mexico is replacing general subsidies on maize and maize flour to urban tortilla manufacturers, with targeted subsidies on tortillas and milk, (means tested using complex administrative procedures) for the urban poor, and the establishment of rural shops to provide subsidized maize flour.
As can be seen from table 8, all the programs, both general subsidies and targeted ones, had very high F-mistakes. In the case of the general subsidies this arose from failure to cover the rural poor who accounted for approximately 54 percent of total poor families, although complete coverage of the urban poor was achieved. The switch to targeting did not reduce E-mistakes, although this had been the main intention of the change.
Table 8: E and F-Mistakes in Mexico (In Percentages)
Urban Rural Total General subsidies on maize:
F- mistake very low 100 54
E'-mistake (top 3-deciles) 39 0
Targeted subsidies: (a) Tortilla F - poor familiesa 73 100 88
F - poor pregnant/lactating 75 100 90
women; children, 0 -12 E'- "better-off" 40 0
(b) Urban milk program F - poor familiesa 56 99 89
F - pregnant/lactating women 52 99 83
children (poor households) E'- "better-off" 40 0
(c) Rural community stores F - poor familiesa 100 6 49
F - pregnant/lactating women 100 7 61
children < 5 (poor) E' - (non-poor ) 0 46
(d) Food supplementation F - poor familiesa 76 84 81
F - pregnant/lactating 60
children < 5 (poor) F - children 5 - 12 88
Magnitude of programs: Total $m.p.a. Per beneficiary household $ p.a. General subsidies 1,652 151
Targeted subsidies: (a) Tortilla 98 91
(b) Urban milk prog. 193 106
(c) Rural comm. stores 51 9
(d) Food suppl. 191 190 Source: World Bank (1991)
a
The best targeted program from the perspective of Fmistakes -the rural community stores - also had -the least spent on it, and the benefit per recipient was very small (World Bank, 1991).
(viii) The Philippines
In the Philippines a subsidized food ration scheme was introduced - on a pilot basis - for each household in a few villages. This had very high uptake (95% after three months). Because most villagers were poor both E and F-mistakes were very low in the villages covered, but since the scheme was confined to only a few villages, F-mistakes outside the chosen villages were clearly very high - poverty rates in the Philippines being of the order of 50-60 percent during the 1980s with a high incidence in both rural and urban areas. However, while this is to be expected with a pilot scheme, it does illustrate a common problem associated with geographic targeting - viz. omission of the poor outside the area covered by the scheme.
Table 9: E' and F-Mistakes in The Philippines Pilot Scheme (In Percentages)
% F-mistake (in villages 5 covered after three months)
E' (those with > 80% of recomm. 8.8 calories)
Source: Garcia and Pinstrup-Andersen (1987)
MAJOR CONCLUSIONS FROM THE STUDIES
1. F-mistakes tend to be low with universal subsidies if they are unrestricted, and usually if they are rationed, if
every household is entitled to rations. But where they are rationed, it is essential that the ration shops be widely accessible. In some countries, lack of ration shops in the rural areas has significantly raised F-mistakes - as in the Pakistan case above. But in others, such as in Sri Lanka and Egypt, the ration/subsidy shops were generally accessible and F-mistakes were low.
2. The universal schemes tend to involve significant E-mistakes, varying from 78 percent (Pakistan) to 31 percent (Sri Lanka), where an E-mistake is defined as the proportion of benefits that go to those outside the target group. The magnitude of the E-mistakes depends on:
- (a) The level of income. If average incomes are low so that a high proportion of the population falls into the "target" group, the maximum level of E-mistakes associated with universal schemes is limited. This was the case in the villages in North Arcot, where the public distribution scheme showed E-mistakes of only 37 percent, and the E-mistake for school meals and pre-school feeding ranged from 32 to 38 percent. In contrast, where the target population forms only a small proportion of the total, then E-mistakes can be very high, as in Tunisia.
- (b) Consumption patterns among different income groups. If consumption patterns are similar among income groups, then any universal subsidy on a basic commodity is likely to benefit rich as well as poor groups - as with rice in Sri Lanka. But if "poor people's commodities" can be identified, e.g. hard wheat in Tunisia, then lesser E-mistakes will be associated with universal subsidies.
- (c) How narrowly the target group is defined. If the target group is confined to the severely malnourished, or to particular age-groups, then E-mistakes will be higher than if the target group also includes the moderately malnourished and
extends to all ages. There is a case for differentiating E-mistakes according to the income of the beneficiaries. For example, benefits that reach members of the bottom half of the income distribution who do not fall into the "target" population are less serious, given a pro-egalitarian utility function, than errors involving benefits going to the top half of the income distribution.
- (d) The nature of the subsidy. We have used the term "universal" subsidies, distinguishing these from "targeted" subsidies. Yet all universal subsidies contain elements of implicit targeting, since their distribution depends on the commodities subsidized and the consumption patterns of different income groups. If the subsidies fall most heavily on poor people's goods, then E-mistakes will be less than if they fall on luxuries. The contrast between the Egyptian case, where the subsidies were mainly on poor people's goods, and the Tunisian case, where a high proportion fell on luxuries illustrates this point: in Egypt, the top three-quarters of the urban population received 56 percent of the subsidies, while in Tunisia the top 65 percent (urban) received 88 percent.
3. Universal unrestricted subsidies can sometimes confer much larger absolute benefits on richer than poorer groups, since the richer groups can afford to consume more. But they may be designed to avoid this. In Egypt richer groups in the urban areas received much less than poorer groups, while for the country as a whole there was little difference. In contrast, in Tunisia the value of the subsidies received per head in the top 10 percent of the population was 3.7 times that received by the bottom 10 percent. But even where they appear highly regressive - as in Tunisia - they offer much greater benefits to poorer groups as a proportion of income: in Tunisia the difference in per capita income between top and
bottom groups was at least 8:1. Consequently, assuming that they are financed by taxes which are proportionate to income, they should improve secondary income distribution. In countries such as Egypt where they are designed more progressively, they greatly improve secondary income distribution.
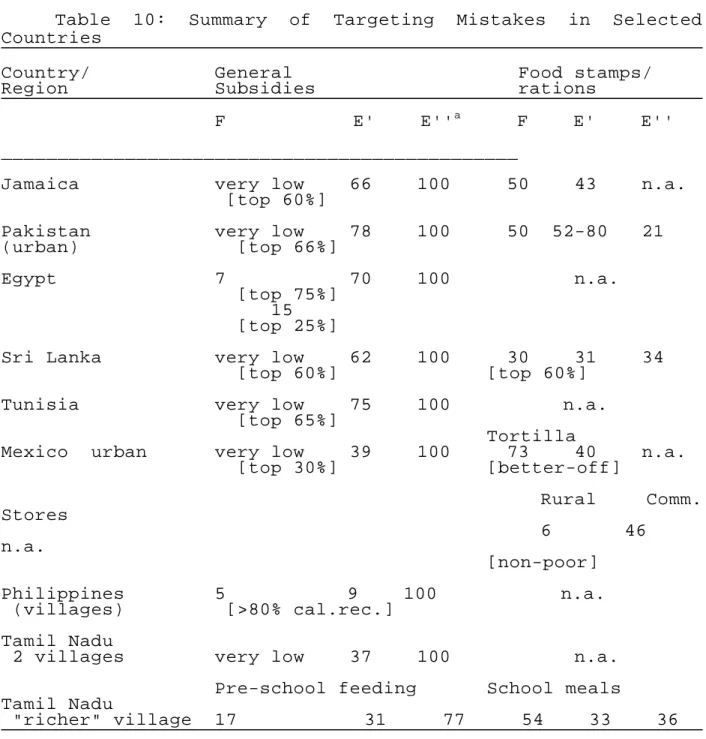
4. In a number of countries targeted schemes have replaced universal schemes. In almost every case, as indicated in Table 10, the result has been a major increase in F-mistakes with some reduction in E-mistakes. In Jamaica F-mistakes rose from almost nothing to as much as 50 percent; in Sri Lanka from very low to 30 percent; in Pakistan (where the reverse process occurred) they fell from 65 percent (rural) and 50 percent (urban) to near zero. The reduction in E-mistakes was usually substantial, but generally not as complete as had been expected as non-target groups managed to secure some of the targeted benefits - e.g. in Sri Lanka the top four-fifths' share dropped from 84 percent to 62 percent and the share of the top three-fifths of the income distribution from 60 to 30 percent; but in Pakistan, diversion of the targeted rations meant there was little difference in E-mistakes between the two schemes.
5. At best, when there was a switch from a general to a targeted subsidy, the real value of the benefits to those who received them was unchanged, but this was unusual. Mostly, it seems that the switch also leads to a reduction in the real value of the subsidy over time (as in Sri Lanka). Less strong political support for the targeted schemes probably accounts for this. Sometimes, a reduction in the real value of the subsidy was intended as part of a cost cutting exercise.
6. The one study of school meals as a mechanism of nutritional support indicates that large numbers of poor
children can be excluded, if they do not attend school because they are working. School meals would tend to discourage non-attendance (see Babu and Arne Hallam 1989 for an analysis), but as Harriss (1992) shows, significant F-mistakes may still occur. Pre-school feeding does not have this problem.
7. Administrative costs are estimated to be higher for the targeted food interventions, ranging from 2 to 5 percent of the total costs of the schemes. (The Sri Lankan scheme is estimated to cost 2 percent and the Jamaican scheme 4 percent of total costs). Evidence for the UK and US supports this conclusion. In seven UK programs, administrative costs were estimated at around 3.5 percent of universal programs but between 5 and 15 percent of means tested programs, while in the US administrative costs of universal programs were found to be 2.5 percent compared with 12 percent for two means tested programs (and 95% for the means tested veterans program) (Kesselman, 1982). The administrative costs of non-food schemes such as employment or credit schemes tend to be significantly higher than food subsidy schemes, but they also generate other benefits.
8. The political support for general schemes which reach some of the non-poor (i.e. have significant E-mistakes) appears to be higher than that for the more narrowly targeted schemes, according to the evidence reported here. For this reason the value of targeted subsidies is more likely to be eroded over time, as observed in the case of Sri Lanka.
9. Policy conclusions based on this survey about how to avoid excessive F and E-mistakes are:
a) Subsidies or other interventions must reach the rural areas. if they do not, as is quite common, then high
F-mistakes are unavoidable.
b) Universal subsidies on staple commodities are most effective in reaching the whole target population in very low-income countries and/or areas where the majority of the population are poor and malnourished. The exception is where there is a high degree of malnutrition among a subsistence population (as in Peru-- see Harrell et al. 1989). Other mechanisms will be needed to reach the subsistence population.
c) Targeting food interventions will "save" more resources than general food subsidies in middle income countries, where malnutrition is fairly low. But in these contexts, targeting by commodity/geography can often (as in Tunisia) greatly reduce E-mistakes, without increasing F-mistakes, whereas targeting by income tends to involve high F-mistakes with little reduction in E-mistakes.
d) Even where universal food subsidies are apparently regressive, with the well-off receiving a higher share of the subsidies than their share of the population warrants, they are usually progressive compared with the distribution of original income, and also confer real benefits on the poor in absolute terms. Consequently, policy-makers who wish to improve income distribution and reduce poverty should not abolish food subsidies without providing substitute interventions which are at least as effective in conferring benefits on the poor (taking into account potential F-mistakes).
Table 10: Summary of Targeting Mistakes in Selected Countries
Country/ General Food stamps/ Region Subsidies rations
F E' E''a F E' E''
______________________________________________
Jamaica very low 66 100 50 43 n.a. [top 60%]
Pakistan very low 78 100 50 52-80 21 (urban) [top 66%]
Egypt 7 70 100 n.a. [top 75%]
15 [top 25%]
Sri Lanka very low 62 100 30 31 34 [top 60%] [top 60%]
Tunisia very low 75 100 n.a. [top 65%]
Tortilla
Mexico urban very low 39 100 73 40 n.a. [top 30%] [better-off]
Rural Comm. Stores
6 46 n.a.
[non-poor]
Philippines 5 9 100 n.a. (villages) [>80% cal.rec.]
Tamil Nadu
2 villages very low 37 100 n.a. Pre-school feeding School meals Tamil Nadu
"richer" village 17 31 77 54 33 36 Source: see Tables 2-9.
a
E'' mistakes are assumed to be 100%, and F-mistakes to be very low for the universal subsidies. In fact some people from both rich and poor households are likely to be omitted for various reasons, so E" may be less than 100%, and F positive but low. Precise data are not normally available.
IV. THE DISTRIBUTION OF FOOD SUBSIDIES WITHIN HOUSEHOLDS: ANOTHER POTENTIAL SOURCE OF ERROR
Most individuals - and nearly all children - live in households. The way households function - particularly in relation to the allocation of food - therefore mediates between any outside intervention and individual food consumption. This is so whether the intervention is direct (feeding schemes) or indirect (food subsidies, works schemes) because the household can reallocate the resources over which it has discretion to offset the effects of the intervention if it wishes.
Household decisions concerning food can be thought of as a two-stage process (although the two stages may be decided simultaneously):
1. How much of total household income is to be allocated to food;
2. How food is to be distributed within the household.
If the aim of a food intervention is simply to raise the incomes of poor households, leaving them to decide on allocation and distribution, then we need only be concerned with whether the intervention does raise the incomes of poor households. This was the assumption about objectives made earlier in the paper. But if the objective is to improve the nutrition of particular categories of people within poor households (e.g. children), then we need also to consider the issues of allocation and distribution.
Different models of how households function lead to different conclusions on the links between food interventions, food consumption, and family food distribution. The main contrast
is between the neoclassical model and bargaining models of the household. The neoclassical model assumes joint utility maximization (e.g. through a benevolent dictator at the household's head), in which decisions on allocation and distribution are taken with "family" utility maximization as the objective (see Becker, 1981; Rosenzweig, 1986). In contrast, bargaining models assume differences in objectives within the household, with allocation and distribution being the outcome of the bargaining strength of the various individuals (or bargaining groups) within the family (Manser and Brown, 1980; McElroy and Horney, 1981; Folbre, 1984, 1986).
The two model types can lead to important differences in conclusions on the effects of food interventions:
The Neoclassical model
According to the joint-utility maximization model, since "all resources are essentially pooled and reallocated to individuals, it does not make any difference to whom subsidies are given, or, for the most part, whether such subsidies are in cash or kind" (Rosenzweig, p 235, 1986). Unless direct feeding of target groups exceeds their total pre-intervention consumption (unlikely except in special intensive programs),this will be no more effective in raising their food consumption than a general increase in household income of the same magnitude, since the rational neoclassical family will reallocate their resources to achieve the efficient utility-maximizing optimum.
In the neoclassical model, the family is a complex maximizing entity, adjusting its work and consumption margins to achieve utility maximization, and an intervention may therefore affect the level and distribution of food consumption through a
general equilibrium process, which incorporates the productivity effects of food consumption of particular individuals. For example: - increased male wages would increase family food consumption, as a result of an income effect, and might increase the consumption share going to male members so as to permit higher male workforce participation. Similarly, increased female wages or employment opportunities might increase total food consumption and the female share. - the share of children in household food consumption might be affected by changes in their current and future earnings stream, if this were related to their current nutrition.
- general food subsidies would increase household food consumption as a result of both income and substitution effects, but it would normally not affect distribution within the family.
Bargaining models
These may subsume the neoclassical distributional effects arising from the general equilibrium process just noted, but they also include bargaining effects of food interventions. Various bargaining groups have been distinguished as leading to different outcomes. Most common is the male/female distinction; another distinction is generational. In these models, the distribution of family food resources depends in part on the bargaining strength of the various categories. Taking the male/female divide, this means that female consumption will vary positively not only with household income, but also with female control over family income (e.g. from outside earnings).
In this context, children may be treated in a variety of ways: - Bi: as being in the bargaining groups of their mother; - Bii: as being in the bargaining groups of their same sex
- Biii: as forming bargaining groups of their own.
In the first type (Bi) , children will fare better if mothers receive income directly (through their own earnings,or subsidies they receive) or if the food support goes directly to them (direct feeding schemes), than if the extra income goes to raise household income via male earnings.
In the second type (Bii), female children will fare better where extra income/subsidies are directed at the mothers, or at them themselves, while boys will benefit from extra male incomes.
In the third type (Biii), food interventions have most effect when directed at children themselves; child nutrition would also benefit from extra child earnings.
What is the reality?
Empirical research is at a very early stage in this area. Moreover, the observed facts are often consistent with more than one model, while one can never directly observe objective functions (Folbre,1986). But both facts and intuition lend support to the view that no single one of the models is a correct representation of reality, but aspects of each are present - to a varying extent in different contexts.
As far as the neoclassical model is concerned, the altruistic view of the family may contain some (Darwinian) truth but evidence suggests it does not tell the whole story, as it is inconsistent with observed inequalities, especially between men and women. Inequalities in relation to recommended calorie needs have been widely observed in Asia, for example, in Bangladesh, India and the Philippines (results quoted in Haaga and Mason, 1987; Folbre, 1986; Chen et al., 1981); but
such inequalities have not been evident in Africa (Deaton, 1987; Svedberg, 1990). Although neoclassicists have suggested that this inequality is consistent with joint family utility maximization because of the greater earning capacity of males, this does not appear sufficient to explain the whole discrepancy in Asia, and Behrman and Kenan have suggested there exists a "pro-male bias" over and above investment considerations.
As for the bargaining models, there is substantial evidence showing that basic needs consumption rises as a proportion of family income, and child nutrition improves, as the female bargaining position is strengthened, as indicated by greater female earnings or improved female education (see e.g. Guyer, 1980; Miller, 1981; Tripp, 1981; Sahn, 1990; Hoddinott and Haddad, 1991). This supports version Bi of the bargaining model. But while child nutrition in general improves with an improved position of mothers in the family, there is some evidence that that of girls rises most (e.g. in the Philippines, Villasenor, 1982), lending some support to version Bii. Finally, there is some evidence that girls' nutrition improves as their actual or potential wages rise (Villasenor, op. cit.) and that boys' nutrition rises with their earnings (Harriss 1992) giving some credence to the third model Biii.
Given this rather confused situation concerning which model of the household is correct, what conclusions can we draw for the effectiveness of alternate food interventions?
1. In so far as the poor family as a whole is the target group, any intervention which increases the household income of poor families will be satisfactory.
2. If improved nutrition (of the whole family) is the objective, general food subsidies are preferable to other
mechanisms for transferring income because of the substitution effect. Mechanisms which transfer income to women are also more effective than general increases in income because of the greater propensity of women to spend the extra resources they control on food.
3. If a subset of the family is the target (women or children), then there is enough evidence supporting bargaining-type models to suggest that mechanisms which increase women's and/or children's control over resources will be preferable to those which increase male incomes. Mechanisms which should therefore be favored include:
- increasing female wages, employment and credit; - subsidies paid directly to women;
- direct feeding schemes (pre-school and school meals)
- mechanisms which increase child incomes would also be effective, but most forms of child labor are undesirable for other reasons.
In terms of our earlier framework, unravelling the household suggests a new source of E- and F-mistakes within the household. These were largely ignored in the earlier discussion. Assuming the target population is a subcategory within poor households, both E and F-mistakes are likely to be more serious than shown in the earlier data, which treated the whole family as the target. E-mistakes inevitably arise as non-target family members share in additional consumption. F-errors arise if the real target group does not receive extra consumption. But most evidence shows that child food consumption and nutrition rises with family income, so that children are not left out as income rises (see e.g Villasenor). Thus F-mistakes may not be that much larger than suggested in the earlier estimates, though the target group may not benefit to the maximum extent possible.
V. VALUING THE E AND F-MISTAKES
Given an initial distribution of food-deficient (or poor) households, the standard theoretical approach to comparing the relative efficiency of alternative food interventions (aiming at removing such food deficiency, and characterized by different delivery mechanisms and degrees of targeting) is based on the minimization of a given objective function. One of the following approaches is usually adopted (Besley and Kanbur 1987; Chaudhuri and Ravallion 1993):
a) minimization of the mistargeting (or misclassification) ratio i.e. of the sum of normalized value of the off-diagonal elements of the classification matrix presented in Table 1. Thus, the food intervention selected will be the one with the lowest value of this ratio.
b) minimization of a poverty index (by means of a given government expenditure which does not vary from one type of food-intervention to another). The poverty head count ratio, the average poverty gap ratio, or a distributionally sensitive measure of the Foster-Greer-Thorbecke class (such as the mean squared proportionate poverty gap) are the most commonly used indices. The latter index is, in general, superior to the first two and to that illustrated in a) as it reflects whether the alternative food interventions have been able to reach, on a priority basis, the poorest (or most food-deficient) households among all the poor (or food-deficient) ones.
These (as well as other) approaches have different properties and limitations and often operate under fairly restrictive assumptions. While the minimization of the misclassification ratio provides an intuitive, and easily computable, way of ranking alternative food interventions, such an approach is
not very sensitive in situations where the extent of poverty (or food deficiency) among the poor varies considerably. Furthermore, such an approach implicitly assumes that the elements above and below the diagonal in the classification matrix (referred to in this paper as E-mistakes and F-mistakes, or type-I and type-II errors in the literature in this field) must both be given weights equal to 1. In contrast, approach b) - while preferable on theoretical grounds - has formidable informational requirements and assumes real-life approaches in the delivery of food interventions which are rarely, if ever, followed.
Even this simpler approach a), however, while neither new nor controversial from a theoretical perspective, is seldom followed in applied research, as information on F-mistakes is not routinely available. For this reason, while F-mistakes are normally acknowledged, the most common approach adopted by the empirical analyses in this field focuses only on the minimization of E-mistakes (see for instance, Mateus 1983 and Pinstrup-Andersen 1988).
Data limitations inherent to the food interventions discussed in Section III do not allow us to follow approach b). In this section, therefore, we attempt to rank the efficiency of food interventions on the basis of the first approach (which entails the measurement of both E-mistakes and F-mistakes). The attempt to do so is subject to the usual problems facing any evaluation - i.e. an assessment of the value to be placed on the benefits received by different groups, the choice of weights to be attributed to E-mistakes and F-mistakes, and also the counterfactual problem. Nonetheless, we believe that even this relatively simple approach is worthwhile , as it indicates how the ranking of food interventions assessed on the basis of the E-mistakes only can change when F-mistakes
are incorporated into the evaluation.
(i) Measuring the total E+F mistake as the weighted sum of all individuals "mistargeted"
Let the errors to be minimized consist in [aNPc + bPnc]/N, where a is the weight to be given to E-mistakes and b the weight given to F-mistakes. Implicit in the usual approach is the assumption that a is equal to 1, and b= 0. In contrast, we believe in general b>a because the failure of a nutrition intervention to reach the target population is more serious, being a failure to achieve the basic objectives of the intervention, than is leakage to the non-target group which raises the cost of the intervention but does not affect the achievement of its basic objective.
A critical issue, therefore, is the value of a and b. Relevant considerations in arriving at some system of weighting are: - (i) the costs of E-mistakes; these would be less if there is not a major budgetary problem (e.g. in a revenue rich country such as Botswana or Saudi Arabia), or if the tax system can be used to claw-back E-mistakes (to be discussed in Section VI.) In either of these cases a<1;
- (ii) how damaging F-mistakes are, which includes both the welfare costs and the efficiency costs of not covering the target population.
At this stage we simply illustrate how the ordering of schemes changes, as valuation of the errors varies. This is shown in Table 11 which values the added up errors in four ways:
Table 11: A comparison of the efficiency of alternative interventions on the basis of alternative measurements of the targeting mistakes
Mistakes/weighting E only F only
E + F [a=b=1]
E + 3F [a=1, b= 3]
Measure adopted NPc/N Pnc/N (NPc+Pnc)/N (NPc+3Pnc)/ N
Sri Lanka1
General subsidy 0.60 0 0.60 0.60
Food Stamps 0.20 0.12 0.32 0.56
Jamaica2
General subsidy 0.20 0 0.20 0.20
Food stamps 0.12 0.10 0.22 0.42
Pakistan1
General subsidy 0.60 0 0.60 0.60
Food rations 0.124 0.243 0.36 0.84 Tamil Nadu [richer village]5
General subsidy 0.39 0 0.39 0.39
School meals 0.14 0.32 0.46 1.10
Pre-school meals 0.30 0.12 0.42 0.66 Source: See Tables 6, 3, 4 and 2.
1
Poor and non-poor: bottom 40% and top 60% of the population; 2
Poor and non-poor: bottom 20% and top 20% of the population; 3
Assuming 40% of the poor are covered; 4
Estimate; 5
Poor and non-poor are defined as the bottom 3 classes and top 3 classes.
(i) E-mistakes only; (ii) F-mistakes only; (iii) giving both E and F-mistakes equal weights of 1; and (iv) assigning (arbitrarily) F-mistakes a weight three times that of E-mistakes (b/a = 3). General subsidies are invariably inferior to targeted schemes considering only E-mistakes (which here may have been exaggerated, as it is assumed that 100 percent of upper income groups are covered). If F-mistakes, only, are
considered, then general subsidies are invariably superior to targeted schemes in the examples considered. When both are incorporated, the outcome depends on the proportion of the population who are in or outside the target group, the magnitude of errors of omission and commission and the relative weight given to the two. For example, in Pakistan the targeted scheme is superior to the general subsidies if the two errors are given equal weight, but the general subsidies are superior when the F-mistakes are weighted at three times E-mistakes. For Jamaica, if only the top 20 percent are regarded as causing E-mistakes, the general subsidy is superior if E- and F-errors are weighted equally (but this would change if one extended E-mistakes to a wider section of the population).
(ii) Measuring the total E + F mistake as the sum of the program leakage, welfare cost and future foregone income due to mistargeting
The discussion above has illustrated how the introduction of F-mistakes and the weighting of E- and F-mistakes according to given welfare weights could alter the ranking of food interventions. Such discussion, however, gives no justification for selecting any particular weighting of the two errors on both welfare and efficiency grounds. In this section we discuss therefore considerations relevant to the evaluation of E- and F-mistakes also on efficiency grounds.
E-mistakes are valued here in the usual way, i.e. as the leakage (L) of financial resources to non-target groups3 NPc. In the valuation of F-mistakes instead it is important to differentiate two distinct elements - the immediate welfare
3The efficiency cost of the leakage to the economy (in terms of reduced labor supply and incentives) could also be added but it is not considered in this chapter.
cost (W) and the present value of the future income foregone (Y*) because of the failure to reach some poor households, Pnc, with the intervention.
Also in this case, the food interventions to be selected are those which minimize the objective function (E- + F-mistakes), where E-mistakes are a function of NPc and F-mistakes a function of Pnc. Unlike in the approach described beforehand, however, their weights are represented by monetary parameters related to the dollar value of the leakage and of the income foregone. We are thus adopting a type of cost-minimization approach, taking the objective of the food interventions as given and focusing on cost-minimization interpreted in a broad sense.4
(iii) Valuing the present value of the foregone income (Y*)
To assess the value of the foregone income the discussion which follows focuses on three important relations:
(a) between adult nutrition and short-term labor productivity (b) between growth retardation at an early age, I.Q. scores,
school achievements and long-term labor productivity
(c) between maternal malnutrition, low-birth weight (LWB) incidence among female infants, and their reproductive
4 Valuation of W will depend on how the income of different groups is valued; the welfare costs are likely to depend on how badly off those not covered are. From this perspective, F-mistakes should be valued more when they relate to the ultra-poor, rather than the poor, and it would be desirable to have two types of F-mistake, relating to this distinction. But our present data does not allow us to pursue this. Another approach is to adopt equity weights and value F-mistakes
according to society's valuation of income going to the target group as against other groups. Thus an Atkinson utility index could be adopted, where the income of a particular group is valued as,
W(y) = 1 y1-e 1-e
However, we do not have the detailed information necessary to estimate the value of the welfare costs of F-mistakes using this approach, nor do we know the value of e.
efficiency during their adult life.
1. Adult nutrition and labour productivity
Two types of evidence on this relation are presented in a fairly large body of experimental and non-experimental studies on the relationships between calorie intake (or body-mass) and labour productivity and between micronutrient deficiency and labour productivity. The experimental studies reviewed (Borzok 1945; Kraut and Muller 1946; Keys et al. 1959; Basta et al.; Wolgemuth et al. 1982; Viteri et al. 1975; Strauss 1986; Deolalikar 1988; Shan and Alderman quoted in Strauss and Thomas 1989) usually provide more accurate estimates of productivity increases as they are better able to control for simultaneity, sample attrition, non-observed household decisions affecting nutrition, and random assignment of the individuals included in the test, although they may be subject to the "Hawthorne" effect (i.e. that taking part in an experiment can affect behavior). The results of non-experimental studies considered (Belavady 1966; Satyanarayana et al. 1977; Immink et al. 1984; as well as Horton and King 1981; Scrimshaw 1986, McGuire and Austin 1987 for a review of the literature in this field) should be interpreted more carefully as they are often affected by unknown estimation biases due to these problems.
While the caveats just mentioned should be born in mind, from our review it appears that:
- Calorie intake and micronutrient supplementation (with iron, vitamin A and iodine) are clearly correlated with the labor productivity of manual workers. These relations are mediated by improuvements in muscle strenght, precision of mouvement and work endurance and by a decline in the risk of
morbidity and absenteeism.
- Body-mass is also significantly related to labour productivity. Shorter people with a history of chronic undernutrition since childhood have lower muscle mass and -ceteris paribus - a lower aerobic capacity. The latter has been found to influence labour productivity among agricultural, construction and other manual workers in several developed and developing countries (McGuire and Austin 1987).
- The relation between calorie intake, micronutrient supplementation and body-mass vis-à-vis labour productivity is strongest for micronutrients and less intense (but still clear and statistically significant) for calorie intake and body-mass. The effects of calorie intake and body size are often inseparable though they reflect the influence of two different factors, i.e. the current level of nutrition and long-term stunting.
- The relation between nutrition and productivity is more pronounced for workers at low levels of intake (i.e. 1500-2000 calories or with very low level of haemoglobin), as clearly shown by Strauss (1986) and Basta et al.(1979). It is also positive and significant, but with lower elasticities for workers in the 2000-3500 calorie range or who are mildly anaemic. The effect of calorie or micronutrient supplementation is nil (or even negative) in workers consuming more than 4000-4500 calories/day, affected by obesity or with adequate levels of haemoglobin (Strauss op. cit.; Basta et al. op. cit.; Satanarayana et al. 1977).
- Changes in nutritional status may not affect productivity in the short term (as found by Belavady), as limited and
gradual declines/increases in intake might be accommodated by an adaptation of the basal metabolic rate (Schrimshaw, 1986).
- With the exception of the Kraut/Muller and Belavady results, (who found exceptionally high and exceptionally low elasticities) providing an additional calorie supplement of 800-1000 calories per day to manual workers with low-levels of intake may result in an increase in actual consumption of 500-600 calories, which is in turn likely to be associated with a productivity increase in the range of 20 to 30 percent. If the intake is equal to the supplementation provided, the increase in productivity would range in the 30-40 percent bracket (Table 12).
Assuming that the yearly productivity of low-income workers in poor, developing countries is in the 300-500 US$ per capita
bracket, the gains associated with an increase in calorie intake
Table 12: ESTIMATES OF THE ELASTICITY OF THE NUTRITION-PRODUCTIVITY RELATION Elasticity of
Initial Level Incre
a s e
Productivity Gains Wages
v s Calori
es
Labor Productivity vs
Study (kilocalories)a (%) Calori
es
Weightfor -height Kraut and Muller (1946)
Railway workers Mineworkers Mineworkers Steelworkers 2,400 2,800 3,200 --600 400 400 400 47 37 7 22 --1.80 2.60 0.56
--Keys et al. (1950) 3,500 -2,000 -30b -- -- 0.52
Wolgemuth et al. (1982) 2,000 500 12.5 -- 0.50
--Strauss (1986) 3,000
3,000 3,750 -1,500 1,500 750 -40 17 --0.66 0.34 0.12
--Viteri et al. (1975) 2,800 350 0.2c -- --
--Deolalikar (1988) Calorie Weight/height --0.2 --2.0
Sahn and Alderman (1988) -- -- -- 0.2 --
--Satyanarayana et al. (1977) 45a
45a 10a 15a --0.58 0.81
--Belavady (1966) 2,400 600 0 -- 0
--Source: Compiled by the authors. a
Except for "Satyanarayana et al. (1977)", which is in kilogrammes. b
Refers to muscle strength, not to labor productivity. c
Tonnes of additional sugarcane cut.
could be roughly assessed to be in the range of 60 to 200 US$ per capita/year. This figure compares favorably with the cost of a food subsidy program (or of similar child feeding or school lunches programs) which is currently estimated at around 30 US$/per year per 1000 calories effectively transferred per day (World Bank, 1989; Kennedy and Alderman, 1987).
2. Malnutrition, growth retardation at an early age and
Malnutrition at an early age, caused by dietary deficiency, infection or lack of sensory stimulation, leads to severe
impairment of cognitive capacity and to stunting. There are essentially three mechanisms through which different forms of malnutrition in infancy and childhood affect labor productivity in adulthood:
- persistent Protein Energy Malnutrition (PEM) in infancy and childhood leads to long-term stunting and lower aerobic capacity in adult life (already discussed above);
- severe malnutrition at an early age (before 5) affects I.Q., later learning ability (both directly and through the amount of schooling, which also depends on I.Q.), skill acquisition and future productivity;
- undernourishment and iron deficiency in school children affect attention span, learning ability and school achievement and, through these, skill acquisition and future productivity.
The literature in these three areas is substantial, though there are no known well-controlled longitudinal studies to estimate the intensity of these relations. In addition, also in this case, part of the variability of the results depends on the inability to control for interfering and non-observed variables - such as the time of the onset of malnutrition, its severity and type and the living conditions of the children in the control group - or on the inability to standardize them adequately. Despite these drawbacks, the relevant literature shows that:
affects negatively intelligence tests and school scores during school life. These findings were confirmed in ten out of the thirteen studies surveyed by Pollitt (1984).
- The extent of the cognitive deficit among school age children is associated with the severity and duration of the nutritional deficit at an early age. In most studies the cognitive deficit during school age was equal to 10-15 percent of the average of the control group, though it varied between an upper limit of 25 I.Q. points (i.e. roughly 30 percent of the mean) in the case of malnourished South African children (Galler et al, 1983) and only a few points in the case of equally severely malnourished Korean children (Winnick et al, 1979).
- In the absence of longitudinal studies, the loss of future income due to malnutrition in childhood can best be estimated by combining the existing evidence on the relation between child malnutrition, learning ability and amount of schooling completed with that on the relation between levels of schooling and earnings. A well-known study using data on differential I.Q. scores of normal and undernourished Chilean children and differential earnings of construction workers ranked by I.Q. levels (Selowsky and Taylor, 1973) showed that providing nutritional supplements during the first two years of life to the 25000 or so children becoming malnourished in Chile every year would generate benefits equal to six times the cost of the intervention.
Similarly, a reduction in the gap between the ability scores of low- and high-income children in Cali, Colombia, due to a health-nutritional programme, increased the total value of their lifetime earnings by between 2.5 and 4.6 times the
yearly wage of an illiterate worker5 (depending on the years of schooling completed) in the case of an increase in I.Q. equal to one standard deviation, and to between 5.6 and 8.9 yearly wages in the case of an increase in I.Q. equal to two standard deviations (Selowsky 1981).
- The current nutritional intake of school children clearly affects their academic achievements. In a review of five studies on Singapore, Indonesia, the U.S. and the Philippines, Pollitt (1984) concludes "it must be recognized that most studies reviewed concur in suggesting that the nutritional status of the student is a variable that determines in part educational performance" (p.21). The Indonesian study, for instance, found that anemic children had lower school scores than non-anemic children.
3. Intergenerational effects: malnutrition among mothers and
reproductive efficiency
Perhaps the most negative and most often overlooked effect of maternal malnutrition on female infants is that on their reproductive efficiency during adult life. In recent studies (Hackman et al, 1983) a positive relation has been found between LBW and poor nutrition in the mother's childhood and her later bearing of LBW infants or of infants with birth defects. In this way, maternal malnutrition has a high probability of being passed on to at least the two successive generations (Martorell and Gonzalez Cossio, 1987), and thus, of affecting physical growth, learning ability and the expected earnings of future generations. However,
5Selowsky notes that in the early mid-70s, the wage of an illiterate worker in six developing countries varied between 40 per cent and 95 per cent of the GDP/capita. Only in one case it was above it.

![Preparation of monolayers of [MnIII6CrIII]3+ single molecule magnets on HOPG, mica and silicon surfaces and characterization by means of non contact AFM](data:image/gif;base64,R0lGODlhAQABAIAAAP///wAAACH5BAEAAAAALAAAAAABAAEAAAICRAEAOw==)