BASELINE SURVEY OF
MICROLOAN FOUNDATION AND
MICROVENTURES
PROGRAMS
September, 2008
ZERO DRAFT
ACKNOWLEDGEMENTS ...4 LIST OF TABLES...5 LIST OF FIGURES...6 ACRONYMS...7 EXECUTIVE SUMMARY ...8 1.2. Survey Objectives...9
2.0. METHODOLOGY AND APPROACH...10
2.1. Survey Design...10
2.2. Sampling Design ...10
2.2.1. Micro-ventures Program...11
2.2.2. Micro-loan Foundation ...11
2.2.3. Combined Total Sample for MV and MLF Survey Components...11
2.2.4. Choosing the Control Group...11
2.2.5. Sampling Procedure...12
2.2.6. Data Collection...12
2.2.7. Data Analysis and Interpretation...13
2.2.8. Challenges and Data Limitations ...13
3.0. MICRO-CREDIT SUB-SECTOR ISSUES...14
4.0. RESULTS AND DISCUSSION ...17
4.1. Characteristics of Survey Respondents...17
4.2. Age of Respondents...17
4.3. Marital Status...18
4.4. Respondents Educational Attainment ...18
4.5. Housing Status...20
4.5.1. House Floor Material...20
4.5.2. House Floor Material by Client Status...21
4.5.3. House Roofing Material...21
4.5.3 House Wall Material ...22
4.6. Proportion of Food Grown By household ...23
4.7. Food Gap Experienced By Households...24
4.8. Household Coping Strategies during Lean Periods ...26
4.9. Whether Coping Strategy Used in Last Twelve months...27
5.0. MICRO-VENTURES AND MICRO-LOAN OUTCOME INDICATORS ...29
5.1 Size of Loan per Household...29
5.2 Number of Loans Received by Client...30
5.3. Main Business Carried Out ...31
5.4. Asset Ownership...32
5.5.1. Contribution of Business to HH Income...36
5.6. Perceived Effect of Business on Personal Income...38
5.6.1. Use of Additional Income From MV Business...39
5.7. Monthly Household Expenditure...40
5.7.1. Micro-ventures and Non-Micro-ventures Clients...40
5.7.2 Microloan Clients and Non-Clients...42
5.8. Number of people employed by MV-MLF Clients ...42
6.0. OTHER OPERATIONAL DATA...43
6.1. Age of Children...43
6.2. Children Schooling-MV vs. Non-MV Clients...45
6.3. Children Schooling-MLF Clients vs. Non-clients...45
6.4. Monthly Average Educational Costs ...45
6.5. Child-breaks From School and Reasons...46
6.6. Common Ailments Reported By Respondents ...47
6.7. Period of Illness...49
7.0. CLIENTS FEEDBACK FOR IMPROVEMENT OF MV AND MLF PROGRAMS ...49
8.0. CONCLUSION AND RECOMMENDATIONS...50
SELECTED REFERENCES ...54
ANNEXES ...55
ACKNOWLEDGEMENTS
A number of people have contributed to the successful accomplishment of this assignment, although none of them should be held responsible any shortcomings of the report. Staff in Microloan Foundation and the Microventures Program both from the Malawi, the United Kingdom and United States of America Offices provided useful insights and guidance. Alfred Nkhoma, Joushua Perry and Ian Marshal provided overall guidance before and during the survey.
A team of eleven research assistants collected the data with dedication. We would like to thank them. For the time that the men and women (those participating and not participating in Microloan Foundation or Microventures Programs) accorded us during the field survey, we owe a debt of gratitude to them.
MURPHY KAJUMI SHAILEE PRADHAN ISAAC MAMBO September, 2008
LIST OF TABLES
Table 1:Survey Sample by Component ...11
Table 2: Sampled Clients and Non-clients by Sex ...17
Table 3: Age of Respondents ...18
Table 4: Marital Status of Sampled Clients and Non-Clients...18
Table 5: Respondents Educational Attainment ...19
Table 6: Proportion of Food Grown By Household...24
Table 7: Food Gap in Last 12 Months...24
Table 8: Food Gap among MLF and Non-MLF Client HHs...25
Table 9: Main HH Coping Strategies-MV and Non-MV Clients ...26
Table 10: Main Food Shortage Coping Strategy-MLF and Non-MLF Households ...27
Table 11: Coping Strategy Used in Last Twelve months ...28
Table 12: Coping Strategies Used in Last 12 months...28
Table 13:Size of Loans Accessed By MV and MLF Clients ...29
Table 14: Number of loans received-MLF and MLF Clients...31
Table 15: Common Businesses Carried Out By MV Clients ...31
Table 16: Common Businesses undertaken by MLF Clients...32
Table 17: Asset Ownership among MV and Non-MV Clients...33
Table 18:Asset Ownership-MLF and Non-MLF Clients ...34
Table 19: Monthly HH Average Incomes-MV Clients ...35
Table 20: Sources of Income and Contribution to HH Income- MV Client ...36
Table 21: Monthly HH Average Incomes-MLF and Non-MLF Clients...37
Table 22: Source of Income and Estimated Monthly Contribution...38
Table 23: Perceived Effect of Business on Personal Income ...39
Table 24: Use of additional income from MV Business...40
Table 25 : Reported Monthly Household Expenditure-MV and Non-MV Clients...41
Table 26:Estimated monthly household expenditure among MLF and non- MLF clients.42 Table 27: Number of people employed by MV-MLF Clients ...43
Table 28:Age of children by client Status ...44
Table 29: Children Age Distribution-MLF and Non-MLF Clients...44
Table 30 : Children Schooling-MV vs. Non-MV Clients...45
Table 31:Children Schooling Status ...45
Table 32:Monthly Average schooling Costs-MV vs. non MV...45
Table 33:Monthly Education Costs-MLF and Non-MLF Clients...46
Table 34: Reasons for Child Breaks From School-MV and Non-MV Clients...46
Table 35 : Reasons For Child Breaks From School-MLF and Non-MLF Clients ...47
Table 36: Summary of Main Ailments Reported by MV Clients...47
Table 37: Reported Illnesses among MLF and non-MLF Clients ...48
Table 38:Duration of Illness among Clients and Non-Clients ...49
LIST OF FIGURES
Figure 1.House Floor Material ...20 Figure 2: Roofing Material...21 Figure 3: Housing Wall Material ...22
ACRONYMS
GDP Gross domestic Product
HH Household
MFI Mircofinance Institutions
MLF Microloan Foundation
MV Microventures
UNDP United Nations Development Program
EXECUTIVE SUMMARY
The Micro-loan Foundation (MLF) commenced operations in Malawi in 2002, and is currently operating with nine branches in the country. A survey was conducted in July/August 2008 to gather and analyze data on basic indicators that the MLF is contributing towards. This report presents the results of the survey.
The survey found that the majority of MV households (75%) got loans of MK 20,000.00 (USD143) or less, with more than half (56%) reporting getting loan amounts of MK 10,000.00 (USD71) and less. Among the MLF clients, a similar trend as in MV clients was observed with the bulk of the clients (88%) accessing loans of MK 20,000 (USD143.00) or less, and 67% of the MLF households getting loans of MK 10,000.00 (USD70) or less. There are indications that some of the clients consider the loans to be too small to have a meaningful impact on poverty reduction;
About a third (36%) of the MV clients indicated the MV business had increased their household incomes, while 64% of MV clients indicated there had been no increase. Among the MLF clients, the picture was somewhat different, with close to 80% perceiving the MLF business to have increased household incomes, and 22% indicating the business had not increased incomes.
Based on reported incomes, the survey found that the average incomes per month among clients were higher than non-clients in both MV and MLF programs; although there was no evidence that this difference was as a result of the MV or MLF interventions. Average monthly household income was found to be MK20,017.17 (USD143.00) among the MV clients compared to MK16,822.95 (approximately USD120.00). Among MLF clients the average income was estimated to be MK 38,908.00 (USD278.00) and MK 23,331.38 (USD167.00) among non-MLF clients per month. Results on household consumption indicate almost similar levels of average consumption between clients and non-clients. Among the MV and non-MV clients, average household consumption expenditure was recorded at MK 8,302.13 (USD59.00) among MV clients compared with MK8,473.37 (USD61.00) and non-MV clients. The average household monthly expenditure on a selected set of goods and services was MK10,652.18 (USD76.09) among MLF clients compared with MK 9,719.10 (USD69.42) among non-MLF-client household.
From the survey, over 85% of children from both clients and non-clients were in school. Main reasons for children staying away from school were sickness and perceived ‘laziness by children’
Key areas of programming attention by MLF appear to be (a) the need to increase the loan amortization period, (b) consider reducing interest rates, (c) linking clients to reliable markets, and (d) consider providing agricultural input credit.
1.0. INTRODUCTION
The Micro-loan Foundation (MLF) commenced operations in Malawi in 2002, and is currently operating with nine branches in the country. It is a not-for- profit organization registered in the United Kingdom, but with a focus of sub-Saharan Africa, although it also has operations in the Philippines. The MLF provides small loans, basic business training, and on-going mentoring support to groups. It also assists its clients with savings services to increase financial security, and linking them up with other services from partner organizations.
The Micro-ventures component managed as part of the MLF provides a support framework that facilitates the organization, production, and marketing of products from these groups. It also provides skills training and seed capital to ensure the various groups start on a path towards enterprise initiatives that have higher margins.
Ultimately, the aim of initiatives under the wider MLF program as well as the MV component is to assist households build sustainable livelihoods that enable them increase their incomes, feed themselves and educate their children to escape from the poverty trap, in line with the overall MLF aspirations.
Since its operations started, anecdotal evidence suggests that the MLF and MV program are having a positive affect on most of the clients, largely composed of women. However, this impact is still to be quantified and a framework for assessing it is viewed to be weak. In view of this, a baseline survey to establish the current status of the development outcomes that MLF and MV seeks to contribute towards was carried out in the months of July and August 2008.
This report presents the results of the survey. The report is organized in five main parts. After a brief introduction, an overview of micro-credit sub-sector issues is presented in section 2. This is followed by a presentation and discussion of results relating to MV and MLF operations and contribution towards expected outcomes. In section 4, results on other data are presented. Finally, section five is a conclusion and presents a summary of the findings and provides recommendations to improve MLF and MV operations, as well as on the creation of a continuous learning framework.
1.2. Survey Objectives
From discussions with officials from Micro-loan Foundation; the study was aimed at achieving the following objectives:
To collect and analyze data on expected key outcome areas for MLF and MV programs on the basis of which program impacts may be monitored over time, To collect other relevant data as determined by Micro-loan Foundation that
would be the basis for follow up studies.
To create and/or enhance the existing program operational database that may be used for periodic program monitoring.
2.0. METHODOLOGY AND APPROACH
The section presents the consultancy approach, methodology and tools for data collection and analysis that were employed to successfully implement the baseline survey. A number of initial consultations were made with MLF staff who made proposals that guided the overall survey design and implementation.
At the outset, the consulting team recognized that the key objective of a baseline survey is to collect facts and figures at the initial stages of a development program or project that provides a basis for measuring progress towards impacts. The process therefore, involved agreeing and determining the status of the impact indicators of the program. A range of methods, including document review, questionnaire survey and key informant interviews (KII) were used.
2.1. Survey Design
Based on discussions with MLF senior staff the survey design sought to answer the following key questions:
A- What is the current status of the outcome indicators that the MLF and MV program seeks to influence? These were initially identified as: (a) household income, (b) household consumption levels and asset accumulation;
B- For future impact analysis, to determine whether, compared to non-client households: (a) participation in the Micro-loan/MV programs has led to perceptible increases in household income, (b) increases in welfare levels measured by consumption is more in client households, and (c) increases in asset accumulation is more in participating households-See Annex 1.
2.2. Sampling Design
The determination of the sample size was largely guided obtaining size that would give statistically meaningful data; and the need for achieving a representative sample was also key. Feasibility in terms of cost and time was another factor the was considered. Informed largely by discussions with Micro-loan Foundation officers, the sections present the sampling design:
2.2.1. Micro-ventures Program
For the Micro-ventures program, all the 196 clients in the program as of June 2008 were interviewed i.e. a census. Although according to Israel (1992) and Watson (2001), when the population is 250, and with a conservative degree of variability of 50%, at 95% and 5% confidence and precision levels, respectively, a sufficient basic sample is calculated at 1541. Given that a control group is planned to improve the robustness with which program impacts may be deduced in follow up assessments, an equal number of MV and non MV clients were interviewed. Thus, the total number of respondents for the MV survey was 392.
2.2.2. Micro-loan Foundation
For the MLF component of the survey, tables calculated by Israel and Watson (Ibid) for various population levels were used. Given the total number of clients in the Microloan program of 5,000, and assuming a 30% degree of variability (i.e. we will be able to observe a positive outcome in the parameters of interest in 30% of the sample) the basic sample size would be 166, at confidence and precision levels of 95% and 5%, respectively. This sample size was adjusted for an 80 percent response rate, and finally came to 210 for MLF clients. A corresponding number of non-clients was also sampled as a control and brought the total sample size related to the Micro-loan component to 410.
2.2.3. Combined Total Sample for MV and MLF Survey Components
The combined sample size for both components came to 812, as depicted in Table 1 below.
Table 1:Survey Sample by Component
2.2.4. Choosing the Control Group
The sample comprised of equal numbers of both clients and non-clients of the project. Non-clients were used as a control that will assist in the determination of project
1 See Glenn D. Israel (1992), Sampling the Evidence of Extension Program Impact, University of Florida
and Watson, Jeff (2001). How to Determine a Sample Size: Tipsheet #60, University Park
Client Status MV
Component MLF Component Total
Clients 196 208 404
Non-Clients 196 210 406
impact at the evaluation stage by comparing the changes that will have occurred in MV and MLF outcome indicators.
The control group was required to create a ‘counterfactual’- i.e. what would have happened if the program was not undertaken? This will be useful in determining impacts that may be attributable to MLF and MV programs on the outcome areas of interest2. In this survey, these households were selected from adjacent villages in which the clubs were, and used non-participation in the program as the main distinguishing factor from program participants. However, socio-economic indicators relating to the livelihood systems in the locality such as access to productive resources-land, education levels, incomes etc were also collected3.
2.2.5. Sampling Procedure
As indicated above, a census of the MV clients was undertaken, while 210 from the MLF clients were sampled, totaling 406 program participants4. In addition, 408 non-clients (in MLF and MV) were selected and interviewed. For the MLF clients, a two stage sampling procedure was followed: first, clubs were randomly selected and this yielded 14 clubs Second, all the members within the selected clubs were interviewed. Non-clients were selected from adjacent villages, with non-participation in MLF or MV activities as the main criterion for selection.
2.2.6. Data Collection
A listing of basic tables was provided by MLF. These tables formed the basis of the structured questionnaire for the survey that was the main instrument for data collection-see Annex 1. Other data collection methods were document review, key informant interviews and observation. Document review was used to gain insights into MLF and MV program design, and general contextual issues that have a bearing on the operation of micro-credit schemes in Malawi and internationally. Key informant interviews were used to solicit input from Micro-loan staff, and to obtain qualitative information on key aspects of the program. Observations were used to gather data on aspects that did not need individual interviews e.g. roofing material for a house.
Enumerators were trained in administering the questionnaire prior to their deployment for the data collection to equip them with standardized interviewing skills and to ensure data quality and integrity.
2 See Ezemenari, K and others, 1999, Impact Evaluation: A note on concepts and methods
3 An earlier study on the MV program (Kajumi, 2007) revealed that participants and non-participants
displayed similar characteristics in terms of socio-economic indicators.
In the field, data were collected by a team of nine enumerators that were assisted by two field supervisors and two principal researchers. The field supervisors provided the necessary support to assure data quality.
Samples of filled out questionnaires were randomly selected and scrutinized each day to ensure correct responses were provided and recorded. All errors spotted were corrected in the field. Principal researchers conducted data cleaning after the data entry process to further assure the quality.
2.2.7. Data Analysis and Interpretation
The data collected from the survey was systematically categorized and analyzed to determine the current situation on the MLF and MV program outcome areas. Data was analyzed using Statistical Packages for Social Scientist (SPSS) to obtain largely descriptive statistics such as frequencies, percentage, means and ranges on the key parameters. Content analysis was used for analyzing qualitative data. This involved summarizing the data, establishing trends or common issues, verifying and reconfirming the data with alternative sources and then drawing conclusions.
2.2.8. Challenges and Data Limitations
In general, the survey proceeded without major disruptions. Challenges that were observed were logistical, and led to replacement of the originally selected sites in Mzuzu and Rumphi. Secondly, during the first day of the survey, field activities were affected by communication lapses. However, these were resolved during the subsequent days and the survey proceeded without major challenges thereafter.
Data on key outcome indicators such as income and consumption levels, as well as household accumulation of assets that are suggested as proxy for the welfare effects of the MV and MLF activities needs to be interpreted with caution. First, data on income and consumption is based on recall by households for the month. Thus, while it is possible to get a general picture in terms of the main income sources and consumption patterns, achieving a measure of accuracy is particularly difficult. In addition, due to seasonal income and consumption fluctuations, these data may only present a ‘snap shot’ of the reference period. Secondly, data on asset ownership appears weak as they do not include estimation of the value of the assets. Thus apart from gauging the proportion of people owning a particular asset among clients and non-clients, it will not be possible to gauge the effect of asset accumulation. Thus, the information on asset ownership is rather weak and future assessments should attempt to quantify assets, despite the measurement challenges that this may entail.
Other data such as illnesses were based on reports from respondents, rather than diagnosis records. These data should therefore be treated as such.
3.0. MICRO-CREDIT SUB-SECTOR ISSUES
In Malawi 65% of the population lives below the national poverty line and the majority of these are women (UNDP 2007). Agriculture accounts for 40% of GDP and employs 80% of the workforce (ibid). With an agrarian economy that is highly dependent on erratic rainfall, Malawi also lacks sectors that would add value to agricultural produce. Poverty is more persistent in the rural areas at about 65.3% of the population (Pitamber 2003). Moreover, female-headed households, which are estimated to be about 35% nationally, are consistently poorer than male-headed households (ibid).
In the finance sector, Malawi is lagging behind in serving the poor. Of the economically active poor in Malawi, it is estimated that only three percent have access to savings and one percent have access to credit (UNDP 2007). In recent years, microfinance institutions have started operating in Malawi to provide for the lack of credit markets, particularly in rural areas.
Microfinance began as the experimental dream project of Dr. Muhammad Yunus, an economics professor at the University of Chittagong. Driven by a strong sense of developmental idealism, Dr. Yunus sought a new way to provide credit to the rural poor of Bangladesh. The success of his pilot study developed into what is now the world’s most famous microfinance institution—the Grameen Bank. Institutions now replicate its pioneering methodology worldwide. Furthermore, microfinance has become attractive to donors because of its ability to be financially self-sustainable in a short period of time. Donors may front money, but this is used and reused by the project or institution in the form of low interest loans.
A few basic characteristics of microfinance that apply to the Micro-loan Foundation as well are summarized below:
i. Lack of Credit Markets
The importance of microfinance institutions (MFIs) comes from the fact that market failure in credit markets results in a lack of formal financial institutions in rural areas. In many cases, market failure also results in discrimination against women in credit markets. Hence, women in rural areas are most negatively affected by market failure. MFIs address market failure by providing rural households access to financial institutions and by enhancing womens’ access to credit, as demonstrated by the large number of women borrowers in rural areas.
MFIs are based on various models. The most popular model is the ‘group-lending’ model, which originates from the Grameen Bank. Under this approach, the bank makes loans to individuals, but the individuals have to form a group with other people seeking loans. If a borrower is unable to repay, all the group members may have to forfeit their membership or pay themselves. This creates an incentive for the group members to keep track of each other. In essence, the group-lending model invokes “social collateral” in the absence of material collateral.
The group-lending model has been lauded for its dual function as banking collective and social support network; however, it is not without its critics. It has been suggested that the group-lending model is motivated by a desire to reduce administrative costs rather than to stimulate collective action and female empowerment (Rankin 2002). Some argue that group liability creates excessive pressure and discourages good clients from borrowing, jeopardizing growth and sustainability of the MFI (Gine and Karlan 2007). Also, bad clients can "free ride" off of good clients causing default rates to rise (ibid). Moreover, some may be reluctant to borrow if information about other members is not available, thus group-lending model may have limited reach (ibid).
In Malawi, Pitamber (2003) found that group lending methodology might not be the most suitable method that it is claimed to be. She reports that some clients are more active than other group members, making their repayments promptly. The challenge arises for the active client when she wants a second loan, which she cannot get until the first loan cycle is completed. Thus, the clients who cannot meet the repayment deadlines delay the active clients from getting further loans. It has been found that the more active clients soon become disillusioned by this process and drop-out of the credit program altogether.
iii. Female Client Target
MFIs have made great strides in delivering financial services to the poor especially women at very low loan default rates (Khandker 2005). Many MFIs specifically target women based on the view that women are more likely to be credit constrained than men, have restricted access to the wage labor market, and do not have an equitable share of power in household decision-making (Pitt et al. 1998). By targeting women, microfinance is seen as a tool that can raise women’s social status and enhance their bargaining power (NSP Bulletin No. 20 2006).
However, Pitamber (2003) notes that in Ethiopia where many MFIs have above 50% female clientele, high female clientele was not a direct targeting strategy in the interests of gender inequity, rather women were simply better clients than men. In her study, she found that firstly women did not demand high loan amounts and therefore did not pose a great risk for the MFI itself. Secondly, women borrowers’ risk averseness meant punctual repayments. Thirdly, women recognized the need to borrow in the future and thus maintained better
relationships with the MFIs. She concludes that for MFIs, “focusing on women as clients made better business sense and contributed to business profits and sustainability”
Furthermore, Pitamber (2003) also notes that the fact that more and more women are being targeted for microfinance may indicate that “poverty amongst women is likely to increase disproportionately more so because of poverty implication of loan amounts, interest rates, repayments, etc” .
iv. Microfinance and Income
The immense popularity of MFIs lies in the fact that credit access is an important tool in alleviating poverty. When the poor are denied credit access, it only adds to their burden of poverty. As Weiss and Montgomery (2004) note, poverty is interpreted as a problem that is “one of lack of access by poor households to the assets necessary for a higher standard of income or welfare, whether assets are thought of as human (access to education), natural (access to land), physical (access to infrastructure), social (access to networks of obligations), or financial (access to credit)” (p.6). 5 The case for microfinance as a mechanism for poverty reduction is simple: “if access to credit can be improved, it is argued, the poor can finance productive activities that will allow income growth, provided there are no other binding constraints” (ibid). Lack of access to credit for the poor comes from the inability of the poor to offer collateral. Microfinance is able to reach the poor because no collateral is required for microfinance services. Therefore, microfinance has become vastly popular as a possible tool for addressing income poverty. Given the multidimensionality of poverty, attention must be paid not only to income but to other measures of deprivation, including limited access to food, health services, and social support; microfinance has shown promising results in these areas as well.
A criticism by Pitamber (2003) that should be noted is: “In Malawi, field data shows that a majority of the MFIs operating are internationally based. These MFIs may also have operations in other countries in the region using the same methodology and credit delivery mechanisms, with only slight variations to match the country environment. Repayments start immediately and are either made weekly or bi-monthly with a repayment period averaging four to six months. Thus the end objective of each lending operation is mainly the recovery of the capital and interest and to continue lending”
5 Weiss and Montgomery cite World Bank (2000), World development report 2000/01: attacking poverty,
4.0. RESULTS AND DISCUSSION
This section presents and discusses the results of the survey. It highlights household socio-economic characteristics first, comparing MV or MLF client with non-clients in the two components of the survey. This will be followed by a presentation of results on outcome related indicators that will also compare clients and non-clients. Other relevant data will also be presented in this section.
4.1. Characteristics of Survey Respondents
A total of 810 respondents were interviewed, representing a 99.8% total response rate. Under the MV component, a 100% response rate was achieved, while under MLF, 99.5% was achieved. Of the total respondents interviewed, 551 were women who accounted for 68% of the total interviewees. Under Micro-loan Foundation credit groups, there were no male members recorded while under the MV component, 25 male members were recorded and these represented 13% of the 196 clients interviewed. Women under non-MV clients totaled 163, and accounted for 84%, while men accounted for 17% of the non-MV clients.
Nine men were recorded MLF non- client sites, representing 4% of the 210 non- MLF clients interviewed. Under the non-MLF sites, two hundred and one (201) women were interviewed, representing 86% of the non MLF clients. The absence of men was largely as a result of the targeting policy adopted by MLF, with most, if not all of the clients accessing loans recorded as female. Table 2 depicts the numbers of respondents by sex.
Table 2: Sampled Clients and Non-clients by Sex
Marital Status Client Status
MV Non-MV MLF Non-MLF Total
Female 171 163 208 9 551
Male 25 33 0 201 259
Total 196 196 208 210 810
4.2. Age of Respondents
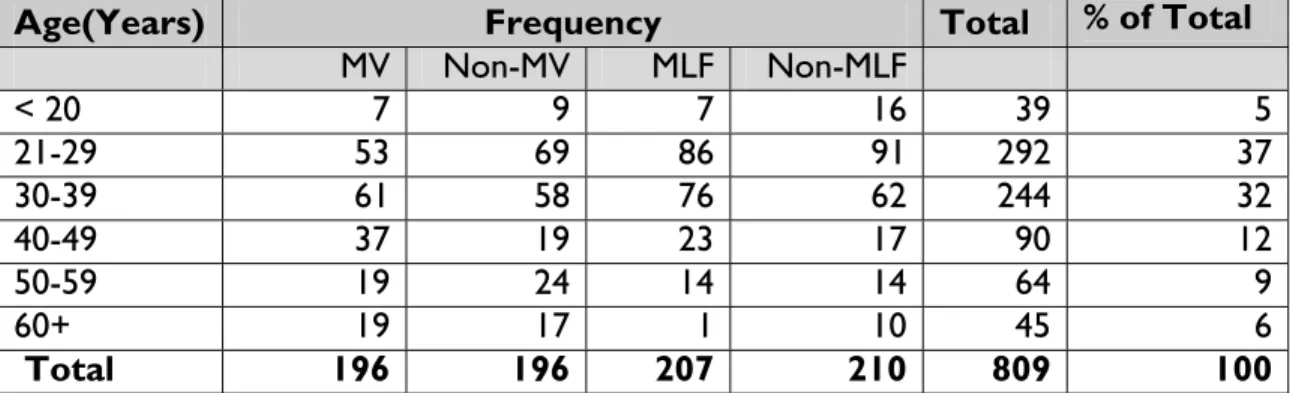
The highest number of respondents was recorded in the age bracket 21-29, with 292 people or 66% of the total interviewed. This was followed by persons aged between 30 and 39, who accounted for 30% (244 people) of the respondents. Respondents of 20 years and below accounted for 4%, while those above 39 years accounted for 25%. The age structure of the clients and non-clients is presented in Table 3 below.
Table 3: Age of Respondents
Age(Years) Frequency Total % of Total
MV Non-MV MLF Non-MLF < 20 7 9 7 16 39 5 21-29 53 69 86 91 292 37 30-39 61 58 76 62 244 32 40-49 37 19 23 17 90 12 50-59 19 24 14 14 64 9 60+ 19 17 1 10 45 6 Total 196 196 207 210 809 100 4.3. Marital Status
In Table 4 below, 86% of all the sampled respondents were married while 14% were not married. Within the groups, i.e. clients and non-clients, respectively, the proportion of those married and not married under MLF was 88% and 12% respectively, while under the MV component, 83% and 17% respectively were married and not married.
Table 4: Marital Status of Sampled Clients and Non-Clients
Marital Status Client Status
MV Non-MV MLF Non-MLF Total
Married 163 172 183 182 700
Not Married 33 24 25 28 110
Total 196 196 208 210 810
% Married 83.16 87.76 87.98 87.50 86.42
% Not Married 16.84 12.24 12.02 13.46 13.58
4.4. Respondents Educational Attainment
Education has a direct relationship with levels of poverty and the potential of an individual to escape from poverty and vulnerability. The survey collected data on educational attainment among clients (MLF and MV) as well as non-clients.
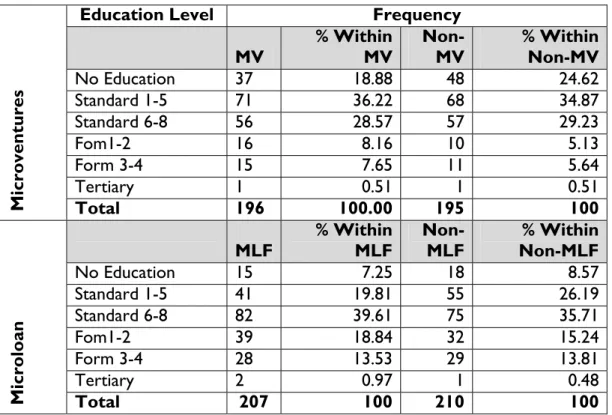
Among the MV clients, 37 respondents (19%) had not had any formal education, while among non-MV clients; the corresponding number of people that had not had formal education was 48 (25%). Thirty-six and 34 percent among the MV clients and non-MV
clients, had had formal education of up to standard five, respectively. Further, the number of people reporting attainment of up to standard eight was almost the same at 28.6% and 29% among MV and non-MV clients, respectively. Sixteen percent among the MV clients had attained secondary school education up to form four, while those that had attained education beyond standard eight among the non-MV clients were 11%. The educational attainment of respondents is presented in Table 5 below.
Table 5: Respondents Educational Attainment
Education Level Frequency
MV % Within MV Non-MV % Within Non-MV
No Education 37 18.88 48 24.62 Standard 1-5 71 36.22 68 34.87 Standard 6-8 56 28.57 57 29.23 Fom1-2 16 8.16 10 5.13 Form 3-4 15 7.65 11 5.64 Tertiary 1 0.51 1 0.51 Microventures Total 196 100.00 195 100
MLF % Within MLF Non-MLF Non-MLF % Within
No Education 15 7.25 18 8.57 Standard 1-5 41 19.81 55 26.19 Standard 6-8 82 39.61 75 35.71 Fom1-2 39 18.84 32 15.24 Form 3-4 28 13.53 29 13.81 Tertiary 2 0.97 1 0.48 Microloan Total 207 100 210 100
Among the MLF clients, 7% reported having not attended any formal education, while the percentage of people with no formal education among the non-MLF households was 9%. Those with education of up to standard 5 were 20% and 26%, respectively, among MLF clients and non MLF-clients. Nearly 40% of MLF clients had attained education levels of up to standard eight, while about 36% among the non-MLF clients had attained the same education levels. Beyond standard eight, the survey found that 19% among MLF clients had formal education up to form two, while the corresponding percentage among the non-MLF clients was 15%. Regarding educational attainment beyond form two, the percentage is almost the same at 14% between the two groups.
From the forgoing, the evidence on educational attainment does not show major differences between the two groups. The majority of the clients and non-clients could be said to have achieved primary education (standard 1 to 8). Except the percentage of people that had not attained any form education among the MV and non-MV clients, and standard 1-5 among the MLF data subset, in the rest of the educational attainment
categories there appeared not to be any perceptible difference. This suggests that there are basically no significant differences among the clients and non-clients.
4.5. Housing Status
Housing conditions for both clients and non-clients appeared to be similar. Wall materials were mostly made from mud and poles, although a number of both clients and non-clients had houses with brick and cement mortar walls. Flooring material; was mostly mud. Roofing was also mostly grass thatch although iron corrugated sheets were used for some households
4.5.1. House Floor Material
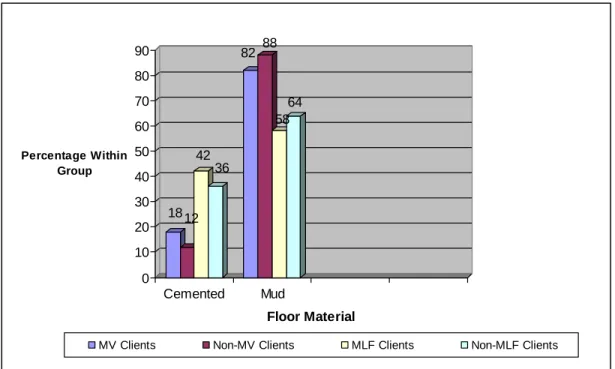
The evidence shows that more client households (MV or MLF) than non-clients had better flooring material. However, there was no evidence to suggest that this was as a result of participation in MV or MLF clients as the survey was only focused on collecting baseline information6. Figure 1 shows the type of flooring by client status.
Figure 1.House Floor Material
6
However, client respondents had been involved in MV and non-MV activities for at least a year or more at the time of the survey
18 12 42 36 82 88 58 64 0 10 20 30 40 50 60 70 80 90 Percentage Within Group Cemented Mud Floor Material
4.5.2. House Floor Material by Client Status
Housing floor material for 18% of MV clients was cement, while among the non-MV clients the corresponding percentage was 12%, showing a 6 percentage points difference between the two groups. The rest of the houses under both groups had mud floors, 82% and 88% for MV clients and non- MV clients, respectively.
In the MLF and non-MLF sub-set, 42% and 36% of households had houses with cement floors, respectively. Consequently, the balance of households in this sub-set had mud flooring at 58% for MLF clients and 64% for the non- clients.
4.5.3. House Roofing Material
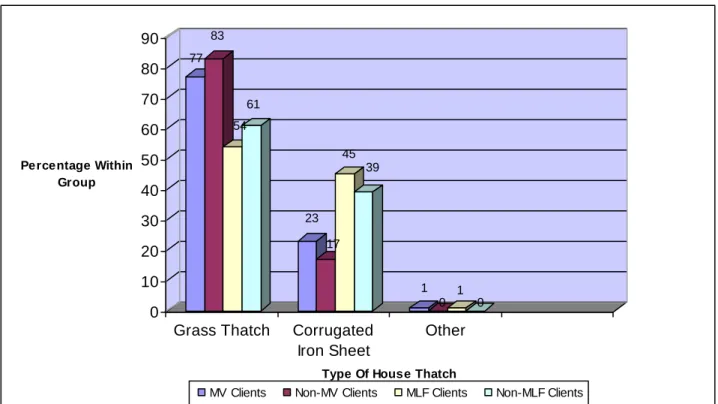
Roofing material for houses was mostly grass thatch and corrugated iron sheets in both client and non-client households as shown in Figure 2 below.
Figure 2: Roofing Material
From Figure 2 above, we note that 23% and 18% among the MV and non-MV clients, respectively had houses with corrugated iron sheet roofs. Seventy-seven percent (77%) MV clients compared to 83% non-client households had grass thatched roofs.
The trend in MLF sites was the same, with more MLF client households having houses with corrugated iron sheet roofs than non-MLF clients at 46% and 39%, respectively. Those with grass thatched roofs among MLF clients accounted for 54%, while among
77 83 54 61 23 17 45 39 1 0 1 0 0 10 20 30 40 50 60 70 80 90 Percentage Within Group
Grass Thatch Corrugated
Iron Sheet
Other
Type Of House Thatch
non-MLF clients 61% of houses had grass thatched roofs. Again, we note that there were more clients than non-client households with better housing roofing material (i.e. iron sheets), albeit with marginal differences between MV and non-MV clients. As indicated above, there was no evidence to suggest that these differences were as a result of participation in either MV or MLF programs. Nonetheless, it is also worth noting that clients had already participated for a year or more in either MV or MLF micro-credit activities.
4.5.3 House Wall Material
Regarding housing wall material, four types were distinguishable: (a) baked brick with cement mortar, (b) mud and poles, (c) baked brick with mud-mortar and, (d) unbaked brick with mud mortar. The type of housing material by client status is depicted in
Figure 3 below.
Figure 3: Housing Wall Material
23 18 47 45 29 28 10 18 1110 4 7 24 31 27 20 13 13 12 11 0 5 10 15 20 25 30 35 40 45 50 Percentage Within Group Baked Brick&Cement
Compacted Soil Mud&Pole Baked Brick&Mud Unbaked Brick&Mud Wall Material
As can be seen from Figure 3 above, more MV clients than non-MV clients had house walls made of baked brick and cement mortar7. With 23% of households among the MV clients compared to 18% among the non-MV client households. A similar proportion of households in the MV and non-MV clients (about 30%) had their houses made of compacted soil (mdindo), and an almost similar proportion (about 10%) of households among the two groups (MV and non-MV) had wall material made of mud and pole. Baked brick with mud and mortar was the second most common type of housing wall material. More non-MV households (31%) compared to MV households (24%) had houses with baked brick and mud mortar. Finally, the percentage of households among the MV and non-MV clients with walls made of unbaked brick and mud mortar was identical, at 13% in each group.
Amongst the MLF clients, 46.6% had wall material made of burnt brick and mud mortar. As for Non-clients, 44.8% respondents had houses with this wall type. Under the MV clients, houses made of baked brick walls with mud constituted the second largest group of wall type. Between MLF clients and Non-clients, MLF clients accounted for 27% and Non-clients 20%. A within group comparison reveals that both groups-MLF clients and Non-clients- have more houses made of baked bricks and cement walls than the other forms of walls.
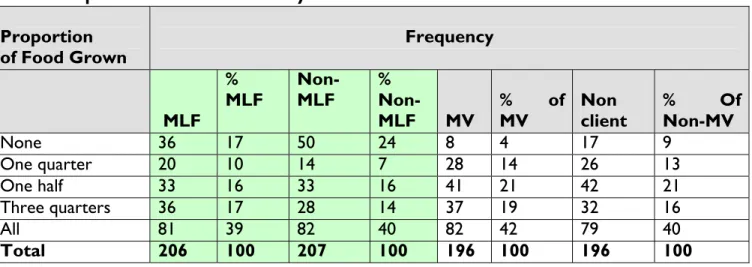
4.6. Proportion of Food Grown By household
Results from the survey indicate that the majority of the households produce at least three quarters of the food they consume.
Respondents that reported producing all of the food they consume constituted the largest proportion among MLF clients (39%) and Non-clients (40%) representing 81 and 82 respondents, respectively. The next largest groups in the MLF clients reported producing none and three quarters of the food they consume. These groups shared equal proportions, that is, 17% representing 36 respondents in each group. The case was rather different among Non-clients where 24% (50) of the respondents reported that they do not produce any of the food that is consumed in their households. Sixteen percent (16%) of the Non-clients reported producing half of the food that is consumed. A total of 82 or approximately 42% of the MV respondents reported growing all the food they consumed, and 37 (19%) reported they grew three quarters of the food they consumed. These results are consistent with the fact that for Malawi, as may be the case for many developing economies, the bulk of consumption comes from household own production. Compared between MV and non MV clients, the proportions of households growing half of the food they consumed were similar, 21% for both MV clients and non-MV clients. -Table 6.
Table 6: Proportion of Food Grown By Household Proportion
of Food Grown Frequency
MLF
%
MLF Non-MLF %
Non-MLF MV % of MV Non client % Of Non-MV
None 36 17 50 24 8 4 17 9 One quarter 20 10 14 7 28 14 26 13 One half 33 16 33 16 41 21 42 21 Three quarters 36 17 28 14 37 19 32 16 All 81 39 82 40 82 42 79 40 Total 206 100 207 100 196 100 196 100
4.7. Food Gap Experienced By Households
Household food sufficiency throughout the year shows extent of household well being in Malawi. The capacity of a household to meet its food requirements (usually maize) either through growing enough of its own food or being able to purchase is seen as a key indicator for well-being by households in the country. Overall, approximately 40% of the households among both the MV clients and Non-clients reported experiencing a food gap of at least one month in the past twelve months-Table 7 below provides the details.
Table 7: Food Gap in Last 12 Months Food Gap
(Months) Frequency By Client Status
MV % MV Clients Non client within % Within Non-Clients
0 68 34.69 58 29.59 1 12 6.12 11 5.61 2 27 13.78 28 14.29 3 33 16.84 42 21.43 4 15 7.65 13 6.63 5 5 2.55 5 2.55 6 21 10.71 16 8.16 7 3 1.53 7 3.57 8 5 2.55 4 2.04 9 4 2.04 3 1.53 10 1 0.51 2 1.02 12 7 3.57 9 4.59
Total 196 100 196 100
As can be noted from Table- 7 above, 44% and 48% MV and non-MV households, respectively reported having experienced food shortage of between one and four months. In Malawi, the food gap period is usually an indication of a household’s vulnerability to shocks affecting household consumption. This shows that about half of the households in both MV and non-MV clients could be said to be vulnerable. From the survey results therefore there appeared to be no difference in the proportions of households experiencing food gaps between the clients and non-clients.
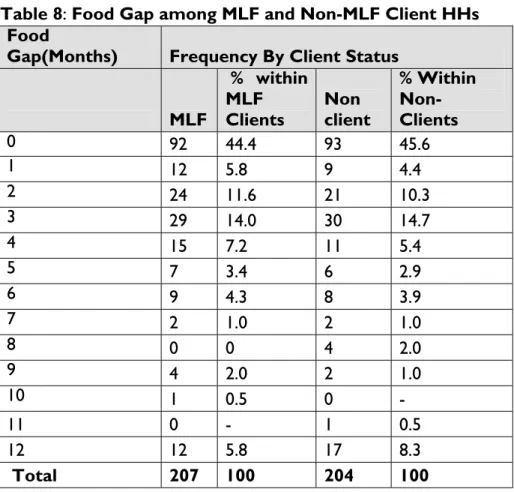
Table 8 presents food gap information among MLF clients and Non-clients Respondents that reported facing no food gaps in a year constituted the largest number (185). Out of this figure, 50.3% were Non-clients and 49.7% were MLF clients. This shows that the proportional differences between the two are marginal. Amongst MLF clients, the largest proportion (44.4%) reported facing no food gaps in a year.
Table 8: Food Gap among MLF and Non-MLF Client HHs Food
Gap(Months) Frequency By Client Status
MLF
% within MLF
Clients Non client
% Within Non-Clients 0 92 44.4 93 45.6 1 12 5.8 9 4.4 2 24 11.6 21 10.3 3 29 14.0 30 14.7 4 15 7.2 11 5.4 5 7 3.4 6 2.9 6 9 4.3 8 3.9 7 2 1.0 2 1.0 8 0 0 4 2.0 9 4 2.0 2 1.0 10 1 0.5 0 - 11 0 - 1 0.5 12 12 5.8 17 8.3 Total 207 100 204 100
4.8. Household Coping Strategies during Lean Periods
In the face of food shortages in parts of the year, most households resort to providing casual labour8, usually working on other people’s gardens either for payment in kind (food) or money. The proportion of households that indicated the provision of casual labour as the main coping strategy was 38% among the MV clients and 39% among the non-clients. About 19% among the MV clients reported buying as the second most commonly used coping strategy, while among the non-clients, 25% indicated buying as the second most common strategy. Other coping strategies were reduction in the number of meals per day and begging. Table 9 below depicts coping strategies by households among MV and non-MV clients.
Table 9: Main HH Coping Strategies-MV and Non-MV Clients Coping
Strategy Frequency By Client status Total MV and Non-MV HH
MV % of MV Clients Non client
% of non- MV Clients Total HH % Casual labour 75 38.27 77 39.29 152 57.79 Reduce No
of meals per day 12 6.12 8 4.08 20 7.60
Begging 3 1.53 3 1.53 6 2.28
Buying 37 18.88 48 24.49 85 32.32
Total* 127 64.80 136 69.39 263 67.09
*Out of the total households interviewed
The relatively high proportion (approximately 40%) of households amongst both the MV and non-MV clients providing casual labour (Casual labour) is indicative of the degree of vulnerability in both groups.
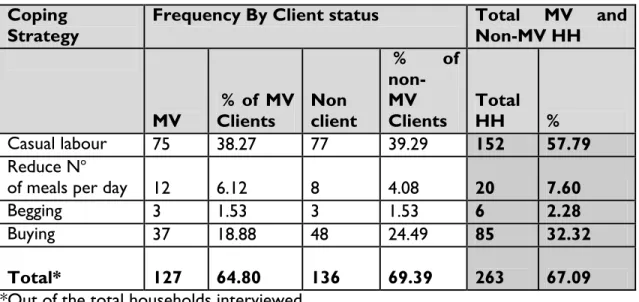
The survey found that 124 respondents (MLF and non-MLF) depended on buying food stuffs to meet food shortages. Out of this figure, 55.6% were MLF clients and 44.5% were Non clients representing 69 and 55 respondents respectively. This shows that MLF clients are able to cope up with food shortages through buying. This can be attributed to the income they get from their business. A higher proportion of Non clients 60.5% reported that they engage in providing casual labor to cope with food shortages. This reflects the extent of vulnerability amongst this group. Among MLF clients the largest proportion 61.1% reported that their main food shortage coping strategy is buying, while 26.5% engage providing casual labour. Table 10 presents the details of main food coping strategies.
Table 10: Main Food Shortage Coping Strategy-MLF and Non-MLF Households
Main Coping
Strategy Status Total MLF and non MLF HH
MLF clients % of MLF Clients Non clients
% of
Non-MLF
Clients Total % Total
Casual labour 30 26.5 46 39.7 76 18.54 Reduce No of meals per day 11 9.7 10 8.6 21 5.12 Begging 2 1.8 5 4.3 7 1.71 Buying 69 61.1 55 47.4 124 30.24 Total 113 100.0 116 100.0 229 54.78
4.9. Whether Coping Strategy Used in Last Twelve months
Respondent were asked whether or not they had used any of the coping strategies at all in the last twelve months. The survey found that while there may be a main strategy used, usually a household would use a combination of coping strategies. Forty three percent (43%) of the responses showed that they provided casual labour in the last twelve months among the MV clients and 47% among the non-clients indicated providing casual labor.
Purchasing was reported to be the second most used means by both clients and non-clients with 30% of responses indicating usage in each group. As indicated above, the notion of household food security includes the capacity of a household either to produce enough of its own food or to be able to purchase the food. In this sense, the availability of cash to a household would play a potentially decisive role in achieving household consumption smoothing during lean times. As noted in section 5.6.1 below, the 47% of MV client responses and 49% of the MLF responses showed that additional income from either MV or MLF businesses was used to purchase of food and basic household needs.
Table 11: Coping Strategy Used in Last Twelve months
# Coping Strategy Client Status and HH Reporting Coping
Strategy Use* MV % of MV Non-MV % of Non-MV 1 Casual labour 79 43 93 47 2 Reduce No of Meals 36 20 49 25 3 Begging 14 8 17 9 4 Buying 54 30 67 30
* With multiple responses
Reduction in the number of meals per day was reported as being used in 20% and 25% of the responses among the MV and non-MV clients, respectively. Begging was recorded in 8% and 9% of MV clients and non-MV clients, respectively.
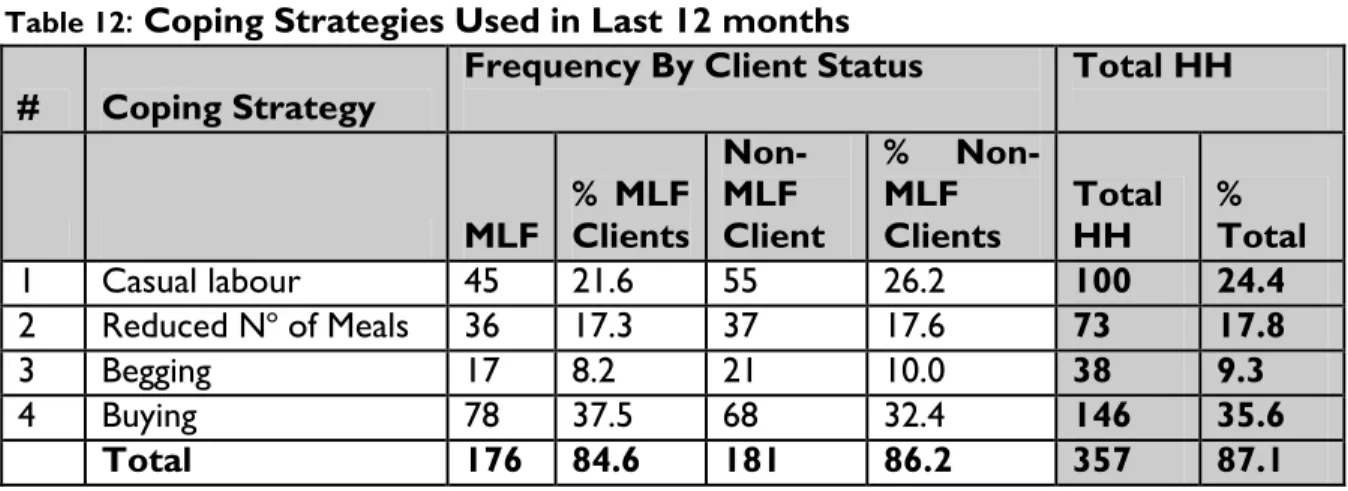
Among the MLF and non-MLF clients, the pattern appeared to be the same as those in MV and non-MV sites regarding the use of coping strategies during lean periods in the year. Most of the respondents interviewed in MLF and non-MLF households (36% ) indicated buying as the main strategy. Comparing between MLF and non-MLF clients, 38% of MLF households reported buying as a strategy against 32 % among non-MLF clients. Casual labour (ganyu), reduced number of meals and begging were the second, third and fourth most used strategies as depicted in Table 12 below.
Table 12: Coping Strategies Used in Last 12 months
# Coping Strategy Frequency By Client Status Total HH
MLF % MLF Clients Non-MLF Client % Non-MLF
Clients Total HH % Total
1 Casual labour 45 21.6 55 26.2 100 24.4
2 Reduced No of Meals 36 17.3 37 17.6 73 17.8 3 Begging 17 8.2 21 10.0 38 9.3
4 Buying 78 37.5 68 32.4 146 35.6
Total 176 84.6 181 86.2 357 87.1
As noted above, the degree of vulnerability to food shortages appears to be the same for MV and non-clients. The marginal differences in the actual use of the coping strategies between the two groups were in evidence. There is a striking similarity in the proportion of clients versus non-clients reporting the use of different coping strategies. In both groups, almost similar proportions of households reported coping strategies like providing casual labour, reducing number of meals per day, and begging. The only
perceptible differences, although marginal, were seen in the provision of casual labour among MV clients (43% compared with 47% among the non MV-clients.
5.0. MICRO-VENTURES AND MICRO-LOAN OUTCOME INDICATORS
Micro-ventures and Micro-loan Foundation outcomes data includes (a) reported incomes, (b) reported expenditure, (c) proportion of income that is reported as accruing to the household from MLF or MV activities, and (d) household assets ownership. The findings for clients are compared with those for non-clients.
The data sets on MV and MLF outcomes are largely informed by the poverty reduction objectives that the MLF and MV components seek to achieve. In particular, household income, consumption and levels of asset accumulation form the proxies for welfare, and hence the poverty reduction effects of these initiatives. Other operational data such as loan size, number of loans accessed and whether or not clients feel the MV or MLF businesses contributed to increasing household incomes are also presented.
5.1 Size of Loan per Household
The provision of loans is based on group collateral, underlining the importance of social capital in reduction of risk of default. Groups are expected to start repaying within two weeks of taking the loan. Loan interest is charged at 20% 9. Group investment activities are rare, with members splitting the group loan amongst the members, and starting a small business and contributing re-payment of the loan to the group at scheduled times. These individual ‘repayments’ are subsequently paid to Micro-loan Foundation.
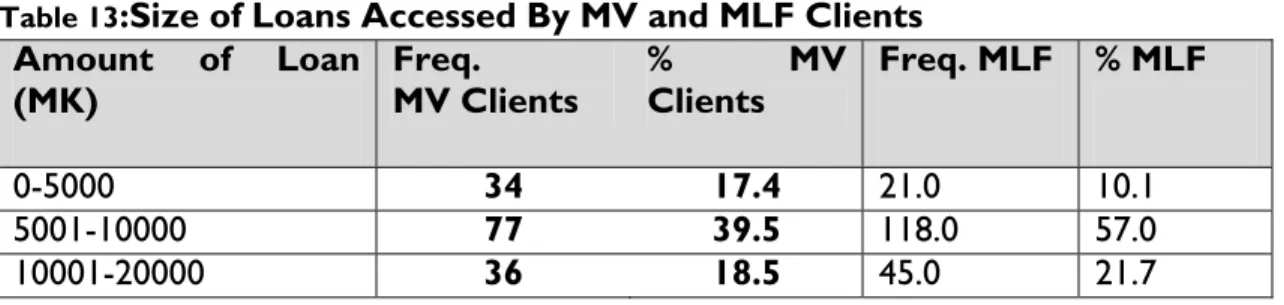
The survey found that the size of loan reported per household ranged from MK 2,400 MK 190,000 among the MV clients. The majority of MV households (75%) got loans of MK 20,000.00 (USD143) or less, with more than half (56%) reporting getting loan amounts of MK 10,000.00 (USD71) and less10. However, 20% of the MV clients reported getting loans of more than MK 50, 000.00 (USD357.00). Table 13 presents the details on size of loans.
Table 13:Size of Loans Accessed By MV and MLF Clients Amount of Loan
(MK) Freq. MV Clients % MV Clients Freq. MLF % MLF
0-5000 34 17.4 21.0 10.1
5001-10000 77 39.5 118.0 57.0
10001-20000 36 18.5 45.0 21.7
9 Discussion with Mr. Alfred Nkhoma, Microventures Manager. This is the total interest rate that has to
be paid on the principal by the group-i.e. not annual or monthly.
10 This may also have implications on the efficiency with which MLF/MV delivers its microfinance services.
20001-50000 9 4.6 20.0 9.7
50000+ 39 20 3.0 1.4
Total 195 100 207.0 100.0
Among the MLF clients, size of loan reported taken by households ranged from MK 2,000.00 to MK 100,000.00. Less than 1% of the clients borrowed more than 50,000 kwacha. However, a similar trend as in MV clients where the majority of the clients took what would be termed ‘small’ loans was observed. The bulk of the MLF clients (88%) accessed loans of MK 20,000 (USD143.00) or less. The survey results show that the majority of MLF households (67%) get loans of MK 10, 000.00 (USD70) or less-see Table 13 above.
Since the size of loan has a bearing on the extent to which the household can meaningfully invest and get returns on the investments made to some degree, the amount of loans reported by the majority of households appeared to only permit investment in petty trading, where markets also appeared saturated-see section below. This raises doubts on the extent to which households would be able to substantially increase their incomes and hence significantly improve their welfare.
Further, field observations by other researchers in Malawi showed that women who borrow these small amounts do so only to survive a particular time period, usually an agriculture season. Women will borrow money and start up a small daily or weekly income generating activity such as selling tomatoes or potatoes. This practice lasts for about a season, or 4-5 months, which is the total repayment period, after which the women are back to the same status. Similar observations were made during the MLF survey, which raises critical questions regarding loan amounts and its impact.
Thus, although an assessment of the viability of investments was not undertaken, this also has implications on the MLF and MV poverty reduction end, and may suggest the need for either increasing the group loan amount so as to improve the ability of the households to invest in high return ventures, or actively promoting pooled investment to improve the return on investment.
5.2 Number of Loans Received by Client
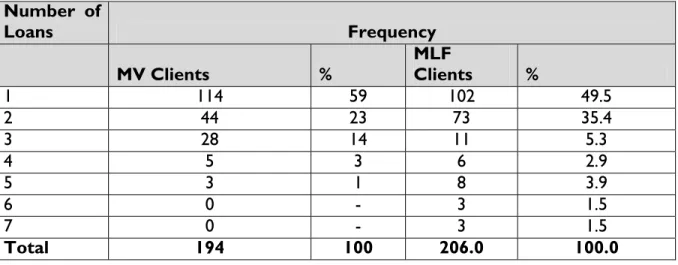
The number of loans the MV clients varied from 1 to 5. However, the bulk of the clients-144 households (59%) were in their first loan cycle, 44 households (23%) were in the second cycle and 28 households (14%) in the third cycle. A further 4% (8 households) were either in the fourth or fifth cycle-Table 14.
The number of loans obtained by clients since joining MLF initiatives ranged from 1 to 7 times. The majority of the clients 49.5% obtained one loan, representing 102 clients. Clients that received two loans accounted for 35.4% representing 73 clients. Table presents the number of loans received by clients.
Table 14: Number of loans received-MLF and MLF Clients Number of Loans Frequency MV Clients % MLF Clients % 1 114 59 102 49.5 2 44 23 73 35.4 3 28 14 11 5.3 4 5 3 6 2.9 5 3 1 8 3.9 6 0 - 3 1.5 7 0 - 3 1.5 Total 194 100 206.0 100.0
5.3. Main Business Carried Out
Main businesses carried out were reported to be agro-based, largely dealing in primary commodities and confectionaries. Except for fruit juice making and knitting that involved value addition among MV clients, farming and selling of agricultural produce was the most common business type reported, and accounted for 59%of the responses. These included maize, vegetables, rice, groundnuts, beans and other crops. Selling of groceries and snacks (including confectionaries), was the second most common business among MV clients and it accounted for 15% of the responses. Knitting and sale of fruit juice accounted for 5% and 4%, respectively. A number of other businesses including tailoring, selling herbal medicines, timber, quarry stone etc, accounted for a combined 7% of the businesses reported. It is noteworthy, however, that some clients were involved in more than one business activity ‘to spread the risks and improve profits’- Table 15.
Table 15: Common Businesses Carried Out By MV Clients
# Business* Type Frequency* %
1 Farming and Selling Produce 152 59 2 Selling Fruit Juice 10 4
3 Selling Fish 8 3
4 Grocery and Snacks/Food 40 15
5 Knitting 13 5
7 Selling Live Stock 7 3 8 Selling Second Hand Clothes 4 2
9 Other 19 7
Total 259 100
*With multiple responses
Among the MLF clients, the trend was the same as that for MV clients regarding the types of business activities undertaken. Approximately 30% of MLF clients (68 respondents) reported that they were engaged in selling farm produce. Twenty-four percent (24%) were engaged in retail activities, including groceries and hawkers, single commodity stands such as paraffin, diesel, cooking oil and others. These accounted for the second most common business type. Those clients engaged in selling second hand clothes/beddings and confectioneries accounted for 12% and 10.0%, respectively, and were the third and fourth most common type of business activity reported by MLF clients. Table 16 presents the details on type of business.
Table 16: Common Businesses undertaken by MLF Clients
Business* Type Frequency* %
Sale of Farm Produce 68 31
Baking (Scones, doughnuts
etc) 3 1 Snacks/Confectionaries 27 12 Beer Brewing 7 3 Retail (Grocery/Hawker) 52 24 Second Hand Clothes/Beddings 23 10 Timber/Firewood 7 3 Selling Fish 16 7 Selling Meat 4 2 Tea Room 3 1 Other 10 5 Total 220 100
*With multiple responses 5.4. Asset Ownership
Ownership of assets is one of the wealth indicators, and the MV and MLF activities may have a direct effect on the ability of households to acquire assets. The most common assets possessed by respondents were hoes, land, panga knife (matchet), axe, radio and chickens. Compared between the two groups of respondents (clients and non-clients), the proportion of people owning these assets was almost identical, with only marginal differences in ownership of some types of assets.
Results showed land ownership among the MV clients to be 89% versus 87% among the MV clients; chicken ownership was 66% among MV clients against 59% among non-MV clients, and ownership of land was 69% for both non-MV and non-non-MV clients. Marked differences were only observed in the ownership of axes (82% among MV clients against 67 among the non-MV clients) and ownership of panga knife/matchet with 83% of MV clients versus 74% among the non-clients. Table 17 summarizes asset ownership among MV clients and non-MV clients
Table 17: Asset Ownership among MV and Non-MV Clients
Asset No Owning Asset No Owning Asset
Yes % of MV Yes % of Non-MV Chickens 129 65.82 116 59.18 Goat 57 29.08 51 26.02 Cattle 13 6.63 13 6.63 Land 176 89.80 171 87.24 Bicycle 114 58.16 99 50.51 Radio 136 69.39 136 69.39 Farm Cart 13 6.63 6 3.06 Plough 5 2.55 4 2.04 Axe 158 80.61 130 66.33 Hoe 186 94.90 177 90.31
Matchet (Panga Knife) 163 83.16 145 73.98
Bed 93 47.45 77 39.29
Tables, Chairs etc. 92 46.94 75 38.27 Television Set 8 4.08 6 3.06
Vehicle 2 1.02 2 1.02
Similar to MV and MV clients, the most common assets recorded for MLF and non-MLF clients were hoes, land, panga knife (matchet), axe, radio and chickens. The majority of the clients (94.4%) reported owning a hoe, 83.2% reported owning a panga knife, 81.7% reported owning an axe, 79.2% reported owning a radio, 73.6% reported owning a bed and 73.1% reported owning land. The proportion of households owning other high value assets such as television sets and cars was 5% among clients versus 2% among non-clients, while ownership of a car was almost similar for the two groups- about 1%. Table 18 presents the details of asset ownership amongst MLF clients and Non clients.
Table 18:Asset Ownership-MLF and Non-MLF Clients
Asset No Owning Asset No Owning Asset
Yes % of MLF Yes % of Non-MLF Chickens 115 55.3 98 46.7 Goat 24 11.5 32 15.2 Cattle 13 6.3 9 4.3 Land 152 73.1 143 68.1 Bicycle 112 53.8 104 49.5 Radio 165 79.2 159 75.7 Farm Cart 7 3.4 4 1.9 Plough 10 4.8 8 3.8 Axe 170 81.7 157 74.8 Hoe 197 94.7 180 85.7
Matchet (Panga Knife) 173 83.2 143 68.1
Bed 153 73.6 133 63.3
Television Set 10 4.8 4 1.9
Vehicle 3 1.4 2 1.0
The trend of asset ownership among non-clients was similar to clients with the bulk of the non-clients reporting possession of land (68%), radio (76%), hoe (86%) and bed (63%). Again, except for high value assets such as customary land, TV sets, ploughs and cars, most of the other assets could be viewed as basic to any household. However, ownership of these assets may indicate the level of well-being of a household. Consequently, both MV and MLF activities may have a direct effect on the ability of households to acquire assets. As shown in the Table 24 some of the households that reported their income having increased among MV clients said they had used part of the additional funds to acquire assets. Nonetheless, it is worth noting that asset valuation in this survey was not possible due to the lack of information on how much of a particular asset the interviewees owned and the condition of the assets11. For example, if a client said “yes” to the question “do you own a bicycle?” we do not know whether she has 1 or 5 bicycles or whether the bicycle is in a usable condition.
11 Moreover, measurement issues (i.e. valuation) creep in as noted by Young (2005, p3) and Tschirley
5.5. Reported Monthly Income Levels
One of the areas where the MV program may have a direct bearing on is the household income level. The survey asked respondents to recall income earnings on cash incomes earned by the household from various sources. It is to be noted however, that the measurement of household income for the purposes of gauging household welfare is problematic. In this survey, the estimation was based on a two step approach that sought to (a) capture the total annual household income from all sources based on predetermined income sources, and (b) estimate the contribution of each of the sources to household income. In come contribution from each source was recorded. A weighted average was calculated to estimate the mean household income per month-Annex 2.
From the reported income, the survey found that average household income per month was MK 20,017.17 (USD143.00) or USD26.00 per capita12 per month among the MV clients. This is compared with MK 16,822.95 (approximately USD120.00) or USD22.00 per capita per month among Non-clients. Table 19 below presents the results of monthly household incomes for MV clients.
Table 19: Monthly HH Average Incomes-MV Clients
No Group Name Average Monthly HH Income*
MV Clients Non-MV Clients
1 Chigwirizano Group 922.11 773.21 2 Chombo Group 242.52 344.05 3 Thale Group 740.82 620.48 4 Chagwira Group 434.36 440.85 5 Michembo Group 662.67 305.26 6 Mthawira Group 1,419.12 1,085.80 7 Taphunzira Group 634.68 1,719.36 8 Kapala Group 1,209.61 2,656.12 9 Tatenda Group 2,318.88 152.91 10 Dwendo Group 724.15 423.61 11 Kanyenyezi Group 573.98 750.59 12 Tayambanako Group 1,356.12 602.04 13 Takumana Group 1,751.96 1,976.53 14 Tiyesenawo Group 1,124.79 1,384.20 15 Ufulu Irrgation Group 686.05 907.07 16 Ulemu Credit Group 2,546.15 1,316.92
12
17 Tiunikirane Group 203.48 107.99 18 Galamukani Group 2,465.73 1,255.95
Total 20,017.17 16,822.95
*Weighted average using the number of people per group interviewed/sampled. Figures are nominal
From Table 19 above, indicate only a marginal difference of approximately MK 3,000.00 between MV clients and non-clients. Compared with data from a baseline survey carried out in 2007, the average income levels from the 2008 survey was slightly higher (3.4%), but a direct comparison may not be meaningful as the difference may be as a result of inclusion of more respondents in the current survey than was the case in the 2007 one, as well as measurement issues13.
5.5.1. Contribution of Business to HH Income
The total incomes from each source were tabulated and the proportion of income contributed by each source based on the reported incomes calculated. Notwithstanding the data shortcomings, the survey found that the MV business was the second important source of household income (and accounted for about 18%) after ‘other businesses’ that accounting for 46% of household reported income. Sale of own farm produce (15%) was reported the third most important source of income. Salaries/wages of all adults in the household accounted for about 9%, while casual labour accounted for about 8%. Transfers from relatives were the least in terms of contribution to household income at 4% - see tables 20 and 21, and Annex 2.
Table 20: Sources of Income and Contribution to HH Income- MV Client Income
Source Total % Contribution of Source to
Total HH Income Total % Contribution of Source to Total HH Income Other Business 1,798,350.00 45.84 1,487,087.00 48.74 MV Business 703,133.00 17.92 0.00 0 Sale of produce 588,927.20 15.01 693,241.7 22.72 Salary 338,600.00 8.63 388,745.00 12.74 Casual labour 332,585.00 8.48 298,721.00 9.79 Transfers 161,769.67 4.12 201,338.00 6.6 Total 3,923,364.87 100 3,051,132.32 100
It is noteworthy that even among the non-MV clients, the proportion contributed by ‘Other businesses’ was the highest at about 49%, with sale of own farm produce as the second most important source of income (23%). Consequently, the structure of
13
household means of earning income appeared to be similar, and tended to allow for scope to deduce that the MV business is an important source of household income, not withstanding the data quality limitations.
Average monthly household incomes among MLF clients was estimated to be MK 38,908.00 (USD278.00) or USD51.00 per capita per month, and MK 23,331.38 (USD167.00) or USD30.00 per capita per month for non-MLF clients. Per capita monthly incomes for the MLF and non-MLF clients were MK 6,485.00 (USD46.00) and MK 3,889.00 (USD28.00), respectively. Table 21 below shows the estimated average household incomes among MLF and non-MLF households.
Table 21: Monthly HH Average Incomes-MLF and Non-MLF Clients
No. Credit Group Average Monthly HH Income*
MLF
Client Non-MLF Clients
1 Chanjo Credit Group 804.46 713.23 2 Chikondi Credit Group 4,336.97 1,682.91 3 Chimwemwe Credit Group 1,660.49 1,065.82 4 Chisomo credit Group 6,002.24 3,517.81 5 Chiyanjano 729.39 1,464.49 6 Lonjezo 2,064.14 1,618.47 7 Mwaiwidu 2,141.33 1,681.50 8 Mwawi Credit Group 4,500.00 1,114.07 9 Tayambanawo group 1,518.09 1,659.99 10 Tisamale Credit Group 2,237.73 1,342.47 11 Titukulane Group 3,543.97 1,867.75 12 Tiyanjane 3,114.56 1,267.34 13 Vitumbiko Credit Group 3,983.96 2,296.31 14 Yankho Credit Group 2,270.73 2,039.20
TOTAL 38,908.07 23,331.38
*Weighted average using the number of people per group interviewed/sampled. Figures are nominal
Taking into account the data limitations concerning household income estimation highlighted above, we note that there is a perceptible difference in average household incomes between MLF and non-MLF clients. How much of this difference is as a result of the MLF businesses could not be ascertained given the scope of the current study. However, it is understandable to deduce, as under the MV component that the MLF business contributed to this difference, given its estimated contribution of about 30% to household incomes among the MLF clients-see Table 22 below.