PRESERVING OPEN SPACE IN THE TRIANGLE:
WHERE CONSERVATION SUBDIVISION CAN MAKE THE GREATEST DIFFERENCE
BARBARA BEECHWOOD
A Masters Project submitted to the faculty of the University of North Carolina at Chapel Hill in partial fulfillment of the requirements for the degree of Masters of Regional Planning in the
Department of City and Regional Planning.
Chapel Hill 2006
Approved by:
ABSTRACT
BARBARA BEECHWOOD: Preserving Open Space in the Triangle: Where Conservation Subdivision Can Make the Greatest Difference
(Under the direction of Dr. Philip R. Berke)
This project is predicated on the need for more effective open space conservation tools in rapidly urbanizing regions. It recognizes the fact that it is essential for any viable solution to incorporate a win-win between development and conservation. Although a misunderstood and under utilized option, conservation subdivision development holds great potential to address multiple concerns for all of the stakeholders in the land development and conservation process.
ACKNOWLEDGEMENTS
This project was graciously supported by the following generous people:
Dr. Philip R. Berke, Professor of Land Use and Environmental Planning, Director of Graduate Studies, Department of City and Regional Planning, University of North Carolina, Chapel Hill. As my master’s project advisor, Dr. Berke’s patience was remarkable and his guidance indispensable.
Dr. Dean L. Urban, Professor of Landscape Ecology, Nicholas School of the Environment, Duke University. I am grateful to Dr. Urban for his review of the GIS maps, and his perspectives on the ecological functions of open space corridors.
Dr. George Hess, Associate Professor of Forestry, Department of Forestry and Environmental Resources, North Carolina State University. I am indebted to Dr. Hess for sharing his leadership experience with the Triangle GreenPrint Project.
Dr. Toddi Steelman, Assistant Professor, Department of Forestry and Environmental Resources, North Carolina State University. I am thankful to Dr. Steelman for her knowledge of the state open space and natural resource policy in the Triangle area.
TABLE OF CONTENTS
ABSTRACT... ii
ACKNOWLEDGEMENTS... iii
List of Tables and Figures... vii
List of Maps and Drawings... viii
Chapter 1. Introduction... 9
1.1 Statement of Purpose... 9
1.2 Organization of the Paper... 10
1.3 An Overview of the Issue ... 11
1.4 The Stakeholders ... 11
1.5 Some Possible Causes ... 12
1.6 Potential Solutions ... 12
1.7 Summary ... 13
Chapter 2. The State of Open Space in the US... 14
2.1 An Introduction to Open Space Conservation... 14
2.2 The Functions of Open Space in Metropolitan Regions... 16
2.3 Linking Open Space in Metropolitan Regions... 17
2.3.1 Regional Open Space Linkage across States ...18
2.3.2 Metropolitan Area Open Space Linkage...19
2.3.3 Local Open Space Corridors...21
Chapter 3. Open Space Conservation in the Triangle... 23
3.1 Land Use Change in the Triangle Area of North Carolina... 23
3.2 The State of Open Space Conservation in the Triangle ... 25
3.2.1 Plans, Programs and Initiatives: Statewide Efforts ...25
3.2.2 Plans, Programs and Initiatives: Regional and Local Efforts...28
3.2.3 Barriers to Successful Open Space Conservation Efforts ...31
Chapter 4. Identifying Priority Lands... 33
4.1 Priority Lands for Conservation across the Nation... 33
4.2 Priority Lands for Conservation in the Triangle Area ... 34
4.2.1 Triangle Green Infrastructure ...34
4.2.2 Rank and Priority Protocols ...35
4.2.2.2 Other Ranking and Prioritizing Protocols ...38
Chapter 5. Conservation Subdivision Development... 40
5.1 An Introduction to Conservation Subdivision Development... 40
5.1.1 The Benefits of Conservation Subdivision Development ...41
5.2 The Conservation Subdivision Development Design Process ... 43
5.3 Distinctions between Cluster and Conservation Subdivision Development... 44
5.4 Criticisms of Conservation Subdivision Development ... 45
Chapter 6. Where Conservation Subdivision Can Make a Difference... 47
6.1 Selecting a Site to Maximize Benefits ... 47
6.2. Following the Triangle GreenPrint... 48
6.2.1 The GreenPrint Ranking Scheme...51
6.2.2 Finding the GreenPrint Target Area ...54
6.2.3 Linking Gaps in the GreenPrint ...56
6.2.3.1 The Movement of Natural Communities across Gaps ...58
6.3 Zoning and Subdivision Ordinances... 58
6.3.1 Zoning and Subdivision Ordinances for Conservation Subdivision ...58
6.3.2 Current Zoning and Subdivision Ordinances in the Target Area...61
6.3.2.1 The Conservation Management District ...61
6.3.2.2 Conservation Subdivision Ordinances in the Target Area ...64
6.4 Current Land Use in the Target Area ... 64
6.4.1 Current Subdivision Development in the Target Area...65
Chapter 7. Alternative Scenarios in the Target Area... 67
7.1 Creating Conditions Favorable to Open Space Linkage... 67
7.1.1 Designating a Conservation Management District ...67
7.1.2 Designating a Conservation Subdivision Overlay Zone ...68
7.2 Bailey’s Landing as a Conservation Subdivision Development ... 69
7.2.1 The Original Bailey’s Landing Tract ...69
7.2.2 Current Subdivision at Bailey’s Landing...71
7.2.3 Conservation Subdivision Development at Bailey’s Landing ...73
7.2.3.1 Step One - Identifying Conservation Areas ...73
7.2.3.2 Step Two – Locating House Sites ...75
7.2.3.3 Step Three – Aligning Streets and Trails ...77
7.2.3.4 Step Four - Drawing the Lot Lines...77
7.3 Increased Open Space Linkage at Meadowood and Crescent Ridge Townhomes ... 80
7.3.1 Current Conditions...80
7.3.2 Augmenting the Open Space Linkage ...82
7.3.3 The Potential for Wildlife Underpasses ...82
Chapter 8. Implementation Issues... 85
8.1 Design Issues and Recommendations ... 85
8.2 Market Issues and Recommendations ... 86
8.3 Smart Growth Issues and Recommendations ... 87
8.4 Environmental Issues and Recommendations ... 88
Appendix One: Principles for Green Infrastructure... 90
Appendix Two: Conservation Organizations... 94
Appendix Three: Examples of Conservation Subdivision Development... 97
List of Tables and Figures
List of Maps and Drawings
Map 1: Existing Protected Open Space……….48
Map 2: The Triangle GreenPrint ..……….49
Map 3: Wake County GreenPrint Rankings………..52
Map 4: Wake County GreenPrint – West Raleigh Greenspace Connector………...54
Map 5: Lake Johnson – Yates Mill Corridor……….56
Map 6: Target Area Zoning………...62
Map 7: Target Subdivisions………...65
Map 8: Baileys Landing Tract– 1999 Orthographic Photo………69
Map 9: Baileys Landing-Current Conditions……….71
Map 10: Meadowood Crossing and Crescent Ridge………..80
Map 11: Meadowood Crossing and Crescent Ridge-Alternate Design……….82
Drawing 1: Baileys Landing- Step One - Identifying Conservation Areas………...73
Drawing 2: Baileys Landing- Step Two – Locating House Sites………..75
Drawing 3: Baileys Landing- Step Three – Aligning Streets and Trails………...77
Chapter 1. Introduction
1.1 Statement of Purpose
Where can conservation subdivision development, a seldom used and much misunderstood tool for open space preservation, make the most difference in the rapidly urbanizing Triangle region of North Carolina, where open space is fast disappearing? Can it be sited in such a way to provide multiple benefits to a variety of stakeholders? This master’s project investigates the use of conservation subdivision development primarily as a tool for extending the open space infrastructure. However, it will also examine the use of conservation subdivision as a tool for controlling and directing development, as an opportunity for developers seeking to maximize amenities while minimizing costs, and as an attractive option for homebuyers. I propose this process of site selection as a series of deliberate choices that will lead to multiple benefits and I will illustrate it with several local examples.
preferences, which I will recommend to be placed within a Conservation Subdivision Development Overlay Zone. I will also examine parcels at this locale that were not developed under conservation subdivision design standards and offer an alternative scenario.
1.2 Organization of the Paper
concludes the discussion with recommendations for implementation and implications for other areas. Particular attention is given to the role civic leadership and commitment. Following the chapters, there are three appendices that may interest the reader that give details on the principles, processes and organizations involved in this study.
1.3 An Overview of the Issue
In regions experiencing intense growth pressure, like the Triangle area of North Carolina, the task of preserving the remaining open space is challenging. Although open space is quickly disappearing in the Triangle area, there is still undeveloped land beyond the outer ring subdivisions that is available for conservation and opportunities still exist to piece together parcels of open space within more densely developed areas. However, the window of opportunity to acquire the remaining open space is quickly closing because of aggressive development and sharply rising land values.
1.4 The Stakeholders
the process. They can either leapfrog over existing growth boundaries or take their projects to communities with less land controls in place. Although homebuyers increasingly indicate that they prefer the amenities that accrue from open space near where they live and work, developers feel that the consumers will not pay the price premium required to provide it. Environmental, economic and social losses across the Triangle are the result.
1.5 Some Possible Causes
Outdated zoning and subdivision regulations bear much of the responsibility for the damage both to smart growth strategies and to creative approaches to open space conservation. In addition, most comprehensive plans have failed to address the situation adequately. “Each time a property is developed, an opportunity exists for adding some of that land to a community-wide network of open space. Although such opportunities are seldom taken in many municipalities, this situation could be reversed fairly easily by making several small but significant changes to the comprehensive plan, the zoning ordinance and the subdivision and land development ordinance.”1
1.6 Potential Solutions
of the country to create a win-win between development and conservation. Among the most successful, yet least understood and practiced, is conservation subdivision development. Hallmark strategies of conservation subdivision design are an initial environmental inventory, a typical open space set-aside of between 40-60% of the total parcel for permanent conservation, and a clustering of the buildable sites into a modest footprint. These open space easements could be sited in such a way as to link, augment or buffer the regional green space network. There are benefits for all stakeholders in the conservation subdivision process - landowners, developers, consumers, conservation organizations, municipal staff and elected officials - not to mention benefits for the environment.
1.7 Summary
Employing a wide array of open space planning techniques simultaneously, over an extended period, can significantly improve an urban community’s success. Their open space conservation “toolbox” should contain a variety of conservation techniques including the purchase of development rights; donations of sales to conservancies; the transfer of development rights; and “landowner compacts” involving density shifts among contiguous parcels. However, these strategies are time and money intensive. Since it is likely that most parcels of land in any given community will eventually be developed anyway, “employing conservation subdivision design along with other preservation strategies offers communities the most practical, doable way of protecting large acreages of land in a methodical and coordinated manner”.2
1
Randall Arendt, Growing Greener (Washington, DC: Island Press, 1999).
2
Chapter 2. The State of Open Space in the US
This chapter will provide a brief introduction to open space and an overview of the state of the science across the nation. The special functions of open space in metropolitan regions will be examined with emphasis on the particular difficulties of linking open space in densely urbanized areas.
2.1 An Introduction to Open Space Conservation
In the last two decades of the 21st century, about 34 million acres of rural lands were converted to developed uses. That equals an area of open space the size of Illinois. By 2001, the total developed area in the contiguous United States was slightly more than 106 million acres.3 The rate of rural land conversion continues to increase. The rate of development between 1992 and 2001 averaged 2.2 million acres per year. This was an escalation from the 1.4 million acres per year developed in the previous decade (1982 - 1992). The most recent trend of significance has been the spread of development primarily into forested land. Of the 9 million acres developed between 1997 and 2001, 46 percent came from forestland.4 During this same period, the conversion of cropland, pastureland and rangeland continued their steady decline (See Table 1). In brief, we are loosing green space, especially forested land, to the built environment at an accelerating clip.
3
Natural Resources Conservation Service, National Resources Inventory 2001: Urbanization and Development of Rural Land (Washington, DC: NRCS,[2003]).
4
Table 1. Sources of Newly Developed Land Across the US in Thousands of Acres.
(Source: National Resources Inventory)
On a national scale, are efforts to protect open space keeping pace with the number of green fields lost to development? Is there some kind of meaningful measure to determine how much dedicated open space is enough? These are not easy questions to answer. Figures on how many total acres of open space are under protection in the US are not readily available.
There are approximately 650 million acres of federally owned natural resource lands across the country:
o 192 million acres managed by the Forest Service
o 270 million acres managed by the Bureau of Land Management o 80 million acres managed by the National Park Service
o 90 million acres managed by the U.S. Fish and Wildlife Service
drawing the distinction between the many levels of protection. The use of our public lands is a hot topic across the nation and on Capitol Hill.
A reliable figure for regional, state, local and privately held conservation lands is no easier to arrive at. An increasing number of states have statewide open space initiatives, but most still do not.
One indication of the national interest in open space preservation might be the recent upwelling of new conservation organizations and land trusts. For a list of national land conservation organizations, see Appendix 2. There are a fewer regional open space conservation efforts, with some of the larger ones encompass several states. Typically, these regional initiatives target a specific conservation priority area. A list of regional land conservation organizations can be found in Appendix 2.
2.2 The Functions of Open Space in Metropolitan Regions
viability of working lands.5 Besides these ecological functions, open space also defines a sense of place and celebrates regional heritage. Trees and town commons have traditionally been a defining element in the American urban landscape.6 Rivers and streams have historically served as transportation and commerce networks linking communities within watersheds corridors to a common identity.
Open space can also function as a development management tool, where designated green spaces are strategically located to act as a barrier to growth. One of the most ambitious and well-known examples is the green belt surrounding Toronto, Ontario.7 Dubbed “The Greater Golden Horseshoe”, this type of greenbelt is serving as an urban growth boundary. While they are intended as areas of reduced density, greenbelts are not explicitly conservation tools and certainly not an indicator of permanent ecological protection. Green belts are typically used to:
o Check the unrestricted sprawl of built-up areas
o Safeguard the surrounding countryside from further encroachment o Prevent neighboring towns from merging into one another
o Preserve the special character of historic towns o Assist in urban regeneration
2.3 Linking Open Space in Metropolitan Regions
Green Infrastructure is the Nation's natural life support system - a strategically planned and managed network of wilderness, parks, greenways, conservation easements, and working
5
Thomas Campanella, ed., The Republic of Shade, First ed. (New Haven, CT: Yale University, 2003).
6
lands with conservation value that supports native species, maintains natural ecological processes, sustains air and water resources, and contributes to the health and quality of life for America's communities and people (See Appendix 1 – Principles for Green Infrastructure). The Green Infrastructure network encompasses a wide range of landscape elements, including natural areas - such as wetlands, woodlands, waterways, and wildlife habitat; public and private conservation lands - such as nature preserves, wildlife corridors, greenways, and parks; and public and private working lands of conservation value - such as forests, farms, and ranches. It also incorporates outdoor recreation and trail networks.8
2.3.1 Regional Open Space Linkage across States
Linking large open space tracts (state forests, wildlife reserves and game lands) on a regional level is challenging. It is especially so in urbanizing areas and where they cross state lines. Consider the coordination required between various governmental departments and agencies, as well as non-profits. When states are leveraging federal funds, it complicates matters further. In this arena, the leadership of elected officials is mandatory.
An excellent illustration is “Natural Connections: Green Infrastructure in Wisconsin, Illinois & Indiana”, a collaboration to support natural resource protection and land preservation efforts across parts of three states.9 Regional cooperation on this scale relied on the generosity and collaboration of scores of individuals and associations: over 50 partner-organizations are
7
Ontario Ministry of Public Infrastructure Renewal, "Places to Grow,"
http://www.pir.gov.on.ca/userfiles/HTML/cma_4_40902_1.html (accessed March, 2006).
8
listed. During the early planning process, the Natural Connections initiative identified obstacles to protecting natural resources that cross state lines and strategies for overcoming them. For example, lack of information about natural resources across jurisdictional lines was a major obstacle to cooperative efforts to protect the resources. Land use data was inconsistent from county to county, much less from state to state. One of the greatest needs was for a map and regional database that provided foundational information on green infrastructure across the three-state / fourteen county region. Five teams of green infrastructure experts were brought together. Massive data collection was undertaken, ultimately resulting in 175 layers of data. Because different agencies collect their data at different scales and projection levels, it all had to be normalized to a uniform projection and scale—a task that had never been done before on that level. The results consisted of an accessible data archive and maps identifying the most promising opportunities for bi-state cooperation, highlighting important resources that lie along the Wisconsin-Illinois and the Indiana-Illinois borders. All of this work was the necessary prelude to making specific recommendations for protecting and managing these resources through cross-border coordination. The Natural Connections project will significantly facilitate regional decision-makers across the tri-state area in their efforts to conserve open space effectively.
2.3.2 Metropolitan Area Open Space Linkage
Successful "green infrastructure" efforts require non-traditional, broad-based alliances and approaches that cross boundaries and jurisdictions, connect people to the land in a variety of ways, and use a variety of approaches. Linking large open space tracts between or within local
municipal boundaries is especially challenging in urbanizing areas. However, with the reduced levels of bureaucracy, it is not as formidable as regional open space planning across state lines. The same coordination is required between various governmental departments, agencies and non-profits. The same committed leadership of elected officials is needed to champion the project and contribute funding.
Typically, motivation to cooperate usually comes from a mutually identified priority land that lies athwart a shared boundary. The New Hope Creek Corridor Open Space Master Plan (1991) and the Little River State Park (2005) are two examples of the joint efforts of Orange and Durham Counties. These two counties are located in the Triangle of North Carolina, a swiftly urbanizing area. However, these two examples are stand-alone parks, not linkage efforts. Additionally, they are examples of riparian land conservation, which usually garners more support than other forms of open space due to the higher visibility of water quality concerns. Linking existing city parks, lakes and preserves has proven more daunting when it is not along a riparian corridor. The obvious hurdle is the existing development (residential, commercial or industrial) that separates the public lands attempting to be linked.
Any linkage of open space across municipal boundaries will need a green infrastructure plan or a green print similar to that created by the Natural Connections initiative in Illinois to guide the local decision makers. Over the past five years, the Triangle J Council of Governments (TJGOG) has accomplished this - a green print for the Triangle area of North Carolina. Although on a greatly reduced scale, the Triangle GreenPrint provides an accessible data archive and maps identifying the most promising opportunities for open space preservation in the Triangle.10 It is North Carolinas first attempt at a regional green infrastructure and is discussed more fully in
10
Chapter 3. A larger, statewide green infrastructure database is in process, compiled by One North Carolina Naturally.11
A comprehensive national resource for green infrastructure projects can be found at
www.greeninfrastructure.net. This site includes examples of green infrastructures from around
the country. It is a partnership between The Conservation Fund and the USDA Forest Service and is a clearinghouse for green infrastructure information.
2.3.3 Local Open Space Corridors
Greenways are becoming one of the most popular forms of urban open space. Part of the reason for this is that they fill multiple open space needs as they connect people and places together. These corridors of land are commonly thought of as places to walk or bike within an urban environment, and trails are often their central component. However, beyond park and trail amenities, these ribbons of open space can also serve as a "green infrastructure" component of communities. Greenways conserve open space close to where people live and work, soften the patterns of urban growth, mitigate water and air pollution, protect wildlife habitat, promote economic growth and improve the quality of everyday life. They are often situated to buffer creeks and rivers, reducing the impacts of flooding in floodplain areas. They are sometimes used to link larger open space tracts. Greenways can also protect cultural and scenic resources such as historic canal corridors and celebrated view sheds. Greenways are popping up across the county in combination with Rails-to-Trails projects.
11
Greenways can incorporate positive outcomes for: o Recreation
o Transportation o Health
o Economic revitalization o Education
o Environmental concerns o Floodplain management o Quality of life12
Taking a comprehensive look at the state of open space at multiple of scales set the stage for a discussion of regional green infrastructure and how open space functions in metropolitan areas, along with its particular challenges. The following chapter will continue to extrapolate this information down to the local level.
12
Chapter 3. Open Space Conservation in the Triangle
In order to grasp the various regional, metropolitan and local open space efforts in the Triangle (the focal area for this project), a review of the dynamic character of land use in the area is needed. The Triangle Region is a rapidly urbanizing area in the Piedmont of North Carolina whose population has tripled since 1950. Currently more than 1.3 million call this region home, and that number is expected to swell to 1.5 million by the end of this decade.13
3.1 Land Use Change in the Triangle Area of North Carolina
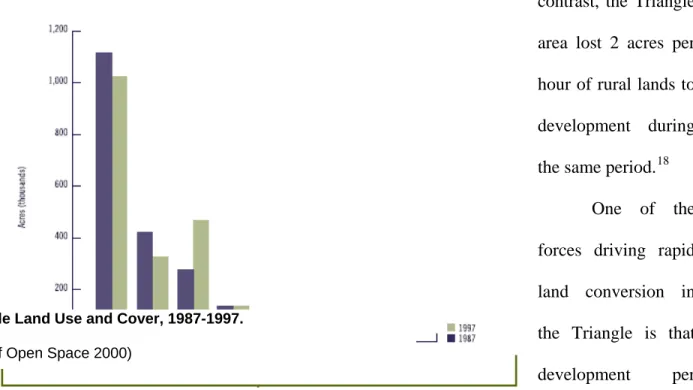
The pace of population growth and its associated development are transforming the Triangle, a region with over 2 million acres of land divided among the counties of Chatham, Durham, Johnston, Lee, Orange, and Wake.14 Between 1987 and 1997, the Triangle Region converted 190,500 acres of previously undeveloped land into new residential subdivisions, office parks, shopping malls, highways, schools and other commercial uses (See Figure 1). This represents a 70% increase of developed land in one decade. Following the national trend, the majority of this newly built environment (68%) came from forested land.15 The lush countryside of forests and fields that once covered this region is quickly being replaced by hardscape.
Protected open space makes up a much smaller portion of this region than developed land. Of the 2.1 million acres of land in the Triangle, 22% is developed land (residential, industrial, commercial, and institutional) and only 6% is protected open space, according to 1997
13
State Demographics Unit, "North Carolina Demographics," http://demog.state.nc.us/ (accessed March, 2006).
14
George Hess, Kate Dixon and Mary Woltz, The State of Open Space 2000 (Raleigh, NC: ,[2000]).
15
figures. More importantly, the rate of green fields being consumed by development is significantly outpacing the rate of green space being conserved. In 2000, there was a total of 146,068 acres of protected open space in the combined Triangle counties of Chatham, Durham, Johnston, Lee, Orange, and Wake.16 By 2005, the Triangle had a total of 163,600 acres of protected green space.17 That represents an average of 3500 acres protected per year. By contrast, the Triangle area lost 2 acres per hour of rural lands to development during the same period.18
One of the forces driving rapid land conversion in the Triangle is that development per capita has soared. In other words, not only has the Triangle’s population tripled since 1950, but also three times as much land is urbanized for each new person living in the Triangle’s urbanized areas. Simply put, people in urbanized areas are using increasingly more land with each successive decade.19 (See Figure 2)
Figure 1. Triangle Land Use and Cover, 1987-1997.
(Source: State of Open Space 2000)
16
ibid
17
Triangle J Council of Governments, Triangle GreenPrint Progress Report (Raleigh, NC: ,[2005]).
18
Triangle J Council of Governments, Triangle GreenPrint Open Space Assessment
19
Figure 2. Developed Land per 1000 People Living in the Triangle’s Urbanized Areas from 1950 – 1990.
(Source: US Census Bureau)
3.2 The State of Open Space Conservation in the Triangle
3.2.1 Plans, Programs and Initiatives: Statewide Efforts
Million Acre Initiative
title interest or conservation easements by federal, state, local, or private non-profit land managing organizations. At the end of the sixth full year of the North Carolina Million Acre Initiative (Jan. 1, 1999 – Dec.31, 2004), private and public land protection partners across the state had permanently protected 352,090 acres towards the million sought.20 Given the current rate of land acquisition, they are not on track to meet their goal (See Figure 3). They cite the lack of public and private funding for new protection projects as the primary barrier.
Figure 3. Progress Towards NC’s Goal of a Million Acres of Permanently Protected Open Space by 2009.
(Source: Million Acre Initiative Annual Report 2005)
Land for Tomorrow
Land for Tomorrow is a diverse partnership of businesses, conservationists, farmers, environmental groups, health professionals and community groups committed to securing support from the public and General Assembly for protecting land, water and historic places. Land for Tomorrow is asking the General Assembly to enable a bond issue for $200 million a year for five years to preserve and protect its special places, helping the state reach its goal of
20
conserving a million acres (House Bill 1687 or Senate Bill 1046).21 Their primary focus is coordinating efforts towards conservation funding.
NC Conservation Network
The North Carolina Conservation Network is a statewide network of over 120 environmental, community and environmental justice organizations focused on protecting North Carolina’s environment and public health. The NC Conservation Network supports, trains and coordinates diverse groups and directly advocates to achieve equitable and sustainable solutions for our environment. Launched in 1998, their primary role is conservation advocacy,22 and they pay special attention to open space conservation.
One North Carolina Naturally
One North Carolina Naturally is a comprehensive statewide conservation plan that involves the public, governmental agencies, private organizations, and landowners in an effort to maintain functional ecosystems, biological diversity, and working landscapes through the stewardship of land and water resources. One North Carolina Naturally is part of a larger effort by the State to implement a plan that will conserve and restore the State's natural heritage. This online resource hosts an online GIS mapping tool, decision support, and a comprehensive list of statewide conservation planning resources. Their primary focus is supporting a collaborative planning effort that reflects a statewide coordinated green infrastructure.
(Raleigh, NC: NCDENR,[2005]).
21
Conservation Trust for North Carolina
The Conservation Trust for North Carolina is a non-profit statewide conservation organization. Their mission is to protect the state’s land and water through statewide conservation and cooperative work with land trusts to preserve our natural resources as a legacy for future generations. The Conservation Trust works directly with landowners, local land trusts, and government agencies to protect land and water resources most important to local communities throughout the state. The Conservation Trust is an umbrella organization that provides a wide array of technical and financial services to the state’s network of 23 local and regional land trusts. Services include grants and loans; legislative advocacy; public relations; management of contracts; and information exchange.
3.2.2 Plans, Programs and Initiatives: Regional and Local Efforts
Triangle GreenPrint
Triangle J council of Government’s GreenPrint project is an attempt at regional open space planning and has met the same resistance as other regional planning efforts. The GreenPrint project began in 2000 with a snapshot of current open space conditions23, followed in 2002 by a comprehensive regional open space assessment24. The following year, they conducted
22
North Carolina Conservation Network, "History and Goals," http://ncconservationnetwork.org/
23
Hess, Dixon and Woltz, The State of Open Space 2000
24
an extensive outreach, presenting their findings in their 2003 report25. In 2005, they issued an update, highlighting scaled down goals and calling for increased funding26.
The Triangle GreenPrint project also hosts the GreenPrint Tracker – a web based GIS utility for tracking current and planned investments in green space protection and trails development in the Triangle.27 The Tracker’s Achilles Heel is its dependence on local conservation program personnel to upload their newly protected open space to the regional map. Typical of most municipal planning offices, the regional perspective is a low priority. The GreenPrint Tracker has largely gone unused.
County Open Space Conservation Programs
Orange County’s Lands Legacy Program is the oldest municipal open space conservation program of the six-county Triangle area. The Lands Legacy Program was adopted by Orange County in April 2000. Administered by the Environment and Resource Conservation Department, the program’s mission is to help protect the county’s most important natural and cultural resource lands before they are damaged or lost to incompatible development activities. Utilizing a low profile approach and with very limited county funding, Lands Legacy brought over 1000 acres of open space under permanent protection in its first four years.28 Orange County also has a Master Plan for Parks, Recreation and Open Space. Additionally, they are collaborating with Durham County on the New Hope Corridor Open Space Plan.
25
The Triangle J Council of Governments, The Triangle GreenPrint Outreach Report (Raleigh, NC: ,[2003]).
26
Triangle J Council of Governments, Triangle GreenPrint Progress Report
27
Triangle Green Space Tracker, http://66.193.216.195/
28
Of the remaining Triangle area counties, only Wake has a dedicated, unified open space strategy – The Wake County Consolidated Open Space Plan. Durham County has a Trails and Greenways Master Plan, and manages all other open space needs through its priority area plans [New Hope Corridor (1991), Little River Corridor (2001), and East Durham Open Space (2006)]. Chatham County derives open space protection through its Comprehensive Parks and Recreation Master Plan. Lee County’s first open space plan will be completed in 2006 and Johnston County has no open space plan.29
Local Non-profits
The Triangle area also has a number of non-profit organizations working to protect open space. The best known is the Triangle Land Conservancy - a land trust for the six-county region which protects important open space—stream corridors, forests, wildlife habitat, farmland and natural areas—to help keep our region a healthy and vibrant place to live and work. Working since 1983, TLC has protected more than 7,000 acres of the most sensitive lands in the Triangle.30
The Eno River Association has worked actively since 1966 to protect the lands and waters along the Eno River and its tributaries, conserving almost 5000 acres in the process. The Eno River Association also engages in environmental education and advocacy.31
Since 1982, the Haw River Assembly has endeavored to “speak as a voice for the river in the public arena”.32 Primarily concerned with water quality, they are also working with state and
29
Triangle J Council of Governments, Triangle GreenPrint Progress Report
30
Triangle Land Conservancy, http://www.tlc-nc.org/
31
Eno River Association, http://www.enoriver.org/
32
federal agencies and land conservation groups (i.e., Haw River Land and Trails) to identify and preserve fragile ecosystems and larger intact pieces of land along the Haw.
Friends of Bolin Creek are primarily interested in conserving land in the Bolin Creek corridor. Only active since 2004, this group has already gained the approval of the Carrboro Board of Aldermen to adopt their concept plan for a future Bolin Creek Park.33
3.2.3 Barriers to Successful Open Space Conservation Efforts
The local political climate plays a significant part in the success or failure of local open space conservation efforts. The support of local elected officials is critical in both the planning process (plan creation and adoption) and implementation (funding, staffing, and facilitating the coordination with other plans and departments). Effective leadership can also pave the way for cooperation between adjacent municipalities when priority lands cross metropolitan boundaries. In almost every case, successful open space programs in the Triangle have enjoyed the leadership of their elected officials.
Just as essential to success is the involvement of a wide representation of stakeholders, in both the creation, implementation and monitoring of the open space conservation program. Commonly, this aspect is only paid lip service. Most open space plans produced in the past few years include a review of citizen participation in the planning process. However, upon closer inspection of the open space plans across the Triangle, stakeholder participation has typically been low in numbers and lacks diversity. This usually results in difficulties at the implementation stage.
33
The lack of either political leadership or stakeholder participation not only has the potential to undermine funding efforts (i.e., bond referendums), it can de-rail landowner involvement. Rural landowners in the Triangle have historically been reluctant to discuss divesting the ownership of their land for any reason with government officials. Open space acquisition rests squarely on landowner willingness, a fact that is often overlooked by public staff. Trust is paramount. Non-profits can gain landowner confidence by presenting a neutral face to the public, creating positive relationships, which they can leverage into conservation easements. The most successful open space conservation efforts are often created in partnerships. The newly created Little River State Park, whose boundary crosses the Durham and Orange county lines, is an excellent example of a successful partnership between the staff of both county offices and two local non-profit groups (Triangle Land Conservancy, Eno River Association).34
The forces affecting land use in this fast growing area of North Carolina present the usual challenges to development management strategies and conservation goals found in urbanizing regions. The Triangle area both benefits from a variety of open space conservation efforts at multiple levels and suffers from the typical barriers to successful implementation.
34
Chapter 4. Identifying Priority Lands
Identifying open space priority lands seems like an interesting mix of art and science. However, it is arguably the most important aspect of the open space preservation process. It is certainly the most contentious. A review of how this crucial decision-making process is handled across the country and at various scales is warranted.
4.1 Priority Lands for Conservation across the Nation
Decisions about what lands to conserve can result from political favoritism as easily as complex, landscape ecology metrics. It is a discipline still in its infancy, with a wide variety of experiments in conservation prioritization and implementation happening around the country. Without an overarching national framework, these well-intentioned plans and regulatory approaches amount to a regional and local patchwork and by themselves are not sufficient to slow the decline of natural resources, ecosystem functions, and green “quality of life” amenities. When conservation efforts are reactive, site-specific, narrowly focused or not well integrated with other plans, they become haphazard conservation, which is no better than haphazard development. If the current antidote to haphazard development is smart growth, then the solution to haphazard conservation might be "smart conservation" - strategically directing our nation's conservation.35
Benedict and McMahon make the case for a green infrastructure to guide the way. “When we think of infrastructure, we think of built infrastructure such as roads, electric power lines and
35
water systems as well as social infrastructure such as schools, hospitals and libraries. However, the concept of Green Infrastructure elevates air, land, and water to an equal footing with built infrastructure and transforms open space from "nice to have" to "must have”. At the same time, green infrastructure helps frame the most efficient location for development and growth - and related gray infrastructure - ensuring that developers, citizens, and communities capture the cost advantages of location and create and protect household and community.”36
4.2 Priority Lands for Conservation in the Triangle Area
Historically, the conventions used to identify open space priority lands for conservation in the Triangle area has followed the national trend, and has resulted in a collage of disconnected green spaces that do not function very well on a regional scale. Thus, opportunities to establish broader planning goals and preserve critical ecological functions and processes at the landscape scale have been lost.
4.2.1 Triangle Green Infrastructure
To be most effective for conservation purposes, potential priority lands need to be identified within the context of the regional green infrastructure as a whole. Launched by the Triangle J Council of Governments in 2002, the Triangle GreenPrint Project provided the first assessment of the Triangle’s current green spaces, and identified via local consensus the essential green infrastructure that ought to be protected as the Triangle grows. They compiled a database to show how it all fits together on a regional scale. They also currently host the “Triangle
Tracker” GIS map, and will upload new open space acquisitions that are submitted to the Tracker. In this way, it is intended that the Triangle area will have a regularly updated map of local green infrastructure with which to make land use decisions.
4.2.2 Rank and Priority Protocols
According to The Triangle GreenPrint Project, effective conservation planning is a two steps process: 1) determining the significance of potential sites, and 2) prioritizing the sites based on their significance and each organization’s conservation goals. The relative significance of a site (rank) is determined by its open space value – how important the site is in terms of its open space functions. The decision to protect a particular property (priority) involves an examination of other factors such as the threat of development, political considerations, and available funding.
Because most agencies involved in land protection have their own established criteria and system
of evaluating land protection projects, the GreenPrint focused on determining the relative
significance of the sites identified, leaving the task of prioritization to implementing
organizations.37
4.2.2.1 Triangle GreenPrint Ranking Process
open space under consideration. The ranking was set to determine how well sites met certain commonly held goals. For Workshop 1 (Parks, Greenways and Historic Areas), the goals were:
o Ability of the site to meet multiple goals and objectives o Connectivity
o Value as a destination o Uniqueness38
Each site was given a score of 1-5 for each of the above criteria. These scores were then added to create a single score for the site. Natural breakpoints allowed committee members to define and map high, medium and low categories. To avoid overemphasizing natural area and water quality functions, these characteristics were not included in the Parks, Greenways and Historic Areas scoring.39
In Workshop 2 (Natural Areas and Water Quality), the goals were: o Presence of rare or endangered species*
o High biodiversity* o Water supply watersheds
o Connectivity between protected areas o Wildlife corridors
o High quality waters
o Pristine areas / free from exotic invasive species o Unique or outstanding geologic sites
o Forest cover
37
Triangle J Council of Governments, Triangle GreenPrint Open Space Assessment
38
ibid
39
o Multiple objectives40
*data from NC Natural Heritage Program
Given the extent and complexity of the overall criteria needed to prioritize the sites, only the top two criteria from Workshop 2 were used in the ranking scores given in the report. This was done as an example to demonstrate how a more comprehensive ranking using all the criteria might be obtained. A raw score was obtained using:
o The number of rare species populations
o Number of rare and outstanding natural communities This raw score was weighted by:
o The health of the population or community
o The status of the species on federal or state endangered species lists o The rarity of the species globally or in the state41
Note: The raw rankings did not consider water quality or connectivity.
The results from Workshop 3 (Farm and Forest Land) involved land characteristics and a sustainability score. Characteristics of a successful rural resource community include:
o Natural resource factors o Market factors
o Family economic factors o Support service factors o Development factors o Heritage factors
40
ibid
41
o Other factors
Relative “sustainability” of site (still intact in 10 years): o Probably
o Maybe o Probably not42
4.2.2.2 Other Ranking and Prioritizing Protocols
Open space plans across the focal area all handle ranking differently. Ranking protocols are based on assessments, and these vary widely. For instance, the Town of Cary Open Space and Historic Resources Plan (2001)43 featured a thorough resource evaluation that was the result of two external reports and a Threat of Loss Analysis. The Town contracted with an ecological assessment firm to develop an inventory and database of significant natural and historic resources. A NC State University research team was hired to conduct view shed mapping of rural landscapes associated with two National Register historic districts, and to create visual simulations of conservation design scenarios. The latter will be an important tool for informing landowners on development techniques that can preserve open space resources. Town of Cary staff conducted a threat analysis to determine the most vulnerable open space parcels in the study area. This analysis will help determine Cary’s preservation priorities.
42
ibid
43
Seven miles down the road in Apex, the Parks, Recreation, Greenways and Open Space Master Plan (2001)44 cited no resource evaluation and identified priority areas based on input from citizen surveys. This was a plan strongly focused on the recreational use of green space.
Setting clear priorities about what open space to preserve, in what order, and at what cost is a daunting task for a municipal agency. The opportunity to draw on critical information like a regional database of natural heritage resources and a regional green infrastructure map are indispensable. Just as essential is public participation at all stages: planning, implementation, and monitoring.
44
Chapter 5. Conservation Subdivision Development
A thorough understanding of conservation subdivision development that includes its benefits and drawbacks is essential to an appreciation of what it can offer as a multi-purpose land use tool. Important distinctions need to be drawn between the type of conservation subdivision design that is capable of multiple functions, and those that are more limited in their utility.
5.1 An Introduction to Conservation Subdivision Development
permanently protected and potentially added to an interconnected system of green spaces and greenway corridors.45
Typically, the open space is permanently preserved via easement or dedication and managed through a homeowners association, land trust (or other conservation organization), or local government agency. In some conservation subdivisions, preserved areas have been leased to farmers for small-scale agricultural production, used for community gardens, and even used as community-owned horse farms.
5.1.1 The Benefits of Conservation Subdivision Development
The most obvious benefit is environmental. The community-at-large can benefit from conservation subdivision development. It can be a useful tool to help address local concerns regarding the loss of environmental resources, farmland and community character. Local governments can also use conservation subdivision development as a vehicle for creating community-wide open-space networks, reducing the need to purchase and maintain new tracts of public land. Establishing open-space networks and reducing impervious surface cover can benefit the community by providing new recreation opportunities, protecting wildlife habitat, maintaining the ecological and water filtration functions of wetlands and riparian areas, and reducing stormwater runoff and flooding.46 Environnemental benefits include:
o Protection for unique or fragile habitats
o Reduction of the pollution impacts of stormwater runoff o Aquifer recharge
45
Randall Arendt, Conservation Design for Subdivisions (Washington, DC: Island Press, 1996).
46
o Opportunities to link wildlife habitats
o Conservation values that are part of the planning process
o Meeting the goals of open space and community development plans
Randall Arendt, widely regarded as the leading authority on conservation subdivision design, feels that conservation subdivisions are “twice green” because they succeed both environmentally and economically.47 Benefits for the municipality include:
o Reduction in infrastructure and maintenance costs o Reduced demand to acquire new public parkland o Preservation of local character
o Enhancing the municipality’s quality of life, one of its chief assets in attracting quality businesses and in encouraging economic growth
Conservation subdivisions also target the growing consumer market for homes in natural settings with less property to maintain. Even with smaller lots, housing prices and resale values in conservation subdivisions compare favorably to those in traditional subdivisions. In fact, consumers have shown a willingness to pay a premium for the environmental amenities and quality of life that conservation subdivisions offer. Many people would gladly trade lot size for proximity to natural scenery.48 A recent study by Rachel and Stephen Kaplan at the University of Michigan supports this contention.49 Social and Recreational benefits to the consumer include:
o Reduces isolation and sprawl
47
Randall Arendt, "Enhancing Subdivision Value through Conservation Design," On Common Ground (Summer, 2001).
48
o Enhances community character o Promotes community involvement
o Provides the opportunity to network neighborhood trails and open space with the community at large
From the developer's perspective, conservation subdivision development offers lower development-related expenses with a high-quality, highly-marketable product as the end result. Having homes clustered on smaller lots reduces development costs since there are fewer trees to clear, less land to grade, and less road, water, and sewer infrastructure needed to serve the development. 50 Benefits for the developer and realtor include:
o Streamlines plan review process; reduces time and costs
o Adds valuable amenities that can enhance marketing and sale prices
o Increases resale value; homes in conservation subdivisions have shown to appreciate faster than those in conventional subdivisions
o Provides flexibility to encourage developers to create "Green Neighborhoods" o Decreases site development costs by designing with the terrain
5.2 The Conservation Subdivision Development Design Process
In conventional subdivision planning, the site development process typically begins with a brief suitability analysis that addresses three basic aspects of the site: slope, soil and hydrology. An assessment of these three site characteristics is usually mandated to ensure that basic state or
49
Laura Bailey, "New Market for Developers," University of Michigan News Service June, 2004.
50
municipal environmental codes are met. The goal here is to give the eventual homeowner some security regarding potential problems with flooding and the integrity of the foundation. Next comes determining the lot sizes and drawing the lot lines. This is widely considered the most important aspect of the design process, as it represents that way that developers see their land value realized. Commonly, developers have the land value tied to how large the individual lot size is, and therefore bigger is better. As a result, every square inch of “developable” land is carved up into lots, with the aim being not to “waste” any sellable square footage by keeping it open. Conservation subdivisions offer an alternative, by using a four step planning process that reverses the typical subdivision planning process. First, the open space is designated; second, the houses are sited; third, the roads and trails are planned; and fourth, the lot lines are drawn (For a complete description of the process, see Appendix 3).51 This re-ordering of the process makes it immediately apparent that the land value is tied to conservation. It illustrates what green building guru William McDonough means in his statement “Design is the first signal of intent”.52
5.3 Distinctions between Cluster and Conservation Subdivision Development
Rayman Mohamed summed up the distinctions between conservation subdivision design and cluster development thusly: "Conservation subdivisions are distinct from the mere clustering of lots where environmental concerns, aesthetics, history, and culture are given relatively short shrift."53
51
Gilroy, Conservation Subdivision Design: A Market Friendly Approach to Local Environmental Protection
52
William McDonough, Cradle to Cradle (North Point Press, 2002).
53
Randall Arendt highlighted three important distinctions. “First, it sets much higher standards for the quantity, quality, and configuration of the resulting open space.” 54 Typically, cluster ordinances require only 10 to 20 percent open space to be set aside. However, conservation subdivisions designate at least 50 percent (and sometimes as much as 70 percent) of the land as permanent, undivided open space. “Unlike most cluster provisions, this figure is based only on the acreage that is high, dry, flood-free, and not steeply sloped. Following this approach, a significant part of the community's important farmland or woodland resources (including terrestrial habitat) and its historic or cultural features can be protected."55
"Second, municipalities can exercise greater influence on the design of new conservation subdivisions.”56 Municipalities can encourage this flexible design approach (or even require it) where the Comprehensive Plan has identified the location of important resources. Establishing a conservation zoning overlay across the established focal area as well as offering density bonuses for land-conserving design could be an effective combination.
"Third, the protected land is also configured so that it will, wherever practicable, contribute to creating an interconnected network of open space throughout the community, linking resource areas in adjoining subdivisions and/or providing buffers between new development and preexisting parklands, state forests, game lands, wildlife refuges, or land trust preserves."57 This opportunity will be examined more closely in Chapter 5.
5.4 Criticisms of Conservation Subdivision Development
54
Randall Arendt, Growing Greener (Washington, DC: Island Press, 1999).
55
Randall Arendt, Growing Greener (Washington, DC: Island Press, 1999).
56
ibid
57
Common criticisms of conservation subdivision development include the following: Economic Criticisms
o Poor marketability (too expensive for developer to implement)
o Affordability (consumers will refuse to pay the premium for increased site amenities) o Confusion about terminology (open space, easement, etc.)
o Tax burden (who pays taxes on preserved lands?) Environmental Criticisms
o Produces haphazard, small green islands (not ecologically sustainable)
o Dubious habitat value (depends on the quality of the environmental assessment) o Who manages preserved lands (HOA lack the expertise)
o Need a green infrastructure plan (very expensive if not already in place) o Unrealistic (how will disturbance regimes be handled, i.e., fire??) Social Criticisms
o Exclusionary (when conserved land is privately held in common)
o Increased density will negatively affect traffic, noise, etc. with surrounding community Civil Criticisms
o No recognized benchmark or performance standards in place as a guide o Hard to Implement (need zoning and subdivision ordinances in place)
Chapter 6. Where Conservation Subdivision Can Make a Difference
If conservation subdivision development is to provide multiple benefits to a variety of stakeholders, it must be sited intentionally. The process starts with a series of site selection choices that maximize the environmental and development management objectives separately. These are then correlated, resulting in a range of potential sites that are most appropriate for a successful collaboration.
6.1 Selecting a Site to Maximize Benefits
This chapter will seek to identify those opportunities within the focal area where conservation subdivision can be used as a tool to acquire critical resource lands within a proposed interconnected green system. It will correlate the most significant open space areas that are proposed for protection with parcels that are situated to serve smart growth objectives at the outer ring of metropolitan development. It will further correlate the sites with those that are available for development, along with the applicable zoning and subdivision ordinances that are beneficial to land conservation. Parcels that meet these parameters will be identified and placed into a conservation subdivision overlay district. Characteristics to correlate for site selections:
1. Sites within highly significant open space areas that are proposed for protection 2. Sites within a target area located at the leading edge of urban development
3. Sites with applicable zoning and subdivision ordinances that are beneficial to land conservation
5. Sites within the target zone that have been recently developed and occupy or are adjacent to highly significant open space areas that are proposed for protection
6.2. Following the Triangle GreenPrint
According to Randall Arendt, conservation subdivisions should be sited within the context of the larger, green infrastructure of the area in order to realize the maximum ecological and social benefits and avoid haphazard conservation. If sited in this way, conservation subdivision has the potential to be a powerful tool to augment, buffer or link green spaces within an interconnected green system. In locating optimal sites within the six-county Triangle area where conservation subdivision would make this kind of difference for open space preservation, the green infrastructure of the area would need to be identified and studied.
A review of the existing open space in the Triangle area revealed that the current green infrastructure is incomplete and fragmented. Most of the existing open space follows riparian corridors along larger watersheds, punctuated by lakes, state parks, a recreation area and a natural area (see Map 1).
The feature of the GreenPrint Program known as the GreenPrint Tracker was intended to provide a consolidated repository of current open space GIS data, uploaded to the Tracker as parcels came under protection. While the Tracker data was current at the time of its inception in 2002, it has clearly not been updated comprehensively since then. As a result, its value as an information resource to open space planners is limited.
Map 1: Existing Protected Open Space
Map 2: The Triangle GreenPrint
6.2.1 The GreenPrint Ranking Scheme
The Triangle GreenPrint was analyzed in order to narrow the selection of best potential sites for conservation subdivision to significant open space areas that are proposed for protection. A review of the GreenPrint rankings of these significant open space areas produced a range of potential sites for conservation subdivision strategies.
It should be noted that there is no composite, overall ranking of the GreenPrint sites. The selected sites were ranked within the context of the three separate open space workshops that reflected their function (Parks, Greenways and Historic Areas; Natural Areas and Water Quality; Farm and Forest Land). Therefore, there were three separate ranking rubrics.
It should also be understood that the GreenPrint rankings for Natural Areas and Water Quality are incomplete. Using data from the NC Natural Heritage Program, the Natural Areas and Water Quality selections for the GreenPrint were chosen to reflect a wide range of ecological characteristics (presence of rare or endangered species, high biodiversity, water supply watersheds, connectivity between protected areas, wildlife corridors, high quality waters, pristine areas and/or areas free from exotic invasive species, unique or outstanding geologic sites, forest cover, and achievement of multiple objectives).58 However, due to time and budget constraints, the Natural Areas and Water Quality selections were only ranked for the presence of rare species populations and rare, outstanding natural communities.
A composite map was created with the results of all of the ranking protocols across the Triangle. Due to the enormous amount of data, the focal area was narrowed to include only Wake County (see Map 3). For the purposes of this study, only the three highest-ranking natural areas were individually broken out, with the remaining natural areas allocated into ranges of “moderate species rarity” and “low species rarity”. Similarly, for the Parks, Greenways, and Historic Areas, only the “very highly significant” selections were individually broken out, with the “highly significant” and “significant” selections remaining grouped. The GreenPrint rankings, although incomplete, provide enough information to determine selection sites reflecting the highest scores for species richness, species rarity, and outstanding natural communities. The GreenPrint rankings also identify sites that have superior value as potential linkage corridors.
58
Map 3: Wake County GreenPrint Rankings
6.2.2 Finding the GreenPrint Target Area
A review of the GreenPrint rankings in Map 3 revealed areas where parks and greenway sites overlapped natural areas. It suggested a noteworthy opportunity in the southeast Raleigh area where a “very highly significant” greenway patch (Lake Johnson-Yates Mill Corridor) coincides with one of the three highest-ranking natural areas (West Raleigh Greenspace Connection). The overlapping of these two types of open space is important because it represents an opportunity to conserve multiple characteristics and functions of open space. This has economic as well as ecological implications. Because this particular instance appears to be the highest ranked and most significant intersection across Wake County, it was chosen as the target area. Having identified the most highly significant open space area within Wake County that is proposed for protection, the first step in the site selection process is complete (see Map 4).
Map 4: Wake County GreenPrint – West Raleigh Greenspace Connector
6.2.3 Linking Gaps in the GreenPrint
Green corridors are most easily created by following the path of least resistance in tracking along the route of streams and creeks. This works well for a variety of reasons. Many urban and suburban areas already have some form of mandated water quality buffer. Combined with the usual prohibitions against developing on steep slopes or in floodplains, this sets the table for designating these riparian avenues as green space.
However, in some cases the riparian lands stop short of the areas we want to connect. This forces municipalities to try to acquire the upland in between, which is typically already developed. Map 5 focuses close attention on the gap in the Lake Johnson-Yates Mill Corridor. The area between the Dorothea Dix Hospital Land and Lake Johnson Metro Park is upland (between the Swift Creek Watershed and the Neuse River Watershed), and contains a major interstate highway, a school, several residential subdivisions, and a strip of commercial, industrial and institutional properties along busy Tryon Rd. There are also a number of small farms to the south of Tryon. This will be a challenging area to create a green linkage.
Map 5: Lake Johnson – Yates Mill Corridor
6.2.3.1 The Movement of Natural Communities across Gaps
The movement of species between large patches of natural habitat is certainly facilitated by a continuous green space corridor. However, unbroken natural areas are not an absolute necessity of survival for numerous plants and animals. In fact, many creatures commonly move between habitat patches, crossing dangerous and inhospitable areas in the process of moving between resource sources and sinks. Distance between the patches, the length of patch edge and inner patch size are important factors. The quality of the corridor habitat is significant (the size and density of the cover) and a redundancy of routes is essential.
Barriers to movement along corridors can be a mixed blessing; some species will be favored and some will be hindered. Sometimes barriers can prevent a predator from pursuing their prey, and sometimes it produces a gradual weakening of the genotype of a species via genetic drifting. A wide variety of responses can be expected.
6.3 Zoning and Subdivision Ordinances
6.3.1 Zoning and Subdivision Ordinances for Conservation Subdivision
mandatory in specific places. Designating conservation subdivision overlay zones is more effective in directing growth and preservation efforts, but more controversial.
It must be understood that conservation subdivision development is not a benchmarked technique and there are no performance standards associated with it. The distinction between conservation subdivision design and clustering design is routinely collapsed. The process needs to be flexible enough to be tailored to the needs of each particular community, but structured sufficiently to achieve significant conservation goals. Therefore, careful guidance through the planning process is critical for success. According to Randall Arendt, the progression begins with a review o f the community's three principal land-use documents: its comprehensive plan, its zoning ordinance and its subdivision regulations. Conservation subdivision and land development ordinances should contain:
o Procedures that strongly encourage dialogue between the applicant and the municipality before detailed plans are engineered
o A requirement for a context map showing all natural and manmade features surrounding the site
o A requirement for a site inventory of existing features upon which to base decisions regarding the development
o A required site visit by the planning commission members accompanied by the developer, with the site inventory in hand
o A four-step design process in which the conservation areas are determined first, before houses, streets, and lot lines are established
Zoning ordinances should contain:
o The ability for an applicant to obtain full density through a by-right (versus conditional use) approval process, but only when a conservation option is selected
o A requirement that protected lands in conservation subdivisions are comprised of at least 50% of the buildable ground, whenever the underlying density is one unit per acre or lower
o Strong disincentives to discourage “conventional” development, usually by reducing the density by half
o Restrictive covenants that ensure that the conservation lands are perpetually restricted from further development60
Arendt further recommends a thorough review of existing land use regulations, updating the comprehensive plan and/or open space plan to contain conservation goals. Municipalities should also consider adopting a map of prioritized sites for conservation along with ordinance revisions.61
59
Randall Arendt, Growing Greener (Washington, DC: Island Press, 1999).
60
ibid
61