STATISTICAL ANALYSIS OF TEMPORAL VARIATIONS
IN INDOOR RADON DATA USING AN ADAPTED
RESPONSE SURFACE METHOD
G.A. DAWODU*1, O.O. ALATISE2, AND A.O. MUSTAPHA2
1Department of Statistics, College of Natural Sciences, Federal University of Agriculture Abeokuta (FUNAAB), P.M.B. 2240 Abeokuta, Nigeria.
2Department of Physics, College of Natural Sciences, Federal University of Agriculture, Abeokuta (FUNAAB), P.M.B. 2240 Abeokuta, Nigeria.
*Corresponding author: [email protected] Tel: +2348033753735
to the occupants. It is responsible for about 55% of the total background radiation expo-sure of the general public. Globally, there is increasing awareness of the potential health risks associated with elevated levels of in-door radon. Inin-door radon has been estab-lished as an important risk factor associated with lung cancer in the exposed individuals (UNSCEAR, 2000).
Indoor radon concentration (RC) is influ-enced by several parameters, including exha-lation rates from surfaces of wall, roof and
ABSTRACT
Temporary variations in indoor radon data (IRD), comprising radon concentration (RC), air tempera-ture, relative humidity and barometric pressure were monitored hourly over a period of two months in a bungalow house in Abeokuta, Nigeria. A total of 1510 data was assembled and analyzed statistically using Shapiro-Wilk for normality test, response surface method (RSM) and adapted response surface method (ARSM) to investigate and model the influence of the meteorological parameters on the varia-tions of RC in indoor air. The overall results showed that RC varies widely over time and correlates positively with relative humidity and temperature, but negatively with barometric pressure. Specific results of the two response surface methods were compared and contrasted and the multiple linear regression model of the ARSM was highlighted and established as the appropriate method for analyz-ing IRD. ARSM was presented in an easily reusable form that can easily be adopted by researchers and data analysts.
Key words: ARSM, Indoor radon concentration, Response and Independent Variables, R package
and models (i.e. rsm(), lm() and glm()).
INTRODUCTION
Radon is a dense, colourless and odourless but radioactive gas that occurs ubiquitously in all natural environments. Its primary source is rock and soil grains where it is produced during the decay of its immediate precursor (radium). Following its produc-tion in the soil, radon is normally trans-ported into air by diffusion or pressure-driven convective means. Radon is relatively low in outdoor air but in indoor environ-ments it can accumulate to concentrations
Journal of Natural Science, Engineering
and Technology
ISSN:
Print - 2277 - 0593 Online - 2315 - 7461
floor; concentrations of 226Ra in underlying soil and building materials, and their poros-ities; dwelling ventilation rates; and mete-orological parameters (Seftelis et. al, 2007). Variability in these parameters may result in large variations in the indoor radon values, and it is an area of important research inter-est (Seftelis et al, 2007; Chege et al, 2009). Chege et al (2009) found that the influence of meteorological parameters on indoor radon is more than the influence of the type of building. It has also been documented that indoor radon concentration correlates negatively with air temperature and posi-tively with relative humidity (Ramola et al, 2000). In the present study the temporal variations in RC, air temperature, relative humidity and barometric pressure were monitored hourly over a period of two months in a bungalow house in Abeokuta, Nigeria. To the authors’ knowledge, no study on the relationships between RC and meteorological parameters has been re-ported from any part of Nigeria. Abeokuta is a town in the southwestern part of Nige-ria. It is generally underlain by granitic rocks, with many rock outcrops. In the local language of the inhabitants, Abeokuta means “beneath (or underneath) stone (or rock)”. Radon precursors (Radium, Tho-rium and Uranium) are generally more prevalent in granitic formations than in sedimentary formations (UNSCEAR, 2000; Chege et al, 2009).
In the present study, RC was measured si-multaneously with the meteorological pa-rameters of interest, i.e., temperature, pres-sure, and relative-humidity using a radon measuring device. All the output parameters of the measuring device were treated as in-dependent variables and subjected to rele-vant statistical tests, with a view to investi-gate their relative importance on the
meas-ure RC values. Adapted Response Surface Method (ARSM) is a “refinement” over the popular Response Surface Method (RSM) (Box et al, 2005; Fnides et al, 2011; Gelman, 2006; Gilmour, 2006; Khuri and Muk-hopadhyay, 2010; Moghadam and Khajeh, 2011; Nicolai and Dekker, 2009). It has some robust properties to usurp the presence of outliers and influential data entries (Stevens, 1984; Tan, 2006; Wong, 1994). It is envis-aged that its application in this work will provide more insight into the influence of meteorological parameters and the other variables on RC in indoor air better than what has been obtained in previous studies, e.g. in Chege et al (2009).
MATERIALS AND METHODS
In this study the temporal variations in the IRD and other meteorological parameters were monitored in a bungalow of four bed-rooms and one sitting room in Abeokuta, Nigeria. Only one bedroom was selected for continuous hourly monitoring over a two months and three days period (63 days). The room is about 3x3x4 m3 and has three large sliding glass windows for ventilation. The walls are made from cement blocks and the floor is made of polished granite stones.
RCs were measured using a commercial de-vice called Radon Scout Plus (SARAD GmbH Wiesbadener Straβe 1001159 Dres-den Germany). This device contains a solid state silicon detector that detects the alpha particles emitted by radon (and its decay products) following the passive diffusion of radon-laden air into the device’s diffusion chamber. The radon detector is equipped with sensors to measure other meteorologi-cal parameters, including air temperature (oC), Relative-Humidity (%) and Pressure (mbar), simultaneously along with the RC (Bq/m3). The output of the radon detector
also includes percentage error (%) associ-ated with each value of RC, Tilt (an indica-tion of relative movements of the device while in operation) and Region of interest (ROI), which is also a measure radon expsure.
RESULTS AND DISCUSSION
Characteristics of the Indoor Radon Data
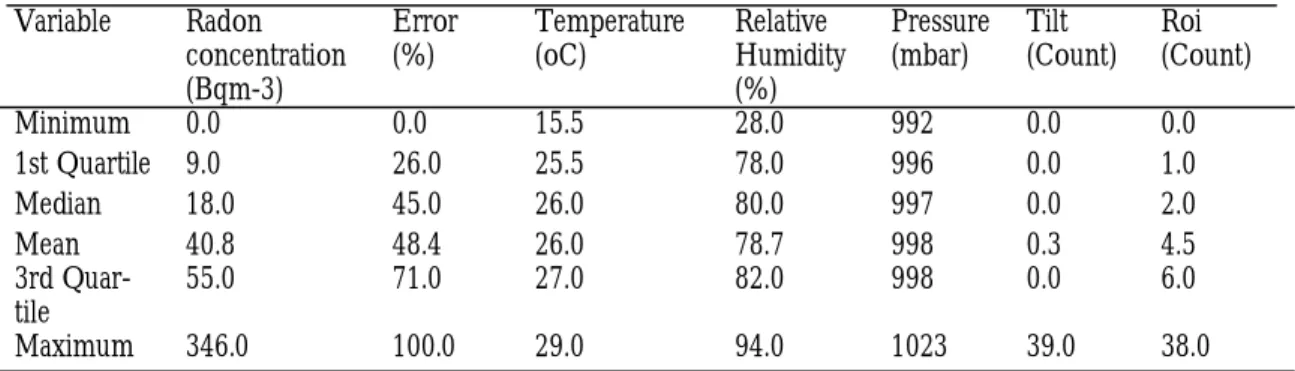
A total of 1510 IRD was assembled over a period of 63 days. It was observed that in-door RC varied widely over time. A sum-mary of the IRD obtained over this period is presented in Table 1.
Table 1. Summary of the raw IRD obtained from the survey Variable Radon
concentration (Bqm-3)
Error (%)
Temperature (oC)
Relative Humidity (%)
Pressure (mbar)
Tilt (Count)
Roi (Count)
Minimum 0.0 0.0 15.5 28.0 992 0.0 0.0 1st Quartile 9.0 26.0 25.5 78.0 996 0.0 1.0 Median 18.0 45.0 26.0 80.0 997 0.0 2.0 Mean 40.8 48.4 26.0 78.7 998 0.3 4.5 3rd
Quar-tile
55.0 71.0 27.0 82.0 998 0.0 6.0
Maximum 346.0 100.0 29.0 94.0 1023 39.0 38.0
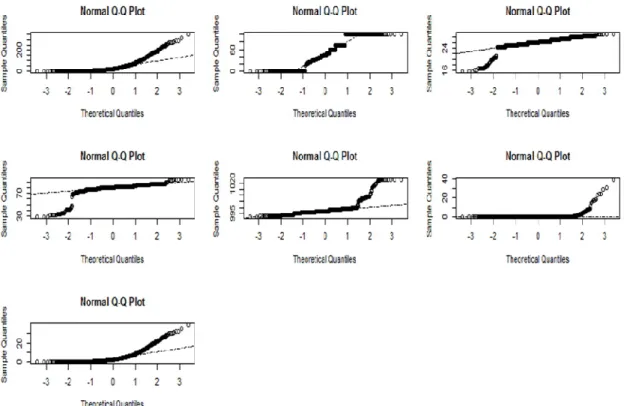
Test for normal distribution of the variables
In order to check if the variables conform to normal distribution assumptions accord-ing to Osborne and Waters (2002), normal distribution tests were carried out on the data, comprising radon concentration (Radon), error of radon concentration (Error), temperature (Temp), relative hu-midity (RelHum), barometric pressure (Pres), Tilt and ROI. The qqnorm () plots (Figure 1) and the Shapiro-Wilk normality tests (Table 2) show that all the variables are normally distributed, albeit with various de-grees of deviations. Error had the highest normality trait, followed by RC, ROI, Temp, Pres, RelHum, and Tilt, respectively. The p-values also demonstrate that the re-sults are sufficiently unlikely to have oc-curred by chance, i.e. they are statistically significant (Crawley, 2007).
Linear relationship between radon
con-centration and other variables
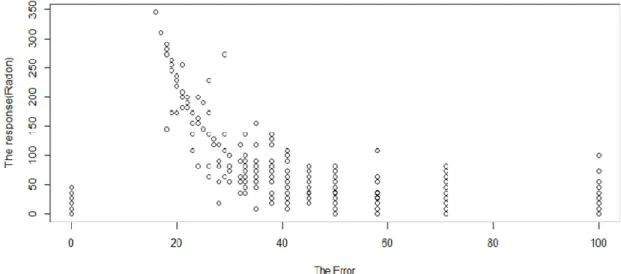
Correlation tests were conducted to investi-gate the pair-wise relationships between the variables. The linear relationship plots (Figure 2) and the corresponding correlation matrix table (Table 3) show that RC corre-lates positively with ROI, relative humidity, and temperature, but negatively with baro-metric pressure, error and tilt. The results of relationships between RC and the meteoro-logical parameters are in agreement with those reported by Ramola et al (2000) in some parts of India.
The strong correlation between RC and ROI is understandable since ROI is invariably a measure of RC over a specified time. Conse-quently there should be no need to include ROI in future statistical analysis of IRD. The error, on the other hand, is the uncertainty (in %) in the measurement of RC value.
the line of best fit and suggests the presence of an intrinsic model as shown on figure 2. The inclusion of Error as a variable is there-fore justified, also because a large number of the readings have 100% errors and hence it is a “quality assurance measure” to in-clude it in the list of independent variables.
It is also observed that only Error and Temp are devoid of outliers. All the other variables, including Radon concentration have outliers, and consequently the medians of those with outliers are the reliable measures of their central tendencies (Velleman and Hoaglin, 2004).
Figure 1: The qqnorm() plots of RC, Error, Temp, RelHum, Pres, Tilt and Roi, respectively in horizontal order.
Table 2. The results of the Shapiro-Wilk tests of normality on all variables.
Variable W p-value
Radon concentration 0.7472 <2.2 e-16
Error 0.9145 <2.2 e-16
ROI 0.7455 <2.2 e-16
Tilt 0.1353 <2.2 e-16
Pressure 0.6192 <2.2 e-16
Relative Humidity 0.5566 <2.2 e-16
Figure 2: Correlation between pairs of the IRD, showing lines of best fit.
Table 3: Correlation matrix for the variables in IRD
Radon
concentra-tion
Error Temperature Relative humidity
Pressure Tilt ROI
Radon concentration
1.0000
-0.2304
0.1798
0.2775
-0.2615
-0.0825
0.7175 Error -0.2304 1.0000 -0.0037 -0.0022 -0.0084 -0.0096 -0.1723 Temperature 0.1798 -0.0037 1.000 0.6128 -0.6868 -0.2841 0.1801 Relative
humidity
0.2775
-0.0022
0.6128
1.0000
-0.7238
-0.3957
0.2594 Pressure -0.2615 -0.0084 -0.6868 -0.7238 1.0000 0.2860 -0.2402 Tilt -0.0825 -0.0096 -0.2841 -0.3957 0.2860 1.0000 -0.0815 ROI 0.7175 -0.1723 0.1801 0.2594 -0.2402 -0.0815 1.0000
Statistical Analysis
Response Surface Method (RSM)
Response Surface Method (RSM) is the ap-proximate technique whenever there are no models capturing the relationships between a response and other variables (Gilmour, 2006). A review of RSM can be found in Khuri and Mukhopadhyay (2010). The RSM was adopted in the present study consider-ing that there were no existconsider-ing models gov-erning the relationship between radon con-centration and the variables of interest. The RSM was carried out to model the rela-tionships between RC and the other vari-ables based on the entire (raw) IRD, i.e. without sampling. The relevant statistics were obtained by executing the following operation:
Call:
lm(formula = (Radon ~ Error + Temp + RelHum + Pres + Tilt + Roi), data = radon)
This gives the residuals: 178.882; 21.170;
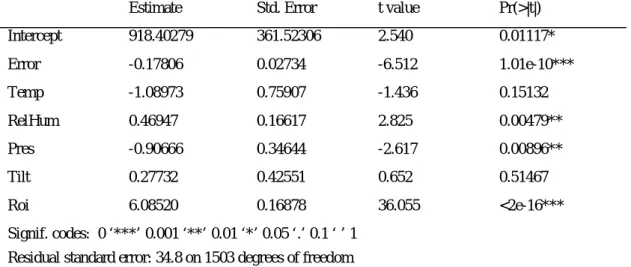
-1.142; 12.297; and 239.723 corresponding to Min, 1stQ, Median, 3rdQ, and Max, respec-tively. The coefficients and other statistics are given in table 4.
Results of the flat surface model of the IRD (without sampling) on R were obtained and coefficients were fitted to a model equation: Radone= 918.40279 – 0.17806Errore – 1.08973Tempe + 0.46947RelHume – 0.90666Prese + 0.27732Tilte + 6.0852Roie
(1)
Table 4 shows that the variables with the least significance to the model are Tilt and Temperature, which means that the two vari-ables could be eliminated with the least ef-fect on the model. This is in agreement with the result of correlation presented earlier (Table 3).
Adapted Responsive Surface Method (ARSM) – Reclassification to obtain class representatives:
The use of the word “Adapted” in this work was justified by reclassifying the IRD such that the cases in each class are as ho-mogenous as possible, with respect to the time of the day when the variables were measured during the period of the study. 48
classes were obtained altogether (with each having 30 or 32 cases). A case capturing the central tendencies of each class was chosen to represent it, using the means/medians of the variables. Summary of the first class is illustrated in table 5.
Table 4 Result of the flat surface model of the IRD (without sampling)
Estimate Std. Error t value Pr(>|t|)
Intercept 918.40279 361.52306 2.540 0.01117*
Error -0.17806 0.02734 -6.512 1.01e-10***
Temp -1.08973 0.75907 -1.436 0.15132
RelHum 0.46947 0.16617 2.825 0.00479**
Pres -0.90666 0.34644 -2.617 0.00896**
Tilt 0.27732 0.42551 0.652 0.51467
Roi 6.08520 0.16878 36.055 <2e-16***
Signif. codes: 0 ‘***’ 0.001 ‘**’ 0.01 ‘*’ 0.05 ‘.’ 0.1 ‘ ’ 1 Residual standard error: 34.8 on 1503 degrees of freedom Multiple R-squared: 0.5388, Adjusted R-squared: 0.5369 F-statistic: 292.6 on 6 and 1503 DF, p-value: < 2.2e-16
Table 5 Summary of the first class (class1) of the IRD
Variable Radon Concen-tration1 (Bqm-3)
Error1 (%)
Temperature1 (oC)
Relative Humidity1 (%)
Pres-sure1 (mbar)
Tilt1 (Count)
ROI1 (Count)
Minimum 0 0 19.5 24.5 993 0 0
1st Quartile 0 0 25.0 32.8 997 0 0
Median 9 43.0 26.0 78.0 998 0 1.0
Mean 33 47.0 26.0 64.6 999 1.3 3.6
3rd Quar-tile
46 78.3 26.1 82.0 999 0 5.0
Consequent from table 5, the class1 repre-sentative values are; Radon1 = 9 Bqm-3; Error1 = 43%; Temperature1 = 26oC; Rela-tive humidity = 78%; Pressure1 = 998mbar; Tilt = 0; and ROI1 = 1.
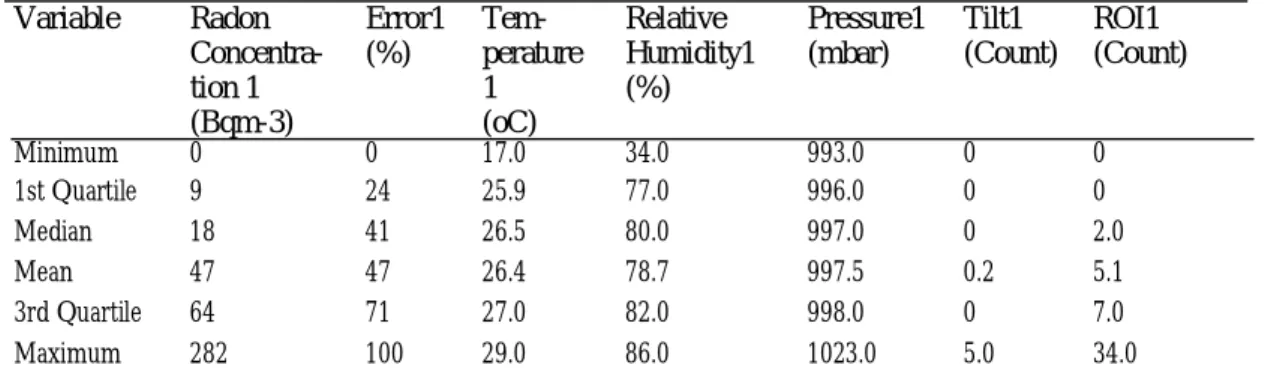
By continuing in this fashion 48 cases were obtained, and the remaining 5 cases, to make up 53 needed for the appropriate plan for the ARSM (Cochran and Cox, 1957) were also obtained through random sampling (Lunneborg, 2007). Summary of the data for the 53 cases is shown in Table 6.
Adaptively; Radon concentration, being the response, does not need to be coded. As for the remaining six, the following coding technique was adopted:
Coding(Error)= (2)
Coding(Temp)= (3)
Coding(RelHum)= (4) Coding(Pres)= (5) 1, 46.6 1, 46.6 c Error E Error 1, 26.37 1, 26.37 c Temp T Temp
1, Re 80 1, Re 80
c lHum R lHum
1, Pr 997 1, Pr 997
c es P es
Coding(Tilt) = (6)
Coding(Roi)= (7)
A more appropriate coding system can be generated using R and the fact that the fitting of a polynomial can be treated as a particular case of multiple linear regression (Cochran and Cox, 1957), for instance a flat surface regression of representative IRD, on R was obtained by executing the following opera-tion:
Call:
lm(formula = Radon ~ Error + Temp + RelHum + Pres + Tilt + Roi)
The above operation results in the following coefficients:
Intercept = -1.077e+03; Error = -6.027e-02; Temp = 2.900e+00; RelHum = 3.707e-01; Pres = 9.796e-01; Tilt = -1.355e+00; Roi = 8.732e+00.
Also see the corresponding analysis of vari-ance, which is presented in table 7, and the associated plots in figure 4.
1, 0 1, 0 c Tilt Tilt 1, 2 1, 2 c Roi Roi
Table 6 Summary of the 53 cases needed for the appropriate plan for the ARSM.
Variable Radon Concentra-tion 1 (Bqm-3)
Error1 (%)
Tem-perature 1 (oC)
Relative Humidity1 (%)
Pressure1 (mbar)
Tilt1 (Count)
ROI1 (Count)
Minimum 0 0 17.0 34.0 993.0 0 0
1st Quartile 9 24 25.9 77.0 996.0 0 0
Median 18 41 26.5 80.0 997.0 0 2.0
Mean 47 47 26.4 78.7 997.5 0.2 5.1
3rd Quartile 64 71 27.0 82.0 998.0 0 7.0
Maximum 282 100 29.0 86.0 1023.0 5.0 34.0
Table 7. Analysis of variance for the flat surface regression
Response: Radon
Df Sum Sq Mean Sq F Value Pr(>F)
Error 1 14921 14921 87.7316 3.127e-12***
Temperature 1 7539 7539 44.3302 2.972e-08*** Rel Humidity 1 20186 20186 118.6918 2.488e-14***
Pressure 1 1103 1103 6.4833 0.014303*
Tilt 1 1962 1962 11.5357 0.001417**
Roi 1 140480 140480 825.9946 <2.2e-16***
Residuals 46 7823 170
Signif. codes: 0 ‘***’ 0.001 ‘**’ 0.01 ‘*’ 0.05 ‘.’ 0.1 ‘ ’ 1
A flat surface regression of representative IRD on R was obtained and the coefficients were fitted to a model equation;
Radon= -1077 – 0.06027Error + 2.9Temp + 0.3707RelHum + 0.9796Pres – 1.355Tilt + 8.732Roi
(8)
There is no distribution between the Re-siduals and the Fitted Radon concentra-tions, a horizontal line was given as the line of best fit (Residual vs. Fitted, see figure 4), The (Normal Q-Q) plot shows that the standardized residuals are approximately normal with mean 0 and a very low vari-ance. The (Scale-Location) plot shows the existence of a quadratic model between the square-root of the standardized-residuals and the fitted (Radon) values. This may mean that there is the need to adjust the equipment (Radon Chamber) a “little” or to use another scale, either for Radon concen-tration or the other variables. In this respect the duration of measurement could be in-creased to three (3) hours for instance. ARSM also shows that Tilt is actually not contributing much to the fitted model and could be jettisoned. But the result of RSM suggesting that Temp could be jettisoned is not corroborated by ARSM. Also, in agree-ment with previous studies, e.g. Ramola et al (2000), ARSM result that Pressure may be set aside is not supported by RSM. Finally, the R-statistics (i.e. multiple R-squared and adjusted R-squared) indicate that only about 54% of the fitted values actually fell on the model and the F-statistic (Fcal = 292.6) is highly significant when compared with F(6, , 99%) = Ftab = 2.80 (i.e. rejecting the goodness of the fit).
CONCLUSION
In this work, the robust features of Adaptive Response Surface Methodology (ARSM) as a tool for predicting the relationships between indoor radon concentration and meteoro-logical parameters were exploited and re-vealed. The ARSM predicts strong relation-ships between indoor radon concentration and both Relative humidity and Tempera-ture, and that barometric pressure has no significant influence on the indoor radon concentration. Although there are partial agreements between the results of the RSM and ARSM, they are at variance in their pre-dictions concerning the significance of the influences of Temperature and Barometric Pressure on indoor radon concentration. However, the ARSM shows better agree-ment with the results reported by other re-searchers from previous experimental inves-tigations. The ARSM has therefore been pre-sented as a viable quantitative method for predicting the relationships between vari-ables in IRD.
REFERENCES
Box, G E P, Hunter, W G & Hunter, J S 2005. Statistics for Experimenters: An
Intro-duction to Design Data Analysis & Model Build-ing (2nd edition). John Wiley & Sons Inc. New York.
Chege, M W, Rathore, I V S, Chhabra, S C and Mustapha, A O 2009. The influence
of meteorological parameters on indoor ra-don in selected traditional Kenyan dwellings.
J. Radiol. Prot. 29 (2009) 95 – 103.
Cochran, W G and Cox G M 1957.
Experi-mental Designs (second edition). John Wiley &
Sons, Inc, London.
Crawley M J 2007. The R Book. John Wiley
Chicester, West Sussex P019 8SQ, Eng-land.Fnides, B, Yallese, M A, Mabrouki, T Rigal, J F (2011). Application of
re-sponse surface methodology for determin-ing cuttdetermin-ing force model in turndetermin-ing hardened AISI H11 hot work tool steel. Sadhana Vol. 36, Part 1, pp. 109–123. Indian Academy of Sciences.
Gelman, A (2006). Multilevel (Hierarchical) Modeling: What It Can and Cannot Do. TECHNOMETRICS, VOL. 48, NO. 3. American Statistical Association and the American Society for Quality, pp. 432 – 435.
Gilmour, S G (2006). Response Surface
Designs for Experiments in Bioprocessing. Biometrics 62, 323–331
Khuri, A, Mukhopadhyay, S (2010).
Re-sponse Surface Methodology. WIREs Comp. Stat. 2010 2 128 – 149. John Wiley & Sons Inc.
Kong, M, Lee, J J (2006). A Generalized
Response Surface Model with Varying Rela-tive Potency for Assessing Drug Interac-tion. Biometrics 62, 986–995.
Kong, M, Lee, J J (2008). A
Semiparamet-ric Response Surface Model for Accessing Drug Interaction. Biometrics 64, 396–405.
Lenth, R V (2009). Response Surface
Methods in R, Using rsm. Journal of Statis-tical Softwares. Vol. 32, Issue 7. http:// www.jstatsoft.org/ American Statistical As-sociation.
Lunneborg C E (2007). Convenience
Sample. Extracted from Blackwell Excyclo-pedia of Sociology. Edited by George Ritzer eISBN 9781405124331. Wiley- Blackwell.
Moghaddam, M G Khajeh, M (2011).
Comparison of Response Surface Methodol-ogy and Artificial Neural Network in Pre-dicting the Microwave-Assisted Extraction Procedure to Determine Zinc in Fish Mus-cles. Food and Nutrition Sciences, 2011, 2, 803-808 doi:10.4236/fns.2011.28110. (http://www.SciRP.org/journal/fns)
Nicolai, R, Dekker, R (2009). Automated
Response Surface Methodology for Simula-tion OptimizaSimula-tion Models with Unknown Variance. Quality Technology & Quantita-tive Management Vol. 6, No. 3, pp. 325-352.
Osborne, J W, Waters, E (2002). Four
As-sumptions Of Multiple Regression That Re-searchers Should Always Test. Practical As-sessment, Research, and Evaluation, 8(2
Ramola, R.C., Kandari, M.S., Negi, M.S. Choubey, V.M. (2000) A study of diurnal
variation of indoor radon concentrations. Journal of Health Physics 35(2), 211-216
Seftelis, I., Nicolaou, G., Trassanidis, S., Tsagas, F.N. (2007) Diurnal variation of
radon progeny. Journal of Environmental Radioactivity 97, 116-123
Stevens, J P (1984). Quantitative Methods
in Psychology: Outliers and Influential Data Points in Regression Analysis. Psychological Bulletin 1984, Vol. 95, No. 2, pp. 334 – 344. The American Psychological Association, Inc.
Tan, Z (2006) Regression and Weighting
Methods for Causal Inference Using Instru-mental Variables, Journal of the American Statistical Association, 101:476, 1607-1618, DOI: 10.1198/016214505000001366, http:/ dx.doi.org/10.1198/016214505000001366
UNSCEAR (2000) United Nation
Scien-tific Committee on Effects of Atomic Ra-diation, Dose assessment methodologies, Report to the general assembly, New York
Velleman, P F, Hoaglin, D C (2004).
Ap-plications, Basics, and Computing of Ex-ploratory Data Analysis. The Internet-first
University Press. Pp. 134 – 144. http:// dspace.library.cornell.edu/handle/1813/62
Wong, W K (1994). Comparing robust
properties of A, D, E and G-optimal de-signs. Computational Statistics & Data Analysis 18 (1994) 441-448, North-Holland.