EFFECT OF COMBUSTION TEMPERATURE ON THE ATMOSPHERIC STABILITY OF
POLYBROMINATED DIBENZO-p-DIOXINS AND DIBENZOFURANS
Parag Birla
Department of Environmental Sciences and Engineering
School of Public HealthUniversity of North Carolina
Chapel Hill, North Carolina 27599-7400
ABSTRACT
The incineration of materials containing polybrominated
diphenyl ether (PBDPE) flame retardants can potentially lead to
the formation of polybrominated dibenzo-p-dioxins and furans
(PBDDs and PBDFs). Some of these compounds may exhibit
toxicities similar to those of their chlorinated analogues.
Little is known about the atmospheric stability of PBDDs and
PBDFs. In this study PBDDs and PBDFs produced from the
combustion of polyurethane foam containing 4.4% PBDPEs were
injected into outdoor teflon film chambers and aged in the
presence of sunlight under typical atmospheric conditions.
Combustion temperatures in the range of 400-450°C were
categorized as "low temperature" experiments and those in the
range of 650-750°C as "high temperature" experiments. PBDDs and
PBDFs have been found to occur predominantly in the particulate
PBDFs, namely, tetrabrominated-p-dibenzofuran (TBDF) and
pentabrominated-p-dibenzofuran (PeBDF) and decay of
tetrabrominated-p-dioxin (TBDD) was observed in "low temperature"
experiments. Production of TBDF and PeBDF is believed to occur
from photolysis of unburnt PBDPEs. TBDF,PeBDF and TBDD emissions
from "high temperature" experiments were stable. Validation of
PBDF and PBDD behavior was done by collecting particulate- and
gas-phase samples of polycyclic aromatic hydrocarbons (PAHs).
Particle-bound PAHs from "low temperature" experiments degraded
while corresponding PAHs from "high temperature" experiments were
stable. Particle formation and composition from the two kinds of
experiments have been investigated to explain these differences.
These observations suggest that under typical incinerator
conditions particulate-bound emissions of these compounds will be
transported over long distances. Incineration tempaeratures
around 450°C can lead to unstable emissions with atmospheric
half-lives of 1-2 h. The dependence of the atmospheric stability
of incineration-generated pollutants on the combustion
ACKNOWLEDGEMENTS
I want to thank Prof. Kamens, my advisor, whose valuable
guidance and patience made my work possible. I am grateful to
everyone in my research group as they contributed immeasurably in
my understanding of the principles related to analytical and
atmospheric chemistry. I owe special thanks to Dr. Bagnell in
the Pathology Department for his help with the scanning electron
microscope and G. Dean Marbury for assistance in mass
spectrometry analyses. Finally, I wish to thank Dr. Leith and
Dr. Christman, who as readers, provided valuable suggestions in
refining my work.
Funding for this project was received from The Office of
Exploratory Research, Washington, D.C. (Grant# 5-35435). This
grant financed my education at The University of North Carolina
CONTENTS
LIST OF ABBREVIATIONS (i), (ii)
PURPOSE 1
BACKGROUND 1 Formation of PBDDs and PBDFs 2
Gas/Particle Partitioning of PBDDs and PBDFs 3
Existing Work on Photodegradation of PXDDs and
PXDFs 8 MATERIALS AND METHODS 13
Chamber Description 13
Ignition Vessel Description 16
Instrumentation 18
Sampling Procedure 19
Sample Extraction and Enrichment 22
Quantification of Sample Extracts 28
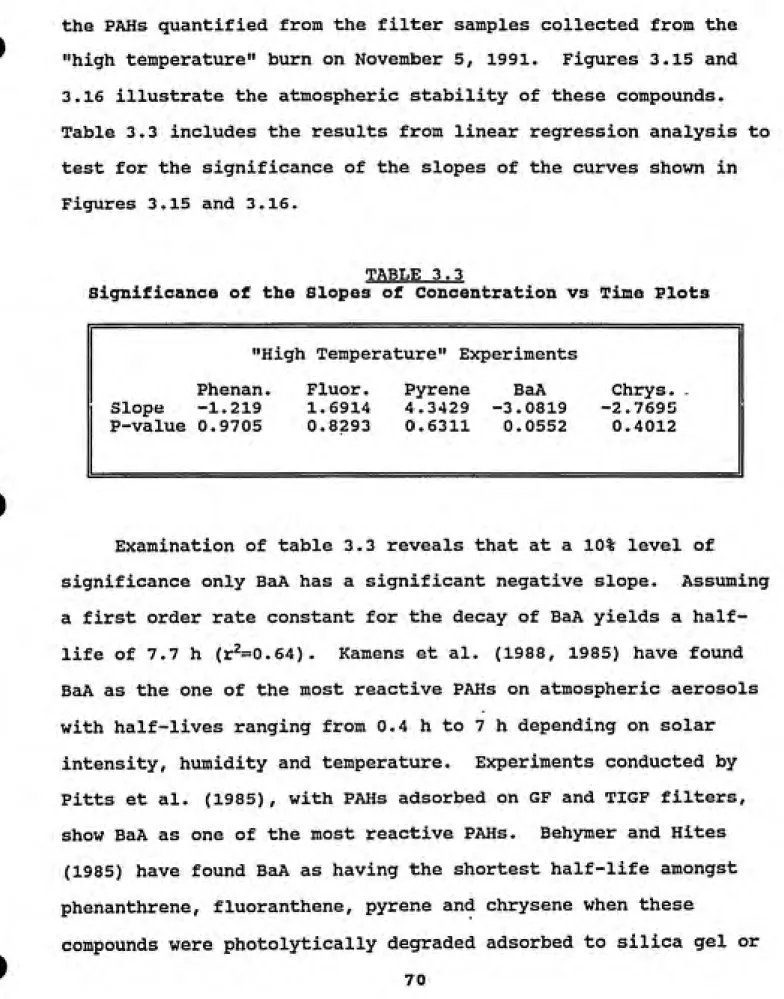
RESULTS AND DISCUSSION 41
PBDD and PBDF Analysis 41
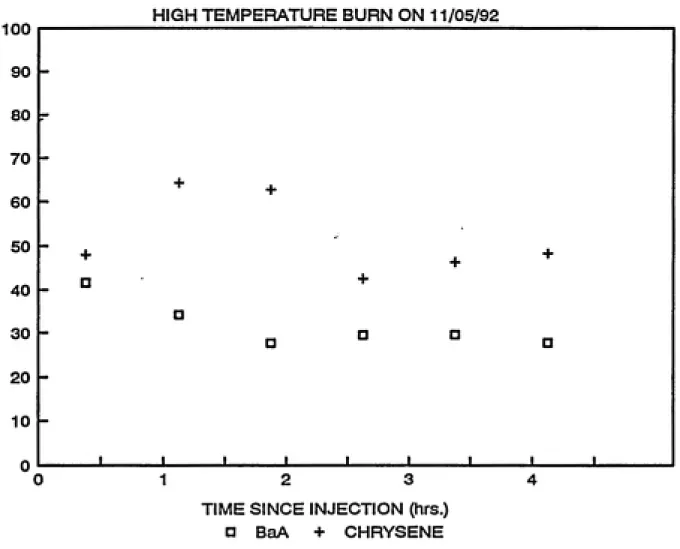
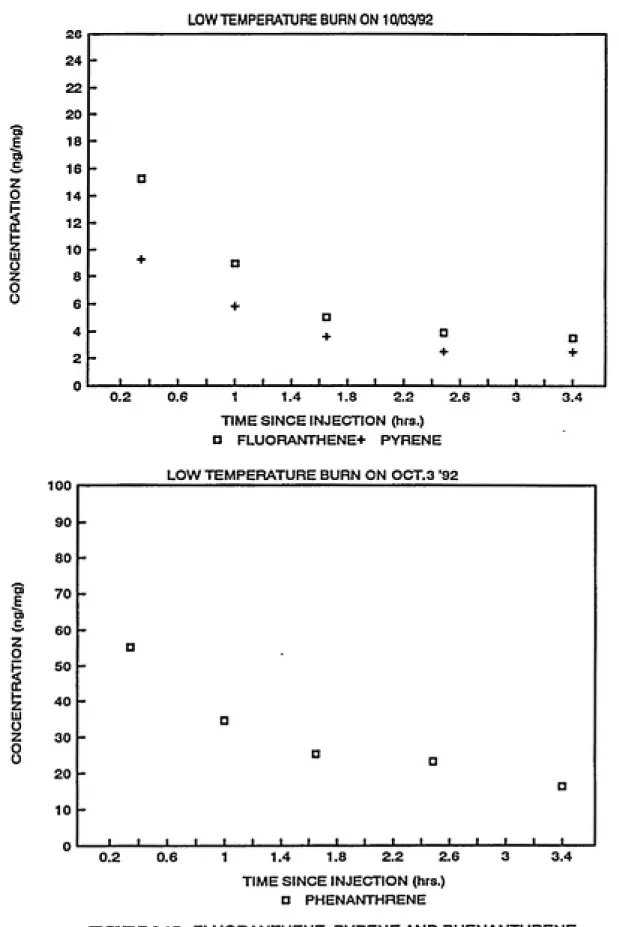
PAH Analysis 69
Comparison of Particle Characteristics 77
*'--™'-"-*!Si'JftS****';--i*?^=Rp^"
LIST OF ABBREVIATIONS
BeiA Benz[ a] anthracene BaP Benz[a]pyrene
BbF Benz[b]fluoranthene BkF Benz[k]fluoranthene
BghiP Benzo[ghi]perylene
DBA Dibenz[a,h]anthracene
DCM ' Dichloromethane DD Dibenzodioxin
DESE Department of Environmental Sciences and Engineering
EAA Electrical Aerosol Analyzer
ECD Electron Capture Detector
Fluor. Fluoranthene
GC Gas Chromatograph
HpCDD Heptachloro Dibenzo-p-dioxin
HRGC High Resolution Gas Chromatography
HRMS High Resolution Mass Spectrometry
HxBDPE Hexabromo Diphenyl Ether
HxCDD Hexachloro Dibenzo-p-dioxin
IP Indeno[l,2,3-cd]pyrene
LAS Laser Aerosol Spectrometer
OCDD Octachloro Dibenzo-p-dioxin
PAH Polycyclic Aromatic Hydrocarbon
PBB Polybrominated Biphenyl
PBDD Polybrominated Dibenzo-p-dioxin
PCDD Polychlorinated Dibenzo-p-dioxin
PCDF Polychlorinated Dibenzofuran
PCDPE Polychlorinated Diphenyl Ether PeBDD Pentabrominated Dibenzo-p-dioxin
PeBDF Pentabrominated Dibenzofuran
PeBDPE Pentabrominated Diphenyl Ether PeCDPE Pentachlorinated Diphenyl Ether PFK Perfluorokerosene
Phenan. Phenanthrene
PIC Product of Incomplete Combustion PUF Polyurethane Foam
PXDD Polyhalogenated Dibenzo-p-dioxin PXDF Polyhalogenated Dibenzofuran SEM Scanning Electron Microscope SIM Selected Ion Monitoring
SSA Specific Surface Area
TBDD Tetrabrominated Dibenzo-p-dioxin TBDF Tetrabrominated Dibenzofuran
TBDPE Tetrabrominated Diphenyl Ether TCDD Tetrachlorinated Dibenzo-p-dioxin
TCDF Tetrachlorinated Dibenzofuran
PURPOSE
This study assesses the effect of combustion temperature on
the atmospheric stability of polybrominated dibenzo-p-dioxins
(PBDDs) and polybrominated dibenzofurans (PBDFs) on realistic
soot particles generated from small scale combustion of materials
containing brominated organics.
BACKGROUND
Polyhalogenated dibenzo-p-dioxins (PXDDs) and
polyhalogenated dibenzofurans (PXDFs) are the by-products of
certain chemical manufacturing or combustion processes involving
precursor compounds and heat. Incineration of brominated or
chlorinated organics can lead to the formation of PBDDs, PBDFs,
polychlorinated dibenzo-p-dioxins (PCDDs) and polychlorinated
dibenzofurans (PCDFs) as well as the mixed halogenated species.
It has also been suggested that these chemicals may be ubiquitous
as a consequence of trace chemical processes during combustion
(Shaub and Tsang, 1983). In fact, Bacher and Ballschmiter (1991)
have detected PXDDs and PXDFs in vehicle exhaust particulates,
wood combustion and metal reclaiming processes. Over the last
two decades, these contaminants have become a focus of concern on
a worldwide basis because of their highly toxic properties
(Schmidt, 1992).
The toxicity of PBDDs and PBDFs has not been as extensively
studied as that of PCDDs and PCDFs. Current indications suggest
that PBDDs and PBDFs are at least, if not more toxic to animals
Ramalingam et al., 1986). Toxicity is related to halogen
substitution in the lateral positions i.e. 2,3,7 and 8. Toxicity decreases as the number of substituents increases (Mason et al.,
1987; Rappe, 1983). The ability of 2,3,7,8 TBDF to kill guinea
pigs is similar to that of 2,3,7,8 TCDF (Moore et al., 1979) and 2,3,7,8 TBDD is a more potent inducer of enzymes affecting
toxicity in chick embryos, arylhydrocarbon hydroxylase and 7-ethoxyresorufin dieethylase than 2,3,7,8 TCDD.
Formation of PBDDs and PBDFs:
PBDD and PBDF emissions have three principal sources: (1) they can be present in the waste feed and pass through the combustion process without being destroyed, (2) they can be formed in the combustion process as products of incomplete
combustion (PICs), and (3) they can be formed "de novo" in cooler areas downstream of the combustion products from elements and compounds that act as precursors (Acharya et al., 1991). The major routes of formation for PBDDs and PBDFs would be from
combustion of chemically related compounds such as bromobenzenes, bromophenols, polybrominated biphenyls (PBBs) and polybrominated diphenyl ethers (PBDPEs) (Buser, 1987; Shaub and Tsang, 1983).
PBDFs have also been found to be formed from photolysis of PBDPEs
(Lutes et al., 1992; Watanabe et al., 1987).
Currently bromine exists in municipal waste streams at levels that are 2-4% of chlorinated organics (Schafer and Ballschmiter, 1986). The industrial production of brominated
^ ^T'lB^W^S^y-i^:^^
particularly with respect to PBDPEs. In this study PBDPEs
(industrial grade DE-71 consisting primarily of penta and tetra
congeners as a 4.4% w/w component of polyurethane foam (PUF),
Olympic Products, Greensboro, NC) are used as precursors to PBDDs
and PBDFs. PBDPEs are used as flame retardants and are added toplastic, textiles, carpets, and other materials to reduce
flammability and protect these materials in case of fire
accidents. Production of PBDPEs was around 75 million pounds in
1988 at a growth rate of 15%/annum. The increased production of
precursors to PBDDs and PBDFs coupled with increased use of
incineration as a waste disposal technology are likely to
increase atmospheric concentrations of PBDDs and PBDFs. Figure
1.1 depicts the mechanisms by which PBDDs and PBDFs can be formed
from pyrolysis of PBDPEs (Bieniek et al., 1989; Lindahl et al.,
1980). Figure 1.2 elucidates formation of PBDFs from photolysis
of PBDPEs. Photodegradation of PBDPEs into PBDFs is dominated by
debromination followed by ring closure to PBDFs (Norstorm et
al., 1976).Gas/Particle Partitioning of PBDDs and PBDFs:
Partitioning of PBDDs and PBDFs between gas and particle
phases is important from the following standpoints: (1) chemical
reactivity in the atmosphere is governed by the phase in which
the contaminant is present, (2) deposition processes are
different for gas-phase and particulate-phase species and (3)
health effects of a pollutant are dependent on gas/particle
-2HX
HO
X' ^^X,
+ (H)
^°^-b-l
-2X-+ (0)
Xj.i X^-i ^»-l ^
-HX
'^a-l
X. X,
b-l
Jf o ^ Br
Br
I „ I
Fast
Br Br
K^---'Xo^
I T l
Br Slow
Br
Fast
^.^-^O^Y^Br
Brk^Br k^ Br
Further Debromination
-ͨ Other PBDFs
0(=[particulate phase]/([particulate phase]+[vapor phase]) for
TBDF, PeBDF and TBDD have been determined to be greater than 0.95
(Lutes, 1991). This implies that in the atmosphere PBDDs and
PBDFs will be primarily bound to particulate mass.
Theoretical predictions of gas-particle partitioning have been based on Langmuirian adsorption isotherm (Bidelman et al.,
1986; Junge, 1977; Pankow, 1987; Yamasaki et al., 1982). Junge
(1977) derived the following equation to predict 0:
0 = c.e./(Po+Cj9j) , where (equation 1)
Cj. = 760RTN3e«°'^-°^>/''T
9- = concentration of aerosol surface area(cm^cm''^)
Pjj = saturation vapor pressure at T (torr)
R = gas constant (=82cm^atm mole'^K"^)
T = temperature (K)N = moles of sorption sites per cm^ of aerosol
s= 1/N s , N = Avagadro's number (= 6.02*10"/mole) ,23
s^ = surface area per sorption site (cm^)
= 3.33*10'''^ (Shaub and Tsang, 1985)
Qd = enthalpy for desorption directly fromsurface (Kcal/mole)
Qv = enthalpy of vaporization of the liquid (Kcal/mole) Equation 1 was used to predict values of 0 for PBDDs and PBDFs. Comparison of experimental values from Lutes et al.
(1992) to the theoretical values obtained from equation 1 was also done (shown in Table 1.1). It was found that a (Qd-Qv)=2
TABLE 1.1
EXPERIMENTAL AND THEORETICAL VALUES OF GAS-PARTICLE PARTITIONING
COMPOUND Qd-Qv Po=PI Surface Area PHI (TH.) PHI (EX.)
(Kcal/mole) (torr) (cm*2 cm"-3)
TBDD 1 3.91 E-07 5.68E-04 0.9889 0.998
TBDF n
1.13E-06 ft
0.9632 0.996
PeBDF n
1.13E-07 If
0.9962 0.994
TBDD 2 3.91 E-07 5.68E-04 0.9974 0.998
TBDF ff
1.13E-06 /r
0.9924 0.996
PeBDF n
1.13E-07 tt
0.9992 0.994 TBDD 3 3.91 E-07 5.68E-04 0.9996 0.998
TBDF a
1.13E-06 It
0.9989 0.996
PeBDF n
1.13E-07 H
0.9999 0.994
NOTES:
(1) Bidelman and Foreman (1987) suggest that the value of Po
should be that of the sub-cooled liquid as opposed to solid. (2) PI values were obtained from Mill (1989).
with the observed values by Lutes et al. Bidelman and Foreman
(1987) have cited experimental evidence that (Qd-Qv) is no more
than 2 to 4 Kcal/mole for PAHs and organochlorines.
Since PBDDs and PBDFs occur primarily in the
particulate-phase, the focus of research on the atmospheric stability of
these compounds is relevant to their occurrence on atmospheric
aerosols. Therefore, in this study the atmospheric stability of
PBDDs and PBDFs has been determined by analyzing for their
concentrations on the particles generated from incineration
experiments.
Existing Work on Photodegradation of PXDDs and PXDFs:
Wingerter (1989) has predicted increased use of incineration
through expansion of existing municipal waste combustors (MWCs)
and construction of new ones due to a drastic shortfall in
landfill space. Several studies have reported emissions of toxic
air pollutants from existing MWCs eguipped with air pollution
control devices. Therefore, the atmospheric stability of toxic
organic compounds emitted from MWCs is central to the use of
incineration as a viable waste disposal technology. This issue
is important because atmospheric fate and transport from source
to sink ultimately results in biological exposure and uptake.
Currently a paucity of data exists on the atmospheric
stability of PXDDs and PXDFs under realistic conditions.
Indirect methods such as structural activity relationships,
source receptor differences in congener or isomer distributions,
and photolysis on glass surfaces or in solutions have been used
to estimate the extent of atmospheric reactions (Buser, 1988;
Dulin et al., 1986; Nestrick et al., 1980; Podoll et al., 1986).
In a recent work by Lutes et al. (1992) the atmospheric stability of PBDDs and PBDFs was ascertained using the smog chamber
facility operated by the University of North Carolina at Chapel
Hill (UNC).
A review of existing work on photodegradation of PXDDs and
PXDFs has been included in Table 1.2, perusal of which reveals
the following trends: (a) half-lives of PCDD and PCDF as compared to their brominated analogues are higher (b) PXDFs usually have
shorter half-lives than their corresponding PXDDs and (c)
solution-phase experiments usually yield shorter half-lives than
the solid-phase experiments.
An important observation related to the current work in
photodegradation of PXDDs and PXDFs is the effect of the reaction media on the photolysis of PXDDs and PXDFs. Buser (1988) has suggested that the first step in photodegradation of PXDFs and PXDDs is debromination and generation of their lower brominated radicals. This reaction is enhanced in the presence of good
proton donors. Therefore, the nature of the media is an
important variable as it can influence photodegradation through its ability to donate protons. The relative stability of PXDDs
and PXDFs on solid-phase experiments as compared to the solution-phase experiments may imply that the latter have higher proton
^^p
TABLE 1.2
REVIEW OF EXISTING LITERATURE ON PHOTODEGRADATION OF PXDDs AND PXDFs
INVESTIGATOR/S ANALYTES MEDIUM IRRADIATION SOURCE
CONCENTRATION HALF- 1
LIFE
Buser(1988) 1,2,3,4 TBDD i-octane sunlight 5 ng/^/l 3 min
1,2,3,4 TCDD « H n 380 min
2,3,7,8 TCDD II n H 14 min
1,2,3,4 TCDF II H II 180 min
2,3,7,8 TCDF n n n 220 min
1,2,7.8 TCDF n u n 600 min
1,2,3,4 TBDD It n 1 ng/jul 2 min
2,3,7,8 TBDD II n n 0.8 min
2,3,7,8 TBDF II n n
0.7 min
2,3,7,8 TCDD n n II 200 min
TCDD/F II artificial 5,1 ng/jul 28 days
TBDD/F II
lab. light 5,1 ng/yul 8 days
1,2,3,4 TCDD dispersed sunlight 65 hr
2,3,7,8 TCDD as // 300 hr
1,2,3,4 TCDF solid II
95 hr
2,3,7,8 TCDF film n
120 hr
Choudhry 1,2,3,7 TCDD ACN reactor 8.73 days
& 1,3,6,8 TCDD //
output 1.47 days
Webster (1989) PeCDD II
290-310 nm 76.8 days
HxCDD H
31.9 days
HpCDD II 2392 days
OCDD n
863 days Crosby et al. 2,3,7,8 TCDD methanol sunlight 5 mg/l 3hr
(1971) ff n UV light n 6hr
OCDD II n 2.2 mg/l >24 hr
Dulin et al. 2,3,7,8 TCDD water:ACN 313 nm 3.61*10*-7M 20 hr
(1986) n (90:10) sunlight n 26.3 hr
H
hexane 313 nm 3.36*10*-7M 3hr
Lutes et al. PBDDs/ incinerator sunlight
175-(1992) PBDFs soot*
650 min |
N.B.: ACN-acetonitrile
ͣ
^s^^SMP^W
TABLE1.2(contd.'>
REVIEW OF EXISTING LITERATURE ON PHOTODEGRADATION OF PXDDs AND PXDFs
INVESTIGATOR/S ANALYTES MEDIUM IRRADIATION SOURCE
CONCENTRATION
HALF- 1
LIFEKieatiwong et al. 2,3.7,8 TCDD i-octane 310 nm 3.1*10*-6M 4 min
(1990)
Libert! et al. 2,3.7,8 TCDD glass mercury 2.3 hr
,(1978) surface lamp
Muto et al. 2.3,7,8 TCDD fly ash 254 nm 22.12 hr
(1991) in water
Nestrick et al. 2,3,7,8 TCDD glass sunlamp 2ng/cm*2 8400 min
(1980) 1,2,3,9 TCDD surface (280-400 nm) 121 min
2,3,7,8 TCDD n-hexa- n
0.06ng/iul 56.8 min
1,2.3,9 TCDD decane n
0.041 ng///l 584 min Podoll et al. 2,3.7.8 TCDD water sunlight 21 hr *
(1986) It n It 118hr**
the different half-life values obtained by Buser (1988), Crosby et al. (1971), Dulin et al. (1986), Nestrick et al. (1980) and Podoll et al. (1986) for solution-phase photolysis of 2,3,7,8 TCDD. These investigations used different media for the
photolysis experiments (Table 1.2).
The disparity between the solid-phase and solution-phase experiments highlights the need for more realistic values of
half-lives for PXDDs and PXDFs that are applicable to atmospheric aerosols. Preliminary work in this direction was carried out by Lutes et al. (1992) and revealed that half-lives for PBDDs and PBDFs on realistic soot particles are more comparable to the solid-phase experiments than to the solution-phase experiments. The study showed stable behavior of PBDDs and PBDFs obtained from
combusting PBDPEs contained in PUF at combustion temperatures
ranging from 64 0-760°C. Moreover, typical combustion
temperatures in a MWC can vary widely (Benefenati et al., 1983;
Hiraoka et al., 1987; Ozvacic et al., 1985; Tiernan et al.,
1983). Minimal combustion temperatures have been reported to
range from 320-1010°C. The effect of combustion temperature on
the atmospheric stability of toxic emissions from incinerators is an unexplored area in air pollution research. This study
addresses the effect of combustion temperature on the atmospheric stability of PBDDs and PBDFs on realistic atmospheric aerosols. Polycyclic aromatic hydrocarbons (PAHs) generated from the
combustion experiments have also been quantified to gain a better
MATERIALS AND METHODS
Chamber Description:
The chambers selected for use in this study are located at
the UNC smog chamber facility in Pittsboro, N.C. All but one of
the experiments were conducted using identical 25m^ (see Figure
2.1) chambers referred to as East and West, which allowed for the
performance of two simultaneous experimental runs under identical
atmospheric conditions. One of the experiments was conducted in
a 190m^ chamber (see Figure 2.2) designated as the Aerosol
chamber. This chamber is equipped with two sets of gas and
aerosol sampling manifolds that facilitate the collection of two
sets of samples from the same experiment. Notwithstanding the
dissimilarity in the geometries of the chambers, they are
otherwise similar in the materials used in their construction.The framework of each chamber is enclosed by five mil Teflon FEP
film (Livingstone Corp., Charlotte, N.C). Jeffries et al.
(1990) have shown that the five mil Teflon film transmits greater
than 70% of the incident light (measured normal to the sun) from
300 to 700 nm and greater than 50% of the incident light at 350
nm between a 0° and 70° angle between the film plane and the sun.
The chamber floors are covered with aluminium foil overlayed by
Teflon film, hence light entering the chamber can be reflected
off the floor and added to the total light flux inside the
chamber. Sampling manifolds run down from the chambers to the
sampling devices located in the laboratory. Chambers are
East Chamber
(25 nf)
Transfer Manifolds West Chamber
(25 m')
5 mil FEP
Teflon Film
i}
Exhaust
Blower
Clean
Air Intake
Dewpoint * ^ ^
Particle Size
47 mm filters,
Puf Cartridges
135 mm filters,
PUF Cartridges
Sample Loading Opening
i
^Sample Support Grid
_. Heat Distribution Grids
BurnerFresh Air Intake
II ^^ 0»N0. I |<-Filter Holder ^ r= Pew Point
\ Pump
' ^^iM-_»PaitideSiziag Manifolds
Connected to Incinerator
FIGURE 2.2 AEROSOL CHAMBER (Chamber Volume = 190m^)
(drawing not to scaJe)
rural air. Several air exchanges were performed before and after
each experiment. Mixing fans inside the chambers ensure proper
mixing of the air parcel to be studied. Dilution rate, as
determined with an SF^ tracer, was about 5%/hr for the Aerosol
chamber and about 10%/hr for East and West chambers. Ignition Vessel Description:
An ignition vessel was custom-built in the workshop of
Department of Environmental Sciences and Engineering (DESE) at
UNC for the of this study (Figure 2.3). The inside diameter of the ignition vessel was 5", the outside diameter was 8" and it
was 15" high. Combustion was contained inside the incinerator by
stainless steel walls which were insulated with kaolinite wool from the external surface. The walls of the incinerator could
withstand temperatures as high as 1500°C. The flame was
generated by a flat burner using liquified petroleum gas as the
fuel. Air inlets were provided below the burner through which
air entered the combustion region. The amount of air entering
the combustion zone could be regulated by controlling the opening
at the inlet. No provision was made for a secondary air source.
Heat distribution grids were provided for equitable distribution
of heat and thus stable temperatures were attainable over short
periods of time. The temperature in the combustion vessel was
measured via a thermocouple (Omega, Stamford, CT). Thermocouple
wires were made of Nickel-Chromium and Nickel-Aluminium
respectively. The reference junction was maintained at O^C by
Emissions directed to the Smog Chamber
Stainless Steel Wall
Kaolinite Wool Insulation
—Slit for Sample Introduction
Ceramic Gaskets
Thermocouple Heat Distribution Grids
Fuel Inlet
3^
Burner
Pbsrger
PUF Sample to be Combusted
Sample Support Grid Support
Adjustable Air Vents for Allowing Air into
the Combustion Zone
FIGURE 2.3 LONGITUDNAL SECTION OF THE IGNITION VESSEL
s^^-^'^Sip--*-;'fl»s^*^ -"
capable of measuring temperatures up to 1250°C. The sample was introduced into the combustion zone by means of a plunger and the combustion occurred on a grid located 4" above the burner. The thermocouple was positioned so as to record the temperature prevalent near the sample grid. Fluctuations in combustion
temperature were avoided by combusting small amounts of PUF i.e. about 0.5g at a time.
Instrumentation:
Instruments were available in the laboratory below the chamber for characterization of experimental conditions and
particles generated from the combustion of PUF (containing PBDPE mixture DE-71). Chamber ozone and oxides of nitrogen were
monitored with chemiluminescent monitors (Bendix Model 8101-B and 8002 analyzers, Lewisburg, WV). Relative humidity and chamber
temperatures were measured by a thermohygrometer (Hanna Model#
8564, Fisher Instruments, Raleigh, NC). A total solar radiation sensor (an Epply, Newport, RI, black and white pyranometer) was located on the floor of the chamber. Particle size distribution
data were taken with an Electrical Aerosol Analyzer, EAA, (TSI,
Inc., St. Paul, MN) and a Laser Aerosol Spectrometer, LAS, (PMS,
Inc., Boulder, CO). In addition to real time monitoring of aerosols, 0.1 jum nucleopore filter samples were collected and analyzed on Scanning Electron Microscope, SEM, located in the Pathology Department at UNC. Dilution rates were measured by a
gas chromatograph/electron capture detector (GC/ECD) using SF^ as
Szunpling Procedure:
Emissions from the ignition vessel were injected into the chambers by a flexible steel rimmed transfer manifold (5 cm internal diameter). Valves were used to direct the air parcel into the appropriate chamber for aging. During the aging period,
air samples were collected by passing chamber air via a 15mm
glass manifold through a sampling train that contained 47mm T60 A20 Teflon impregnated glass fiber filters (Pallflex, Putnam, CT), for the collection of particulates followed by a 4" x 1.5" PUF (Olympic Products, Greensboro, NC) vapor trap for collection of gas-phase pollutants. The PUF used for sample collection did
not contain PBDPEs and was soxhlet extracted in toluene and dried
prior to use. Samples were collected for periods ranging from 30 to 50 minutes at flow rates of 35 to 50 1pm (face velocities
ranging from 34-48 cm/s) over approximately four hour durations. Filter weights were determined using a three place milligram balance (Sartorius balance model 4503-MP6). Background samples were collected during each experiment to estimate background concentrations of analytes. Background concentrations of the analytes of interest were below 1% of the concentration in the filter samples collected from the various experiments.
Background filter mass suggested background aerosol
concentrations of 20-30/ig/m^.
Gas samples for NO^ and 0^ meters were drawn through a 12 mm
TABLE 2.1
COMPARISON OF 0CPERIMENTAL CONDITIONS
AUG. 21,1991 AUG. 21,1991 NOV. 5, 1991 NOV. 5,1991
East Chamber West Chamber East Chamber West Chamber
Chamber Temperature (deg. C) 32.5-40.5 30-42 19.5-22.2 20.2-21.8
Relative Humidity (%) 76-83 73-76 10-13 11-13
Incinerator Temperature (deg. C) 400 745 780 780
Total Solar Radiation (cal./cm2/min) 0.32-0.85 NA 0.08-0.63 NA
NO Concentration (ppm) 0-0.002 0-0.32 0-0.074 0-0.094
N02 Concentration (ppm) 0.01-0.016 0.02-0.16 0.01-0.061 0.01-0.074
03 Concentration (ppm) 0-0.07 0-0.24 0-0.06 0-0.05
Injection Time 10:01 a.m. 10:12 a.m. 10:58 a.m. 11:01 a.m.
Mass of PUF Combusted (g) 1.4899 1.6945 0.4841 0.6378
TABLE 2.1 (contd.)
COMPARISON OF EXPERIMENTAL CONDITIONS
MAY 21, 1992 OCT.03, 1992 OCT.03, 1992
Aerosol Chamber East Chamber West Chamber
Chamber Temperature (deg. C) 26.3-26.7 23.9-27.4 24.1-27.1
Relative Humidity (%) 46-45 42-39 42-39
Incinerator Temperature (deg. C) 470 470 470
Total Solar Radiation (cal./cm2/min) 0.26-0.93 0.24-0.86 NA
NO Concentration (ppm) 0-0.002 0-0.016 0-0.013
N02 Concentration (ppm) 0-0.005 0.01-0.026 0.01-0.021
03 Concentration (ppm) 0-0.045 0-0.041 0-0.014
Injection Time 9:49-10:05 a.m. 10:15 a.m. 10:25 a.m.
the attachment of a 47mm Teflon film holder. Pallflex (T60 A20) Teflon impregnated glass fiber filters were used to exclude
particles in the gas stream before air entered the gas sampling manifold. Sampling lines from the chambers were also connected
to aerosol sizing instruments.
Table 2.1 shows a comparison of the experimental conditions. Experiments conducted in the temperature range 700-800°C have been categorized as "high temperature" experiments/burns and those in the range 400-500°C as "low temperature"
experiments/burns. Variation in solar radiation during the course of these experiments is depicted in Figures 2.3 and 2.4. Sample Extraction and Enrichment:
Procedure for PBDDs and PBDFs:
Procedures for the analysis of PBDDs and PBDFs were based on EPA method 8290 (Stanley and Sack, 1986). Isotopically labeled,
"c^2 PBDDs and PBDFs (Cambridge Isotope Laboratory, Woburn, MA)
were used as internal standards. 12.5 ng of each species was added to the filter samples from a standard solution in toluene
that contained each species at a concentration of 50pg/jul. After
addition of the internal standard, the particulate samples were extracted in 400 ml of toluene (all solvents were Fisher Optima grade, Pittsburgh, PA). The toluene extracts were then
evaporated and solvent exchanged until they were contained in approximately 5 ml of hexane (Buchi Rotovapor R-110). The
extracts were then passed through a series of three gravity
1.5
c
1
1"
E o
S
u
0.5
-2 4
CHAMBER AGING TIME (hrs.)
---AUG. 21, 1991, EAST CHAMBER --- NOV. 5, 1991, EAST CHAMBER
1.5
MAY 21 '92 BURN
I
I
A^
0.5
-2 3
CHAMBER AGING TIME (hrs.)
OCTOBER 03 '93 BURN 1.5
c
E
t
E o 1 o
0.5
2 4
CHAMBER AGING TIME (hrs.)
—•-^--y^^^^FSi^m^
the content of PBDDs and PBDFs in the soxhlet extract. This
eased the process of quantitation as possible interferences like
PBDPEs were separated. All laboratory work was carried out under
conditions that excluded natural light. Artificial lights
shielded against ultraviolet radiation were used in the
laboratory. As a further precaution the samples were kept
wrapped in foil to exclude light. The samples were stored in a
refrigerator at 5°C when they were not being worked upon.
In order to perform the silica gel column cleanup the column
packing (Bio-sil A, 100-200 mesh, Bio-Rad Laboratories, Richmond,
CA) required activation. Activation involved heating the
material in the oven at a 180°C for 90 minutes. After being
allowed to cool, the material was washed with methanol anddicholormethane (DCM). The material was then reheated at slow
temperature gradient spanning from 50°C to 180°C so that solvent
was vaporized. The activated silica gel was stored in a
dessicator. The silica gel column was prepared by plugging the
tip of a 25 ml pipet (from which the upper constriction had been
cut off) with glass wool and adding 8 g of silica gel (Bio-Sil A)
and a 1 to 2 cm layer of sodium sulfate. The column was then
washed with three 10 ml portions of hexane and the eluate solvent
was discarded. All of the follwing eluate was then collected.
The sample extract, in about 5 ml of hexane, was loaded along
with two 5 ml rinses of the sample container. This was followed
by elution with 120 ml of hexane. The eluate was rotary
enrichment.
The next step in analysis for PBDDs and PBDFs was the
florisil column cleanup. This separation was performed in a
specially prepared piece of glassware consisting of a 250 ml
round bottom flask fused to the top of a 100 ml buret, referred
to as a reservoir column (University Research Glassware, Chapel
Hill, NC). The column was plugged with glass wool and 3 0g of
florisil (60-100 mesh. Fisher Chemical) was added, followed by a
1 inch layer of sodium sulfate. The eluate from the silica gel
column was then loaded onto the florisil column and allowed to settle for 1 to 2 minutes. The round bottom was rinsed four times with 5 ml of hexane which was also added to the coltimn.Following this 250 ml of hexane was eluted through the column and
discarded. The eluate obtained by running 250 mis of 35/65 v/v
DCM/hexane was collected for further analysis. This eluate was
solvent exchanged to hexane and transferred to a 15 ml tube where
it was reduced to 1 ml by nitrogen evaporation. This led to the
last step in the cleanup of samples for PBDD and PBDF analysis
i.e. the carbon column.The carbon column was prepared by cutting a 2 ml pipet at
the 1.8 ml mark. A carbon celite mixture was prepared from 62 g
of celite 545 (Fisher, Pittsburgh, PA) and 5.35 g of Carbon AX-21
(Anderson Development Co., Adrian, MI). The column was plugged
with glass wool to the 0.53 ml mark, filled with carbon/celite
mixture to the 0 ml mark and a glass wool plug was then placed on
follows: A - 50/50 v/v benzene (Fisher certified 99%)/ethyl acetate, B - 50/50 v/v DCM/cyclohexane and C - 50/50 v/v
DCM/hexane. The column was pre-eluted with 2 ml of A, 1 ml of B and 2 ml of hexane. The sample, in 1 ml of hexane, was then loaded. The sample container was rinsed twice with 0.5 ml
portions of hexane and loaded onto the column. The sample tube was also rinsed with a 2 ml portion of C and a 2 ml portion of A
each of which were added to the column. After elution of these rinses, the column was reversed and PBDDs and PBDFs were eluted with 10 ml toluene. This fraction was then evaporated under nitrogen to approximately 1 ml and then transferred to a 1.5 ml vial. Following this the sample was nitrogen evaporated to near
dryness. A 50 /xl aliquot of toluene was added and the sample was
stored for analysis. Isotopically labeled ^^C hexachlorinated
dibenzo-p-dioxin was added as an external standard immediately
prior to analysis as a recovery standard.
Procedure for PBDPEs;
Enrichment procedure for PBDPE analysis was similar to that for PBDD and PBDF, except that the carbon column was excluded in
the chromatographic process. Smith et al. (1984) have found that
polychlorinated diphenyl ethers (PCDPEs) are retained by the
carbon column, therefore, it is expected that PBDPEs can also be retained by the carbon column.
Procedure for PAHs;
;ff,yff-binaphthyl was used as the internal standard for PAH
ͣ
^(isBS^^p^aiK" -aprees*""^*.
solution containing ;ff,;ff-binaphthyl at a concentration of lOng/jul.
Soxhlet extraction for PAHs was done in 30 ml of DCM. Loss of
analytes due to volatilization can be of concern for compounds
having low volatility like phenanthrene (Daisey et al., 1986).
This fact prompted the use of DCM for extraction of particulate
samples for PAHs. The extract was then blown down to a volume of
2 ml using a Kuderna-Danish colvimn. Following this the entire
sample was transferred to a centrifuge tube and the sample
container was rinsed thrice with approximately 1 ml of DCM for a
total rinsing volume of 3 ml. These were also transferred to the
centrifuge tube. After further reduction of this extract by
nitrogen evaporation, solvent exchange was performed with
acetonitrile to a final volume of 100/il. This was used for
further analysis.Quantification of Seunple Extracts:
PBDD & PBDF Analysis!
Quantification of samples for PBDDs and PBDFs was done by
high resolution gas chromatography/high resolution mass
spectrometry (HRGC/HRMS) in accordance with EPA Method 8290
(Stanley and Sack, 1986). A Hewlett Packard 8290 Series II gas
chromatograph interfaced to a VG 70-SEQ hybrid mass spectrometer
was used for this purpose. Analysis was set up on a selected ion
N.B.: '*' denotes 13C labeled analytes TABLE 2.2
PBDDs & PBDFs Monitored in HRGC/HRMS and Time Windows
Groiq> 1 - 5:00 - 16:50 minutes
MASS ANALYTE ION TYPE 401.856 *Hexachlorodibenzo-p-dioxin M+2 403.853 *Hexachlorodiben2o-p-dioxin M+4
481.698 Tetrabromodibenzofuran M+2
483.696 Tetrabromodibenzofuran M+4 493.738 "Tetrabromodibenzofuran M+2 495.736 "Tetrabromodibenzoftiran M+4
497.692 Tetrabromodibenzo-p-dioxin M+2 499.690 Tetrabromodibenzo-p-dioxin M+4 509.733 "Tetrabromodibenzo-p-dioxin M+2 511.731 "Tetrabromodibenzo-p-dioxin M+4 565.620 Pentabromodiphenyl ether M+6 643.530 Hexabromodiphenyl ether M+6 466.973 PFK (lock mass)
Grot^ 2 - 16:50 - 22:00 minutes
MASS ANALYTE ION TYPE
561.606 Pentabromodibenzofiiran M+4
563.604 Pentabromodibenzofuran M+6 573.646 "^Pentabromodibenzofiiran M+4 575.644 ""Pentabromodibenzofiiran M+6
577.601 Pentabromodibenzo-p-dioxin M+4 579.599 Pentabromodibenzo-p-dioxin M+6 589.641 ""Pentabromodibenzo-p-dioxin M+4 591.639 ""Pentabromodibenzo-p-dioxin M+6 643.530 Hexabromodiphenyl ether M+6 721.441 Heptabromodiphenyl ether M+6 566.966 PFK (lock mass)
Group 3 - 22:00 - 30:00 minutes
MASS ANALYTE ION TYPE
641.514 Hexabromodibenzofiiran M+6 643.512 Hexabromodibenzofuran M+8 657.509 Hexabromodibenzo-p-dioxin M+6 659.507 Hexabromodibenzo-p-dioxin M+8 669.549 ""Hexabromodibenzo-p-dioxin M+6
671.547 *Hexabromodibenzo-p-dioxin M+8
721.441 Heptabromodiphenyl ether M+6
801.349 Octabromodiphenyl ether M+8
silica on column injection. The temperature program was ISCC
for 1 min, increased at a rate of 20°C/min to 170°C and then
6°C/min to 300°C followed by a 8 min. hold. The column head
pressure was maintained at 25 PSI yielding a helium flow rate of
0.13 ml/min This temperature facilitated elution of the analytes
in three distinct time windows. Table 2.2 describes each time
window and the ions monitored in the window. High resolution
permitted identification of fragment ions of PBDPEs that can
appear at the same exact mass of PBDFs as interferences. The
ratio between the halogen containing fragments, the absence of
interfering ions and the relative retention time were used as
criteria to confirm the presence of PBDDs and PBDFs. Since
standards for all of the possible TBDD, TBDF and PeBDF isomers
were not avilable, therefore, identification of such compounds
excluded the criterion involving relative retention time.
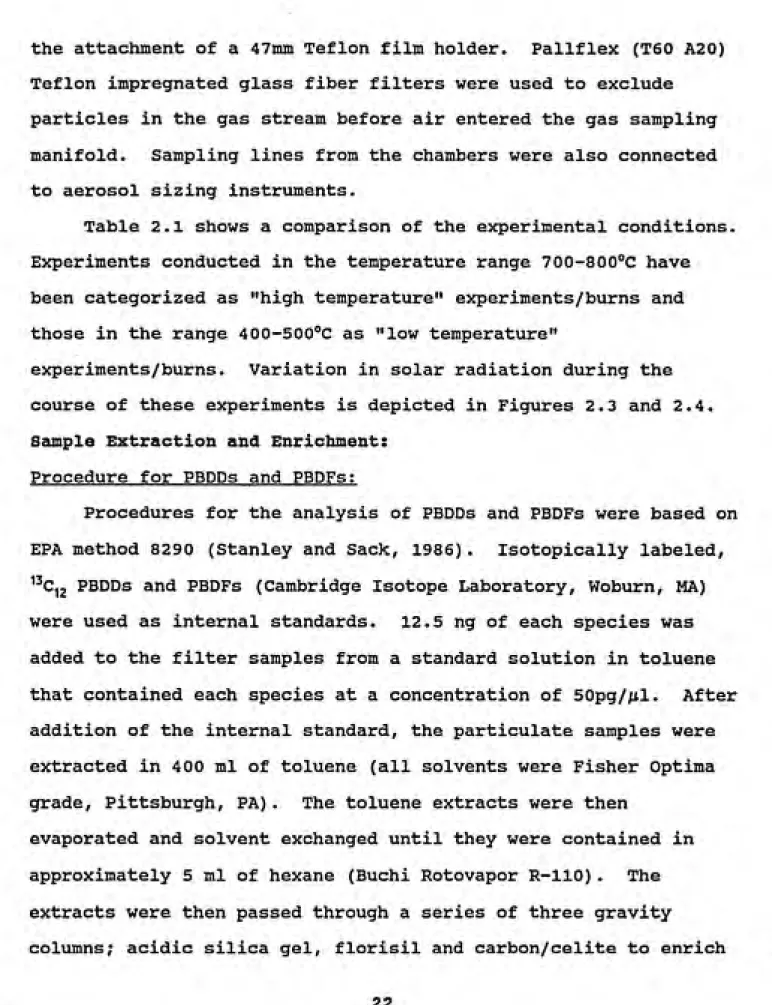
A six point calibration curve was obtained for each set of
samples. The analytical procedure has been characterized by
Lutes (1991). Standards used for construction of the calibration
curves are described in Table 2.3. An additional five point
calibration curve for TBDF was obtained so that response factors,
defined as the ratio of the area of unlabeled analyte to the area
of the internal standard, were comparable to some concentrated
samples. Typical calibration curves of PBDDs and PBDFs
quantified are shown in Figures 2.6 and 2.7.
PBDPE Analysis;Dilute Standards
o
u.
UJ
o
a. (0 UJ
0.4 0.6
CONCENTRATION (ng/|J)
4.5
Concentrated Standards
0.2 0.4 0.6
CONCENTRATION (iiglvi)
HGURE 2.6 CALIBRATION CURVE FOR 2,3,7,8 TBDF
(Internal Standard at 250pg/nl)
CONCENTRATION (ng/(il)
Br,
Br
a^
Br Br
I
lU (0
& 1
UJ
a:
OiP---1---1---1---«---1---1---1---1—
0 0.2 0.4 0.6 0.8
CONCENTRATION (ng/nJ)
HGURE 2.7 CALIBRATION CURVE FOR 2,3,7,8 TBDD & 1,2,3,7,8 PeBDF
(Internal Standard at 250pg/jil)
TABLE 2.3
Standards Used for PBDD & PBDF Calibration Curves
Standard Name 1 2 3 4 5 6 7 8 9 10 11
Concentration of 13C IS Concentration of 12C Native
TBDF PeBDF TBDD PeBDD TBDF PeBDF TBDD
PeBDD 1
250 250 250 250 1000 1000 1030 1270
250 250 250 250 500 500 515 635 250 250 250 250 50 50 51.5 63.5 250 250 250 250 10 10 10.3 12.7 250 250 250 250 1.25 1.25 1.29 1.59
250 250 250 250 0 0 0 0
250 0 0 0 5000 0 0 0
250 0 0 0 10000 0 0 0
250 0 0 0 50000 0 0 0
250 0 0 0 100000 0 0 0
250 0 0 0 1000000 0 0
0 1
N.B.: All Concentrations are in pg//xl
TABLE 2.4
PBDFs & PBDPEs Monitored in HRGC/HRMS and Time Windows
Groiqi 1 - 5:00 - 16:50 minutes
MASS ANALYTE ION TYPE
401.856 *Hexachlorodiben2o-p-dioxin M+2 403.853 *Hexachlorodibenzo-p-dioxin M+4
481.698 Tetrabromodibenzofiiran M+2 483.696 Tetrabromodibenzofiiran M+4
483.714 Tetrabromodiphenyl ether M+2 485.712 Tetrabromodiphenyl ether M+4 493.738 '^Tetrabromodibenzofiiran M+2
495.736 Tetrabromodibenzofiiran M+4 563.622 Pentabromodiphenyl ether M+4 565.620 Pentabromodiphenyl ether M+6 643.530 Hexabromodiphenyl ether M+6 466.973 PFK (lock mass)
Groi^ 2 - 16:50 -- 25:00 minutes
MASS ANALYTE ION TYPE
561.606 Pentabromodibenzofiiran M+4
563.604 Pentabromodibenzofiiran M+6
563.622 Pentabromodiphenyl ether M+4 565.620 Pentabromodiphenyl ether M+6
573.646 Pentabromodibenzofuran M+4 575.644 Pentabromodibenzofiiran M+6 643.530 Hexabromodiphenyl ether M+6
645.528 Hexabromodiphenyl ether M+8
set up as for PBDDs and PBDFs. Instrumental conditions were also the same although a different experiment was used for SIM (Refer to Table 2.4). Isotopically labeled internal standards were not available for the respective PBDPEs, therefore, quantitation was
based on respective ^^C PBDFs. TBDPE was quantified with respect
to ^^C TBDF and ^^C PeBDF was used as a surrogate for ^^C PeBDPE
and ^^C HxBDPE. Identification of respective PBDPEs was based on
isotope ratios of halogen fragments and on relative retention
times.
Response factors were based on a one point calibration. It was assumed that the calibration curve was linear through the origin. Response factors were calculated by analyzing a solution of DE-71 (the precursor to PBDDs and PBDFs contained in the PUF combusted) at a known concentration. Samples contained the same isomers of PBDPEs as those present in the DE-71 solution.
Response factors were obtained by introducing 1/il of DE-71 at
1405 ng/jul along with l/il of a solution containing ^^C TBDF and
'^C PeBDF at 250 pg/jul (the concentration of internal standard in
a 50jul extract of particulate samples assuming 100% extraction efficiency). Lutes (1991) has determined that TBDPE, PeBDPE and HxBDPE constitute 40%, 57% and 3% respectively of DE-71. Thisfinding was utilized to arrive at response factors for TBDPE, PeBDPE and HxBDPE.
PAH Analysis;
program was used for gas chromatographic separation of the
analytes. The initial temperature was 120°C for 1 min.,
increased at a rate of 20°C/min. to 170°C and then 6°C/min. to
300°C followed by a four minute hold. The column head pressure
was maintained at 15 PSI yielding a helium flow rate of 0.10
ml/min. Dwell time was set at 80 msec./ion at a resolution of
10,000. The elution of PAHs was categorized into four time
windows as described in Table 2.5. One ion was monitored for
each compound, therefore, identification of PAHs was based on
their respective relative retention times.
Response factors for PAHs (area of PAH/area of
B,fi-binaphthyl) were obtained by using SRM 1647b (NIST, Gaithersburg,
MD). A four point calibration curve was constructed by using
1:5, 1:10, 1:20 and 1:50 dilutions of SRM 1647b (see Table 2.6)
containing the internal standard ;ff,/ff-binapthyl at 1 ng/^l.
TABLE 2.5
PAHs Monitored in HRGC/HRMS and Time Windows
Groiq) 1 - 4:00 - 11:00 minutes
MASS ANALYTE
128.063 Naphthalene 152.063 Acenaphthylene 154.078 Acenaphthene 166.078 Fluorene
161.990 PFK (lock mass)
ION TYPE M+
M+ M+ M+
Groiq> 2 - 4:00 - 11:00 minutes
MASS ANALYTE
178.078 Phenanthrene 178.078 Anthracene
202.078 Fluoiauihene 202.078 Pyrene
192.989 PFK (lock mass)
ION TYPE
M+
M+ M^
M-i-Groiq) 3 - 11:00 - 20:00 minutes
MASS ANALYTE ION TYPE
228.094 Benz[a]anthracene (BaA) M+
228.094 Chrysene M+
252.094 Benzo[b]fluoranthene (BbF) M+ 252.094 Benzo[k]fluoranthene (BkF) M+ 252.094 Benzo[a]pyrene (BaP) M+ 254.110 fl,fl-Binaphthyl M+
242.986 PFK (lock mass)
Group 4 - 20:00 - 28:00 minutes
MASS ANALYTE ION TYPE
254.110 B,B-Binaphthyl M+
276.094 Ben2o[ghi]perylene (BghiP) M+ 276.094 Indeno[l,2,3-cd]pyrene (IP) M+ 278.110 Dibenz[a,h]anthracene (DBA) M+
TABLE 2.6
Standards Used for PAH Calibration Curves
ANALYTE Naphthalene Acenaphthylene Acenaphthene Fluorene Phenanthrene Anthracene Fluoranthene Pyrene BaA Chrysene BbF BkF BaP BghiP IP DBA B,B-Binaphthyl
******** DUutions of SRM 1:5 1:10
1647b ******** 1:20 1:50 3.96 1.98 0.99
0.396 1
3.23 1.615 0.8075 0.323 3.978 1.989 0.9945 0.3978 1.552 0.776 0.388 0.1552
0.788 0.394 0.197 0.0788
0.94 0.47 0.235 0.094
0.984 0.492 0.246 0.0984 1.676 0.838 0.419 0.1676 0.788 0.394 0.197 0.0788 0.738 0.369 0.1845 0.0738 0.832 0.416 0.208 0.0832 0.94 0.47 0.235 0.094 0.984 0.492 0.246 0.0984 0.752 0.376 0.188 0.0752 0.874 0.437 0.2185 0.0874 0.728 0.364 0.182 0.0728
1 1 1
1 1
CE
O < u. UJ
CO z
o Q.
CO
m
0.35
0.05
-0.2 0.4 0.6
CONCENTRATION (ng/n.!)
0.8
UJ 0) z
o
a.
CD
UJ
Fluoranthene
0.4 0.6 0.8
CONCENTRATION (ng/nO
O
I
u.
UJ
(0
z o
Q.
(0
UJ
u:
Pyrene
0.1 0.3 0.5 0.7 0.9 1.1 1.3 CONCENTRATION (ng/ul)
1.5 1.7
I
lU
m z
o Q. (0
1
0.2 0.4 0.6
CONCENTRATION (ng/jAJ)
0.8
tr o
<
u. LU
CO z o CL W LU
Chrysene
0.2 0.4 0.6
CONCENTRATION (ng/tiO
RESULTS AND DISCUSSION
PBDD and PBDF Analysis:
"High Temperature" Experiments;
As mentioned previously, "high temperature" experiments are
categorized as burns carried out in the temperature range
700-800°C. Two "high temperature" experiments were carried out in
order to demonstrate that the work of Lutes et al. (1992) could
be repeated. TBDF, PeBDF and TBDD were the compounds detected.
It was not possible to identify specific isomers since
appropriate standards were not available. TBDF, PeBDF and TBDD
isomers were detected in accordance with the identification
criteria specified in the last chapter. In all experiments TBDF
concentrations were greater than TBDD. Figure l.l evinces that
formation of PBDDs from PBDPEs is an intermolecular process while
the formation of PBDFs from PBDPEs is most likely an
intramolecular process. This elucidates the predominance of
PBDFs over corresponding PBDDs in the filter samples collected
from our experiments. Buser (1986), Bieniek et. al. (1989),
Czuczwa and Kites (1984), Visalli (1987) have also reported
similar findings related to dioxin and furan concentrations in
environmental samples.
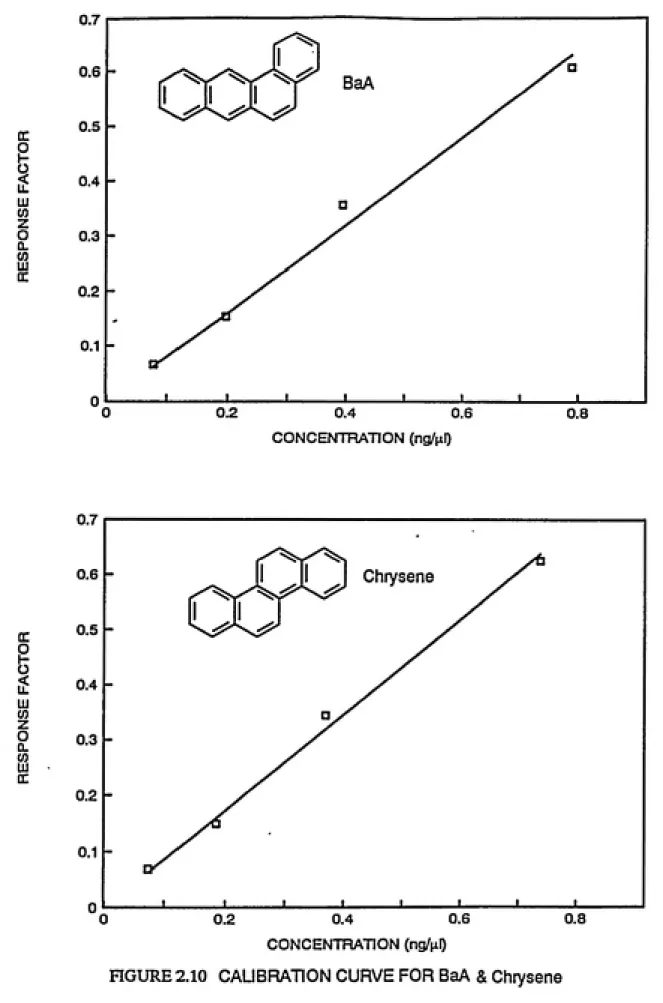
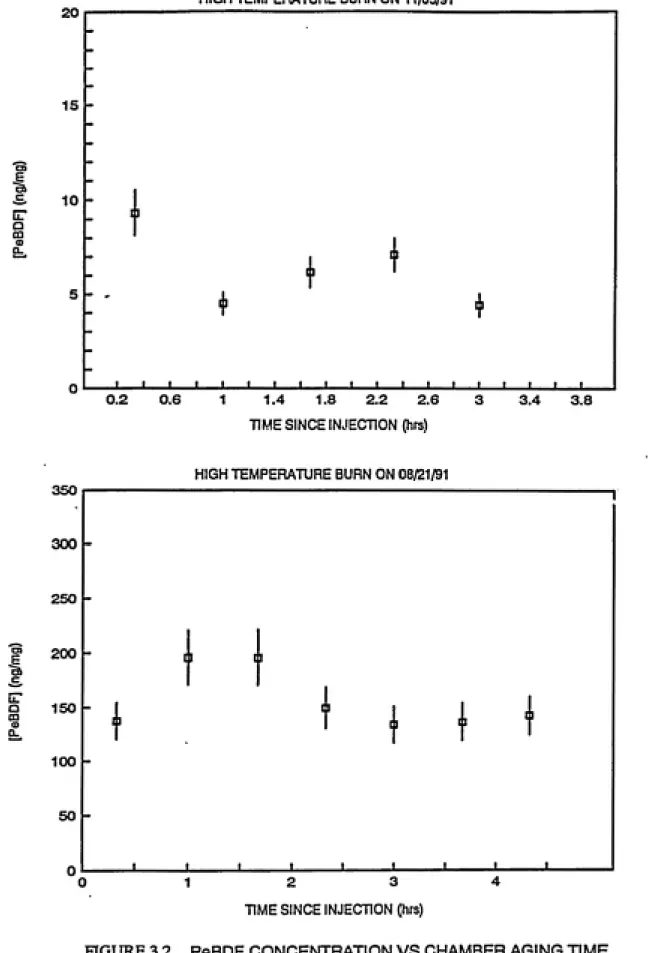
As mentioned in the previous chapter, two "high temperature"
experiments were carried out on August 21, 1991 and on November
5, 1991. Behavior of TBDF, PeBDF and TBDD over time in the
presence of sunlight is shown in Figures 3.1, 3.2 and 3.3
ͣ
a
Q
30
20
10
HIGH TEMPERATURE BURN ON 11/05/91
t I
Qi____I---1___I___I---1---1___I___I___I___I___I___I___1___I___' ͣ ' ' ͣ
0.2 0.6 1 1.4 1.8 2.2 2.6 3 3.4 3,8 TIME SINCE INJECTION (hrs)
HIGH TEMPERATURE BURN ON 08/21/91
a>
E
ͣ
5>
GT
Q ffl
b.
D 1 2 3
TIME SINCE INJECTION (hrs)
HIGH TEMPERATURE BURN ON 11/05/91
t
cr
a
m
e
a.
0.2 0.6 1 1.4 1.8 2.2 2.6
TIME SINCE INJECTION (hrs)
3.4 3.8
c
o Q.
350
300
HIGH TEMPERATURE BURN ON 08/21/91
-250
-200
-1 -11
150
1 1
f 1 1
1 * *
T 1
100
-50
n
-_1_____ 1... J— 1 1 1 1 • 1
0 1 2 3 4
TIME SINCE INJECTION (hrs)
HIGH TEMPERATURE BURN ON 11/05/91
Q
Q
1.4 1.8 2.2 2.6 3.4 3.8
HIGH TEMPERATURE BURN ON 08/21/91
2 3
TIME SINCE INJECTION (hrs)
deviations (Lutes, 1991). Table 3.1 shows the results of
regression analysis of concentration (mass of analyte/mass of
particulate) against time on these curves. The units of slope in
all cases is concentration per time, therefore, it may be
ng/mg/hr or jug/mg/hr depending upon the units of concentration
for the particular compound. This format has been followed for
other such analyses in this chapter.
From Table 3.1, it is evident that the slopes are
insignificant at a 10% significance level. Hence, it can be
concluded that there is no significant decay of these compounds.
These results also support conclusions by Lutes et. al. (1992).
Laboratory experiments performed by Buser (1988) for the
photostability of PBDDs and PBDFs sorbed on solid surfaces are in
better agreement with these observations as opposed to
photodegradation experiments conducted in solutions. Solid phase
photolysis involved dispersion of compounds as thin films in
quartz vials. These experiments yielded half-lives of
approximately 30 hrs for 1,2,3,4-TBDD, TBDD and
2,3,7,8-TBDF. Half-lives were of the order of minutes when the same
compounds were photolyzed in i-octane solution. Therefore,
results from solution-phase experiments can underestimate the
half-lives of PBDDs and PBDFs on atmospheric soot particles from
high temperature combustion.
Perusal of Table 2.1 reveals that conditions with respect to
relative humidity and chamber temperature for the experiment on
TABLE 3.1.
Significance of the Slopes of Concentration vs Time Plots
High Temperature* Experiments
August 21,1991 November 5,1991
Compound Slope P-value R-Sq. Slope P-value R-Sq.
TBDF -0.2371 0.3586 0.2116 -1.4436 0.1342 0.5808 PeBDF -8.8167 0.3593 0.2111 -1.0836 0.322 0.3181 TBDD 0.1246 0.8344 0.0123 0.0126 0.7985 0.0253
PC-SAS was used for Linear Regression Analysis Units of Slope are Concentration/Time
Level of Significance = 10%
However, the stable behavior of the analytes in both cases
renders these parameters inconsequential in assessment of the
atmospheric stability of brominated dioxins and furans.
"Low Temperature" Experiments;
"Low temperature" burns were conducted on August 21, 1991
and May 21, 1992. These experiments were carried out in the
temperature range 400-500°C. No TBDD could be detected in the
samples collected from the latter experiment, hence, a "low
temperature" experiment was conducted on October 3, 1992 to
verify TBDD behavior observed in August 21, 1991 experiment. The
results from these experiments are presented in Figures 3.4, 3.5,
3.6 and 3.7. Linear regression analysis was performed on these
curves to test for the significance of slopes and the appropriate
p-values have been included in Table 3.2.
Significant negative slopes for TBDD is an indication of
unstable behavior. Assuming a first-order decay of TBDD yields
half-lives of 1.46 (r2=0.90) and 2.06 (r2=0.51) hrs for October
3, 1992 and August 21, 1991 experiments respectively. This is a
departure from the stable TBDD behavior exhibited in "high
temperature" experiments and the half-lives are more comparable
to the solution-phase experiments by Buser (1988). This
difference can be explained on the basis of particle
characteristics.Particulate matter collected on the filters revealed a
different color for the two kinds of experiments. Particulate
a
E
ͣ
9k
c
^^
IT
Q
CD
t
LOWTEMPERATURE BURN ON 05/21/92 150
100
-- .
1 T 1 1
-ͣ
50
.
T
1 '\ ' 1
0 1 1
n
-' —1____1____I—...1---J—1—1—1—1—1—J—1— 1 1
0.3
0.2 0.6 1 1.4 1.8 2.2 2.6
TIME SINCE INJECTION (hrs.)
LOW TEMPERATURE BURN ON 08/21/91
0.2
-3
E "a
o
TIME SINCE INJECTION (hrs.)
"LOW TEMPERATURE" PARTICLE "HIGH TEMPERATURE" PARTICLE
Organic layer With ^^^BP^F.^PI.-Sl'^^^n^l^^^f.
PBDDs, PBDFs.etc, dissol
Aerosol Core
PBDD, PBDF.etc, molecules
nmanir iflwor with rouu, rDUP.eic, moiecuies
pS?Ds, fe^s'^te. dissolved o^ adsorbed on the aerosol core
Aerosol Core i^— Aerosol Core
nGURE3.8 POSTULATED COMPOSITION OF PARTICLES GENERATED FROM COMBUSTION EXPERIMENTS
while diesel soot has a thin organic coating of predominantly
non-polar compounds (Japar et al., 1984; Schuetzle et al., 1981). McDow et al. (1991, 1992) have shown that the presence of
methoxyphenols enhances the photodegradation of PAHs in solution. Differences in physical and chemical properties of the
particles generated from the "high temperature" and "low
temperature" experiments may account for the incongruence in TBDD behavior between the two kinds of experiments. Absence of an organic layer coating in particles from "high temperature" experiments can be expected as most of the volatile organics should be oxidized and there should be very little PICs to form the organic layer. Thus particles from "high temperature"
experiments mimic the solid-phase experiments carried out by Buser (1988) while particles from "low temperature" experiments may be similar to the solution-phase experiments as PBDDs and PBDFs may be dissolved in the organic layer surrounding the carbon core. For degradation of PBDDs and PBDFs dissolved in hydrocarbon solution reductive debromination has been suggested as the major decomposition pathway and occurs predominantly from the higher brominated carbon-ring and from the lateral-positions
(Buser, 1988). The final products under these conditions are
believed to be unsubstituted dibenzodioxin and dibenzofuran,
which can undergo further reaction. A mechanism for such a
pathway has been shown in Scheme 1. Such a mechanism for
degradation of TBDD can also be prescribed for our experiments.
di-BDDs
mono-BDD(s)
further degradation
Br Br Br ^^
OH OH OH
SCHEME 2 POSSIBLE PATHWAY FOR TBDD DEGRADATION INVOLVING CLEAVAGE OF DIOXIN UNKAGE
phenolic compounds by cleavage of the dioxin linkage (Hosaya et
al., 1993). This mechanism has been depicted in Scheme 2.
Examination of Table 3.2 reveals that the slopes of TBDF and
PeBDF are significant at a 10% level for all the experiments and
the positive nature of the slope indicates that there is
production of these compounds over time. Buser (1986) has shown
that thermolysis of PBDPE flame retardants at temperatures of
510°C causes about 10% decomposition of the PBDPEs leading to the
formation of PBDDs and PBDFs at a combined level of around
0.5-1%. These numbers should be reasonably valid for our "low
temperature" experiments where temperatures are around 450°C.
This implies that around 90% of the PBDPEs are unburnt which can
photolyze to yield PBDFs and PBDDs. In fact. Lutes et. al.
(1992) have demonstrated that there is 0.06% yield of TBDF over a
four hour period from photolysis of flame retardant mixture DE-71
(exposed on filters in smog chambers), which is used in our
system. Watanabe et. al. (1987) carried out solution-phase
experiments for the formation of PBDDs and PBDFs from UV
irradiation of decabromodiphenyl ether (DeBDPE). This study
arrived at a yield of 20% over a sixteen hour period for the
total amount of PBDFs. In another study photolysis of 2,2*4,4', 5
pentachlorodiphenyl ether (PeCDPE) dissolved in cyclohexane
yielded 14% TCDF after 4 hrs (Choudhry et al., 1977). These
observations can be used to rationalize the production of TBDF in
the "low temperature" experiments. Buser (1986) has also
around 630°C, therefore, in "high temperature" experiments there
should be very little unburnt PBDPEs in the chamber. Photolysis
of this residual PBDPEs will yield insignificant amounts of
PBDFs.
The major reaction pathway for formation of halogenated
dibenzofurans from photolysis halogenated diphenyl ethers
involves dehalogenation and ring closure to halogenated
dibenzofurans (Norstorm et al., 1976; Watanabe et al., 1987).
This implies that unburnt PeBDPE and HxBDPE from "low
temperature" experiments can photolyze to yield TBDF. Formation
of PeBDF can take place from photolysis of HxBDPE. Also, this
implies that any degradation of PBDFs could have been confounded
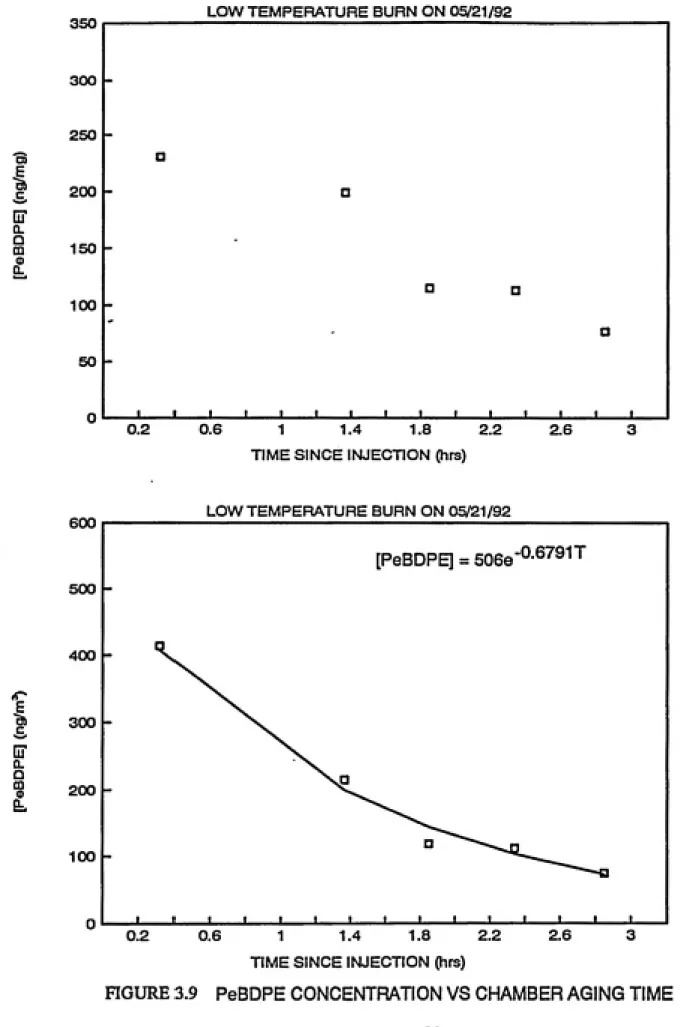
by this production.In order to assess the production of TBDF from possible
photolysis of residual PBDPEs, samples collected from the "low
temperature" experiment on May 21, 1992 were split into two after
the florisil column for PBDPE analysis. Smith et al. (1984) have
mentioned the possibility of PCDPEs being retained by the carbon
column, hence this was excluded for analysis of PBDPEs. Results
from HRGC/HRMS analysis of PBDPEs are shown in Figures 3.9 and
3.10. Corresponding behavior of TBDF (ng/m^) over time is
plotted in Figure 3.11. In units of concentration as ng/m^, TBDF
is stable over time. Therefore, the rate constant for TBDF
concentration is zero. This rate constant is comprised of three
components: a) production of TBDF due to ether photolysis (k^) b)
[T
Q CQ
0)
Q.
60
50
LOWTEMPERATUREBURNON 05/21/92
-40
-30 _
T
20
10
-
, •
1 ͣ
ͣ
1
n , , 1 1 1 i 1 1 1 1 1 1 1 t 1
0.2 0.6 1 1.4 1.8 2.2
TIME SINCE INJECTION (hrs.)
2.6
LOW TEMPERATURE BURN ON 08/21/91
E
o> Cl
Q
m (D Q.
0.2 0.6 1 1.4 1.8 2.2 2.6 3
TIME SINCE INJECTION (HRS.)
3.4 3.8
a
m
45
40
LOW TEMPERATURE BURN ON 10/03/92
-35
-30
-25
11 20
-15
-i 1
10
5
n
-•
+
1 1 1 1 1 1
*
I ... 1 2 3
TIME SINCE INJECTION (hrs)
5"
a
CO
b.
1.2
LOW TEMPERATURE BURN ON 08/21/91
0.2 0.6 1 1.4 1.8 2.2 2.6
TIME SINCE INJECTION (hrs)
E
c
c Q
CD
b.
150
LOW TEMPERATURE BURN ON 10/03/92
100
50
-1
ih
. II
.11
+
"
_
:
II 1 1 1 1 1 ____1____ 1
TIME SINCE INJECTION (hrs.)
LOW TEMPERATURE BURN ON 10/03/92
0)
E
ͣ
&
_c
C Q
CQ
0
Q.
2 3 4
TIME SINCE INJECTION (hrs.)
TABLE 3.2.
Significance of the Slopes of Concentration vs Time Plots
'LowTennperature'' Experiments
August21,1991 May 21, 1992 October 03,1992
Compound Slope P-value R-Sq. Slope P-value R-Sq. Slope P-value R-Sq.
TBDF -0.2371 0.3586 0.2116 17.7374 0.0005 0.9622 6.5104 0.0323 0.7214 PeBDF -8.8167 0.3593 0.2111 8.6244 0.0015 0.9894 0.2419 0.0064 0.8727
TBDD 0.1246 0.8344 0.0123 N/A N/A N/A -4.4803 0.0237
0.7595 1
PC-SAS was used for Linear Regression Analysis Units of Slope are Concentration/Time
dark brown or black in color while those from the "low
temperature" experiments were light brown in color. Korfmacher
et al. (1980) have argued that there may be an "inner-filter"
effect: the darker substrates absorb more of the incident light
which can reduce the rate of photolytic degradation of compounds
adsorbed on the substrate. Another argument that can be put forward is the availability of higher specific area for the
particles generated from "low temperature" experiments.
Particle composition is also a factor. There is a
possibility that particles from "low temperature" experiments
have an aerosol core with a coating of an organic layer with
PBDFs and PBDDs dissolved in this organic layer as opposed to
just an elemental core for particles from "high temperature"
burns. An illustration of this concept is provided in Figure
3.8. Such a model would imply solution-phase photodegradation in
the case of "low temperature" experiments. The organic layer may
be constituted of products of incomplete combustion. It has
been shown by Rau (1989) and Kamens et al. (1988) that wood smoke
contains little elemental carbon and organics typically represent
more than 90% of the total mass. In contrast, elemental carboncan constitute upto 50% of diesel exhaust (Watson, 1979) .
Further, Yu and Kites (1981) have found that only 10-40% of the
mass is extractable in organic solvents. The chemical
composition of the organic layer itself can influence the
photodegradation. Wood smoke is composed of almost entirely
CB
I
C ET Q. Q CO E c cr a. Q CO 0 350 300LOW TEMPERATURE BURN ON 05/21/92
-250
-a
200 - a
150
-100 tm
a q
' D
50
n 1 ...-J 1 1 1 1 1 1 1 1 1 1 1 1 1
600 500 400 300 200 100
-0.2 0.6 1 1.4 1.8 2.2 2.6
TIME SINCE INJECTION (hrs)
LOW TEMPERATURE BURN ON 05/21/92
1
V
[PeBDPE] = 5066"°-^^®'''^
u
\
x^
u
^^"^^~~^"---1 » I 1 . ,i 1... J____l_ ...1 1 1 1
0.2 0.6 1 1.4 1.8 2.2 2.6 3 TIME SINCE INJECTION (hrs)
Q. Q CD X I 60
50
-LOW TEMPERATURE BURN ON 05/21/92
3 40
E c 30 20 10 -r a 1 -0 o a a ^ "•
L---1---1--- r...1, -.1___ • 0.2 0.6 1 1.4 1.8 2.2
TIME SINCE INJECTION (hrs)
2.6 E oi a. o (0 X I 100 90 80 70 60 50 40 30 20 H 10 0
LOW TEMPERATURE BURN ON 05/21/92
r '
[HxBDPE] = 77e°*'2^'r
U ͤ h a ^
°^"^--..^a^
-ͣ'_____1_____1__ ,...1...—,J_____L_ I____1____1____1---1---1---1---1____
0.2 0.6 1 1.4 1.8 2.2
TIME SINCE INJECTION (hrs)
2.6
LOW TEMPERATURE BURN ON 05/21/92
E
a c,
C G OQ
b
0.2 0.6 1 1.4 1.8 2.2
TIME SINCE INJECTION (hrs)
2.6
LOW TEMPERATURE EXPERIMENT ON 05/21/92
O
z
_1
SFfi TRACER CURVE
0.995
0.985
0.975
0.965
0.955
TIME SINCE INJECTION (hrs)