Software Reuse Metrics for an Industrial Project
Richard N. Ferri Raghavan N. Pratiwadi Lynn M. Rivera [email protected] [email protected] [email protected]
Mohammed Shakir John J. Snyder D. W. Thomas
[email protected] [email protected] [email protected]
AT&T Network and Computer Services 480 Red Hill Road
Middletown, NJ 07748-3098 USA
Yih-Farn Chen Glenn S. Fowler Balachander Krishnamurthy Kiem-Phong Vo [email protected] [email protected] [email protected] [email protected]
AT&T Labs – Research 180 Park Avenue
Florham Park, NJ 07932-0971 USA
Abstract
In 1990 a project was established at AT&T to build applications that manage telephone systems. Since then the project has successfully completed over 20 applications comprising about 500,000 lines of source code. These sys-tems are used daily by hundreds of managers and operators to monitor and provision the AT&T long distance telephone network. The project's success can be attributed directly to an early commitment in making software reuse a major component of its software development process. A critical factor was the establishment of a feedback loop between consumers and producers of reusable software to foster con-tinual improvement and extension of reusable code reposi-tories. Progresses in the feedback loop are measured by five different reuse measures. While no one measure is “best” as each provides a different perspective on reuse, two derived from the consumer/producer model have proven particu-larly useful: use of reusable library components and reuse growth factor. The latter, developed in this study and de-scribed below, helped uncover a new opportunity for reuse that was not obvious from other measures.
To Be Published in: Proceedings of the
Fourth International Symposium on Software Metrics IEEE Metrics ' 97
Albuquerque, New Mexico, USA November 5 - 7, 1997
Introduction
In 1990 a group of software engineers at AT&T em-barked on designing and building a set of interactive end-user systems to collect and display data generated by telecommunications switches for use by designers, engi-neers, planners, and managers. From the outset, the project committed to a framework for software reuse to increase de-velopment effectiveness by leveraging from the many com-mon tasks in the application suite. The software reuse framework consisted of three major components:
Employing a layered software architecture [15] with
layers ranging from very high-level code with param-eterized macros to fairly low-level C code interfacing directly with file and database systems,
Forming a single organization containing both
con-sumers and producers of reusable software compo-nents, and
Fostering close communications between consumers
and producers (in some cases, they are the same peo-ple) of reusable software components.
As a result of this reuse framework, the software devel-opment process contains an inherent feedback loop between consumers and producers of reusable software in which:
Consumers advise producers of their needs on an
on-going basis, and
Producers observe how applications use their software
In this way, existing components are continually im-proved and extended to meet new requirements while new components may be added. The practice of copying and modifying code is minimized and confined only to where there are no existing components covering newly found re-quirements. Reuse measures were introduced to the project in 1995 to serve as a check on reuse levels and helped un-cover new reuse opportunities.
At this time, the project consists of over 20 industrial ap-plications comprising some 500,000 lines of code. These systems are used daily to monitor and provision our tele-phone network. Level of software reuse is high. The top 50 reusable components are called anywhere from 100 to over 10,000 times across applications and certain applica-tions approach 60% of reusable code.
Five objective reuse measures [4] have been applied to the code to estimate current impact of reuse and stimulate new reuse. While each measure has strengths and weak-nesses (see Table 7 in the Discussion section), two derived from the consumer/producer model [2] have been particu-larly useful: use of reusable library components (for pro-ducers) and reuse growth factor (for consumers). The latter, developed in this study and introduced in the Measurements section below, helped identify a new opportunity for reuse that was not obvious from other measures.
This study describes the environment created to support software reuse in developing a family of products and ex-plores how software reuse metrics and measurements can be used to help encourage and support software reuse.
The Project
The daily management of a telephone network comprises many activities. For example, a major part is provision-ing [13], which collects, monitors and equips switches, re-views trunk forecasts, and develops plans for the order, in-stallation, or removal of equipment. Much of the raw data are generated automatically by the switches and processors in the telephone network. Portions of this data are peri-odically downloaded onto other systems and stored in re-lational databases for access and analysis. Over the years, many ad hoc software tools were built to support these ac-tivities. Around the late ' 80s at AT&T, it became clear that existing tools had become too cumbersome to use by aver-age telephone operations staff.
In 1990, a project was started to build applications that tied together many of the existing tools and to build new tools more suitable for the management of a modern tele-phone network. For this task, the team chose EASEL[14, 6] a language and system to build end-user applications based on interactive constructs such as windows, forms, menus, and hypertexts. Data manipulation and analysis for appli-cations and their users can be performed by EASEL code
or can be handed out to existing computational tools writ-ten in other languages. This is facilitated by EASEL lan-guage constructs that map into two broad programming cat-egories [15] shown in Figure 1.
Design Programming
Activities focused on the user interface and high-level tasks as seen from the user' s point of view.
Computation Programming
Activities focused on how the high level tasks are to be implemented and with what data structures.
Figure 1. Interactive End-User Systems Archi-tecture
Realizing that many similar application systems would be built, the project committed early to a framework of soft-ware reuse as outlined in the Introduction. The first major part in this framework was to divide a software application into different layers distinguished by different levels of pro-gramming.
Application Frames
Written in EASELto accomplish tasks as seen by end users; typically rely heavily on parameter-ized macros.
Application-Specific C Functions
Functions for a specific application.
Parameterized Macro Library
High-level reusable software components; macro expansion generates EASELcode.
Common Frame Library
These fall into two areas: implementing tasks and subtasks on behalf of the user and providing com-putational capabilities such as string manipula-tion and common screen formats.
Common C Function Library
General-purpose functions, including calls to construct SQL queries for ORACLEdatabases.
Figure 2. The Project’s Layered Architecture
decomposed into components, such as selecting nodes in the network, components of a switch, traffic type, or re-porting intervals. Many subtasks are common to more than one application and are implemented as macros parameter-izable with application-specific values. The macros expand to calls to common frames and C functions which may dy-namically create SQL queries1to access data stored in rela-tional databases. Each of the bottom three layers in Figure 2 constitutes a library of reuable components.
In Figure 3, the application frame
equip menu
shows how components from different architectural layers are used. This frame lets a user select a switch at a given lo-cation and review or update its hardware. The first task is to solicit and verify a location code from the user, (who may type it in or select it from a pop-up menu). This is done by calling the common macroLocation
, which, upon ex-pansion, generates code for several subtasks: call the macroReadFile
with the name of the file to read for current lo-cations, call the common frameMkList
to format the data, write a block of code to conduct the user interaction, and call the common C functionInList
to verify the user' s se-lection. The next task is to obtain the current hardware in-formation from the database for the desired switch; this is done in two steps. First the application frameequip sql
is called with the desired location code to compose an SQL query; this frame hands off most of the work to the com-mon C functionFormSQL
. Second, the query statement is passed to the common frameGoFetch
, which calls the common C functionsExecQuery
to execute the query andFetchTable
to retrieve the query results; these two routines call matching ones in the project' s database accessor to per-form the actual database transactions. The query results are then displayed to the user by theMenuDisp
macro, which manages the display as a scrollable and editable menu. A call to the frameequip change
collects any changes entered by the user; it callsequip sql
to create an SQL update state-ment, which is handed to the application-specific C func-tionequip update
to validate the changes and update the database via the database accessor.The Environment to Support Reuse
The project currently comprises over 20 applications that serve a wide variety of technicians, designers, engi-neers, planners, and managers watching over more than a dozen kinds of network elements, processors, and switches. Team members are assigned to build applications along with reusable components in different layers. Frequent negoti-ation and communicnegoti-ation among team members help the initial interface design to quickly converge. During
imple-1The project' s database accessor was built using Oracle's ProC.
Acces-sor code was not included in this study' s analyses; its functions are called from higher-level C libraries.
mentation, flaws and/or inadequacies in the components are continually discovered. However, the close association be-tween users and providers of the reusable software mini-mizes any tendency to just copy and modify components for current needs. Instead, generic solutions are sought and codified in reusable code.
The creation of valuable reusable software involves much hard work. Our experience in this project parallels that recorded in [9]: the production of reusable software is much more effective when there is an active feedback loop that fosters close interaction between producers and con-sumers of such code. Except for time-proven components (e.g., standard library functions), the lack of such a feed-back loop often leads to the temptation to copy and modify (as occurred in [5]), where knowledge gained in a modifica-tion is quickly lost and convergence to final highly reusable software is not possible.
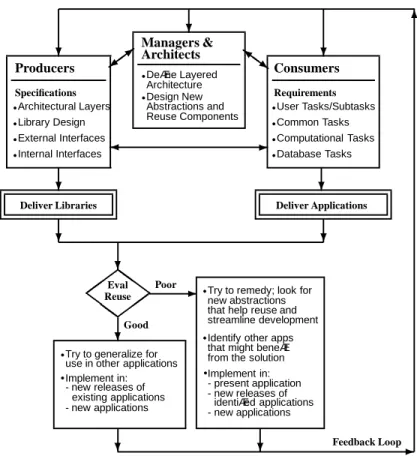
Our model of this active feedback is depicted in Figure 4. Project managers and architects help define the software architecture for the project. Producers of reusable com-ponents use specifications and input from component con-sumers to develop and test reusable components. Applica-tion developers, as the consumers of reusable components, work with user requirements and the reusable components to develop and test applications frames. Once the code for an application has stabilized, software reuse measurements can be made for the application. Producers and consumers, in cooperation with managers and architects, review and evaluate the reuse measures. This process, as shown near the end of the next section, can suggest new abstractions for implementation by producers in the reusable component li-braries and for use by developers in successive versions of applications.
In this project, team members focused on an individ-ual application use the reuse measurements presented in the next section to help understand, evaluate, and improve soft-ware reuse in their specific application. The reuse measure-ments can also be examined across a group of applications, looking for those with exceptionally good and poor mea-surements. By trying to understand the underlying causes of those cases, one endeavors to pass the benefits on to other applications – to improve those with poor values and to mimic those with excellent values,
When considering or practicing software reuse, two questions must be asked about the process:
How effective is reuse at any given time?
How can new reuse opportunities be identified and
de-veloped?
Application
Frames equip_menu
Application C Functions
equip_sql equip_change
Location MenuDisp
GoFetch
equip_update
FormSQL
db_ExecQuery db_Commit
Common Macros
Common Frames
ReadFile
MkList
InList
RowDesc
FetchTable ExecQuery
Common C Functions
db_FetchTable DB
Accessor
Figure 3. A Frame to View and Update Parts of a Switch
q q q q
q q q q
q
q
q
q
q q
q
6
?
?
?
? ?
? ?
?
? Z
Z Z
Z Z Z
-? ?
> =
~ Z Z }
Internal Interfaces Library Design External Interfaces Architectural Layers
Specifications
Database Tasks Computational Tasks Common Tasks User Tasks/Subtasks
Requirements
Consumers Producers
Deliver Libraries Deliver Applications
Eval Poor
Good
Try to generalize for use in other applications
- new applications existing applications - new releases of Implement in:
Try to remedy; look for new abstractions that help reuse and streamline development Identify other apps that might benefit from the solution Implement in: - present application - new releases of
identified applications - new applications
Managers & Architects
Define Layered Architecture Design New Abstractions and Reuse Components
Feedback Loop Reuse
Objective Reuse Measures
A variety of software reuse models and measures have been proposed in the literature [7, 8, 10, 11]. Based on a consumer/producer model [2], Chen, Krisnamurthy and Vo [4] introduced the idea of code-based objective, com-plete, and precise reuse measures. Objective measures start with fixing some chosen code granularity such as shipped source [12], compilation units [1], files, functions, lines of code, etc. Then a complete and precise measure calculates exactly the amount of reusable code required for the func-tioning of the application being measured. Reference [4] described a model and methodology to compute such reuse measures. In particular, specific measures for the C lan-guage were proposed based on the C Information Abstrac-tion System, CIA [3]. We follow their lead and the reuse measures used here build on their model. The perspective of their work was mainly on producers of reusable com-ponents. In this study, the additional and somewhat differ-ent needs of consumers of reusable compondiffer-ents (the appli-cation developers) helped extend their model for two new measures (see below).
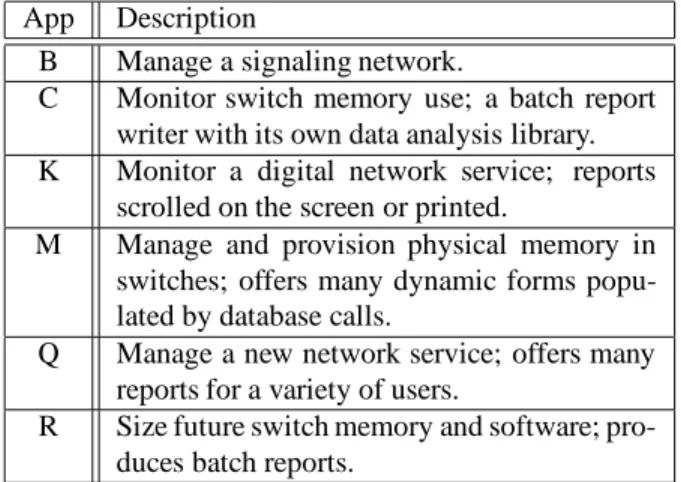
Since the project uses two different programming lan-guages, EASEL and C, the common code granularities adopted include: (1) macros, frames, and functions, at one level and (2) the number of non-comment source lines (NCSL) at another. Software reuse measures were applied to the source code of 20 project applications comprising nearly 500,000 lines of code. To keep the tables in this re-port manageable and readable, measurements are presented below for 6 of the 20 analyzed applications, selected to help highlight various points in the discussion and to show the diversity within the family of applications.
App Description
B Manage a signaling network.
C Monitor switch memory use; a batch report writer with its own data analysis library. K Monitor a digital network service; reports
scrolled on the screen or printed.
M Manage and provision physical memory in switches; offers many dynamic forms popu-lated by database calls.
Q Manage a new network service; offers many reports for a variety of users.
R Size future switch memory and software; pro-duces batch reports.
Table 1. Six of Twenty Applications Studied
The five reuse measures used in this study are:
Code expansion via macros,
Reuse frequencies of library components, Reuse percentages of library components, Code profiles, and
Reuse growth factors.
Each measure reveals some aspect of software reuse and leads to different insights and observations about the code. Code profile and reuse growth factor are derived below in this study from the model in reference [4].
Code expansion via macros
The highest layer of reusable code consists of macros that implement parameterized, high-level reusable objects and generate EASEL code. These macros encapsulate de-tails of complicated tasks that are tedious to implement di-rectly in EASEL. For example, a common construct to dis-play information is a dynamic form in which the total num-ber of form fields is a run-time parameter; fields are typi-cally populated by database calls and may be edited by users to update the database (after passing any required valida-tion procedures). Some applicavalida-tions include many dynamic forms of varying sizes. Using the macros, a developer can specify the needed form in a dozen lines of code, which may be expanded to hundreds of lines of EASELcode.
Application Frames
App No. Source Generated Expansion
Frames NCSL NCSL Factor
B 34 2,511 5,629 1 : 2.24
C 4 251 734 1 : 2.92
K 133 7,320 23,449 1 : 3.20
M 178 8,251 62,277 1 : 7.55
Q 248 26,497 81,216 1 : 3.07
R 112 7,372 15,368 1 : 2.08
Code Generated by Macro Calls
Table 2. Code Expansion Factors
Code expansion factors affirm to developers that reuse is significant and encourage them to make more extensive use of the macros. The literature, however, suggests that code expansion factors overstate reuse (see [2]), as the code gen-erated by a macro is counted each time the macro is used. Furthermore, this measure does not account for reuse of im-portant components in other architectural layers, such as the reusable frames and reusable C functions in this project.
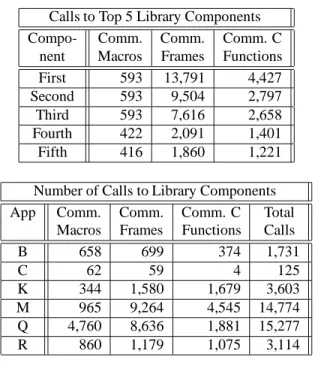
Reuse frequencies of library components
As a part of on-going maintenance of reusable code, it is useful to know usage frequencies of various components. Frequently used components are often tested and well-designed, so less maintenance effort is needed for them while infrequently used components need more examina-tion.
Calls to Top 5 Library Components
Compo- Comm. Comm. Comm. C
nent Macros Frames Functions
First 593 13,791 4,427
Second 593 9,504 2,797
Third 593 7,616 2,658
Fourth 422 2,091 1,401
Fifth 416 1,860 1,221
Number of Calls to Library Components
App Comm. Comm. Comm. C Total
Macros Frames Functions Calls
B 658 699 374 1,731
C 62 59 4 125
K 344 1,580 1,679 3,603
M 965 9,264 4,545 14,774
Q 4,760 8,636 1,881 15,277
R 860 1,179 1,075 3,114
How Often Library Components Are Called
Table 3. Reuse Frequencies
The top portion of Table 3 shows how often the top five components in each library are called by all applications. The three most popular common macros (used 593 times) are typically used as a set. Though it is not true here, such a numerical coincidence is sometimes useful in pointing out a higher level abstraction that can encompass the given macros. The common reusable frame with the highest num-ber of calls, 13,791, is used for displaying current status information.
The lower portion of Table 3 shows how many calls each application makes to components in each of the libraries,
with the last column showing the total number of compo-nent calls for each application.
While high numbers in either portion of the table re-flect favorably on reuse, they are unnormalized frequency counts. An application with twice as much code might have twice as many calls to reusable components, yet the inten-sity of reuse may be similar.
Reuse percentages of library components
Producers of reusable components are often interested in finding out how much of a library is being used by ap-plications (see [4]). Table 4 reports the number of com-ponents called in each of the project libraries. The INLIB row shows the total number of components in each library, including internal library functions, and the fact that all of them (100%) are being used.
Comm. Comm. Comm. C
App Macros Frames Functions
No. % No. % No. %
B 48 43 27 45 97 44
C 17 15 10 16 6 2
K 44 39 21 35 90 41
M 46 41 25 42 118 54
Q 46 41 18 30 71 32
R 37 33 20 33 103 47
InLib 111 100 59 100 217 100
How Much Is Reused From Each Library
Table 4. Use of Reusable Library Components
Application B makes use of 45% of the common frames while Application M uses 54% of the common C func-tion library. From the point of view of managing the reuse feedback cycle, such high percentages indicate that library producers can benefit from direct communications with ap-plication developers to learn of possibilities for improving components in reusable libraries.
Application C, on the other hand, makes only modest use of the three common reusable component libraries; the next metric reveals more about this application.
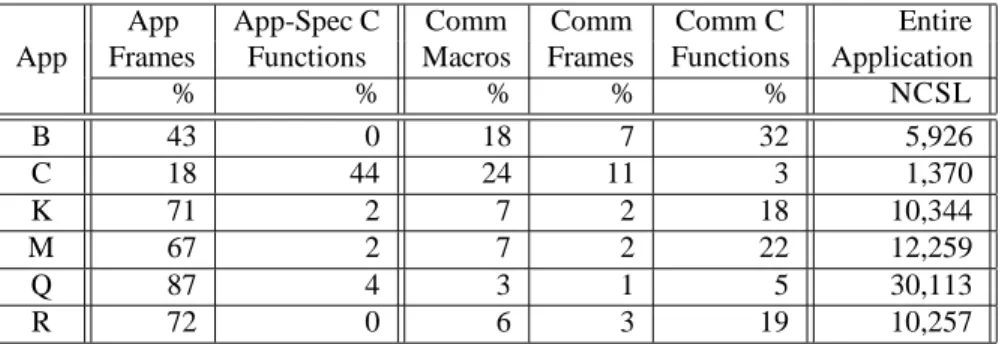
Code profiles
App App-Spec C Comm Comm Comm C Entire App Frames Functions Macros Frames Functions Application
% % % % % NCSL
B 43 0 18 7 32 5,926
C 18 44 24 11 3 1,370
K 71 2 7 2 18 10,344
M 67 2 7 2 22 12,259
Q 87 4 3 1 5 30,113
R 72 0 6 3 19 10,257
How Much Code Written In Each Architectural Level Is Used By An Application
Table 5. Application Profiles
been written had the resuable components not been avail-able from other applications. Although this is hard to an-swer in general, an approximate anan-swer can be obtained by collecting all components used by each application and pretending that they were implemented for that application. The amounts of code collected at the different architectural layers form the code profile for an application.
Each row in Table 5 shows the percentage of an appli-cation' s total NCSL that resides in each architectural layer (as described in Figure 2). The percentages across a row sum to 100%. The table points out useful information, such as Application B makes extensive reuse of the common li-brary components which comprise 57% (18 + 7 + 32) of its code profile. It is also seen here that Application C, which makes only light use of the common libraries, as noted in Table 4, has 44% of its code in its own analysis library, due to its dependence on unique databases and specialized re-ports. But even this specialized library benefits from moder-ate use of common macros, which, in turn, access common frames and common C functions. Application Q also makes little reuse, with application-specific code comprising 91% (87 + 4) of its profile. This means that a new application resembling B may be potentially easier to build than one re-sembling Q. The next metric provides another perspective on application Q.
Reuse growth factors
Once one has a code profile, one can focus more closely on the application-specific layers and ask how much the code written at these layers “grows” as it links in needed reusable components from lower architectural layers. The total size of all needed code (as indicated by the total NCSL derived in the application profiles, Table 5) relative to the amount of code in the top two application-specific layers is termed the reuse growth factor. Table 6 shows that the reuse
growth factors for the selected applications range from 1.11 to 2.38. Only one project application has a reuse growth factor approaching 3.0; it is a recent, small application that took good advantage of existing reusable components.
App RGF
B 1 : 2.38 C 1 : 1.63 K 1 : 1.41 M 1 : 1.49 Q 1 : 1.11 R 1 : 1.39
How Much Code Is Reused From Lower Architectural Layers
Table 6. Reuse Growth Factors (RGF)
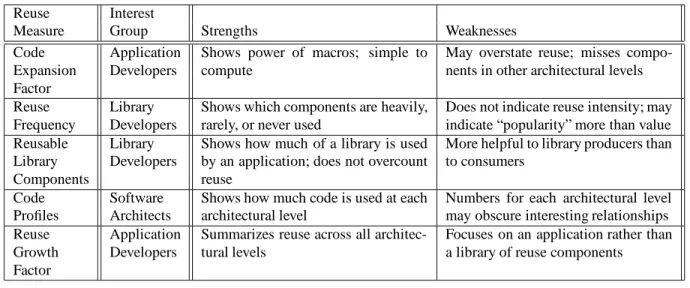
Reuse Interest
Measure Group Strengths Weaknesses
Code Expansion Factor
Application Developers
Shows power of macros; simple to compute
May overstate reuse; misses compo-nents in other architectural levels
Reuse Frequency
Library Developers
Shows which components are heavily, rarely, or never used
Does not indicate reuse intensity; may indicate “popularity” more than value Reusable
Library Components
Library Developers
Shows how much of a library is used by an application; does not overcount reuse
More helpful to library producers than to consumers
Code Profiles
Software Architects
Shows how much code is used at each architectural level
Numbers for each architectural level may obscure interesting relationships Reuse
Growth Factor
Application Developers
Summarizes reuse across all architec-tural levels
Focuses on an application rather than a library of reuse components
Table 7. Strengths and Weaknesses of Five Reuse Measures
Expan. Reuse Reuse Code Growth
App Factor Freq. Comp. Profle Factor Comment
B
+
+
Makes good use of Common Frame and Common CLibraries
C
+
{
{
{
+
Batch report writer; uses Application-Specific Libraryand Common Macros
K
+
+
{
{
Produces on-screen reports; uses no database updatecomponents
M
+
+
+
Newer large application with dynamic forms; usesover 40% of each common library
Q
+
+
+
{
{
Looks good except for code profile and growth factor;identifies opportunity for additional reuse
R
{
+
Batch report writer; uses a third of each commonli-brary
Table 8. Reuse Summary for the 6 Selected Applications
Discussion
In the previous section, the description of each reuse measure pointed out its particular perspective on software reuse. Table 7 highlights some of the pros and cons of each and indicates the software producer or consumer likely to be interested in the measure. Architects and managers support-ing both producers and consumers may find benefits from each.
For the six selected applications, Table 8 summarizes how they fared relative to each reuse measure. Note that no application was uniformly good (
+
for top quartile) or poor ({
for bottom quartile) across all reuse measures. This indicates that different applications, even those within one project, are able to take advantage of software reuse at var-ious architectural levels and to varying extents. We agreewith the literature that macro code expansion factors tend to overstate reuse (as the code generated by a macro is counted each time the macro is used); further, we have seen that macro code expansion factors can ignore reuse of compo-nents in reusable libraries. For these reasons, we favor treat-ing macros on the same foottreat-ing as function calls, which can be done in the framework of reusable library components.
theo-retical grounding on the consumer/producer model. Even though application developers on the project were quick to point out that reuse growth factors tend to be only about half that of code expansion factors, they accept the new metric since it encompasses code from all architec-tural levels. Code expansion factors and reuse frequencies are now regarded as comfort measures – nice to know, but not all that informative. Code profiles, on the other hand, can be much more revealing, even though they can pro-duce lots of tabular output; perhaps they are best viewed graphically. From the perspective of application developers as consumers of reusable library components, reuse growth factor distills a key essence of software reuse from the pro-file data.
In this report, we have related our experience with de-veloping and managing software reuse in a successful large industrial project. To summarize, the main ingredients in our software development framework are:
Layering software to reflect levels of programming, Developing reusable libraries for suitable layers, Actively managing feedback loops between consumers
and producers of reusable software, and
Using a variety of reuse measures to confirm that reuse
is being done effectively, elicit reuse opportunities, and stimulate development of new reuse components.
The management of the reuse feedback loop (Figure 4) is greatly helped with the use of objective reuse measures to both find out the extent of reuse and identify strengths and weaknesses. The use of object reuse measures in a consumer/producer model implicitly assumes that reusable components are used without modification. In our envi-ronment, a reusable repository is expected to continually evolve along with new requirements. However, component reuse can be treated as reuse at any given point in time, since only component producers update libraries and not component users. A recent study by Devanbu et al. [5] reported a limited experiment with seven student projects using three libraries: MotifApp, a GNU C
++
library, and a C++
database library. It was found that there was no unmodified software reuse. In each case, library code was copied and changed. Our experience suggests that either the students did not discover how the libraries were intended to be used or the libraries were not mature enough and could have benefited from further refinement based on a reuse feedback loop similar to the one in this project.Finally, though no single reuse measure can give a com-plete picture, the variety of measures presented and used in this study help form a more balanced and complete view of software reuse. In this project, the average code expan-sion factor for application frames is 3.5; average reuse of components in reusable libraries ranges up to 54%; reuse growth factors range from 1.5 to 3.0 for some of the newer
applications. Together these numbers imply that software reuse in the project may have reduced development effort by a factor of at least 2 and possibly 3 times. These es-timates are bolstered by the high reuse frequencies for the top 50 library component calls, which range from 100 to over 10,000. Project management confirms that, without software reuse, at least 2 or 3 times as much staff would have been required to develop and maintain the twenty ap-plications.
References
[1] W. Agresti and W. Evanco. Projecting software defects in analyzing Ada designs. IEEE Transactions on Software En-gineering, 18(11):988–997, 1992.
[2] B. H. Barnes and T. B. Bollinger. Making Reuse Cost-Effective. IEEE Software, 8(1):13–24, January 1991. [3] Y. F. Chen. Reverse Engineering. In B. Krishnamurthy,
edi-tor, Practical Reusable UNIX Software. John Wiley & Sons, 1995. Chapter 6.
[4] Y. F. Chen, B. Krishnamurthy, and K. P. Vo. An Objective Reuse Metric: Model and Methodology. In Fifth European Software Engineering Conference, September 1995. [5] P. Devanbu, S. Karstu, W. Melo, and W. Thomas. Analytical
and Empirical Evaluation of Software Reuse Metrics. In The 18th Internation Conference on Software Engineering, pages 189 – 199, 1996.
[6] G. S. Fowler, J. J. Snyder, and K. P. Vo. End User Systems, Reusability, and High Level Design. In USENIX Symposium on Very High Level Languages, pages 101–118. USENIX, October 26-28 1994.
[7] W. Frakes and C. Terry. Software Reuse: Metrics and Mod-els. ACM Computing Surveys, 28(2):415–435, 1996. [8] J. Gaffney and T. Durek. Software reuse – key to enhanced
productivity: Some quantitative models. Information and Software Technology, 31(5):258–267, 1989.
[9] B. Krishnamurthy, editor. Practical Reusable UNIX Soft-ware. John Wiley & Sons, 1995.
[10] W. Lim. Effects of Reuse on Quality, Productivity, and Eco-nomics. IEEE Software, 11(5):23–30, Sept. 1994.
[11] H. Mili, F. Mili, and A. Mili. Reusing Software: Issues and Research Directions. IEEE Transactions on Software Engineering, 21(6):528–562, June 1995.
[12] J. Poulin, J. Caruso, and D. Hancock. The Business Case for Software Reuse. IBM Systems Journal, 32(4):567–594, 1993.
[13] R. F. Rey, editor. Engineering and Operations in the Bell System. AT&T Bell Laboratories, 1983.
[14] J. J. Snyder and K. P. Vo. EASEL – An Application-Building Language. In B. Krishnamurthy, editor, Practical Reusable UNIX Software. John Wiley & Sons, 1995. Chapter 4.2. [15] K. P. Vo. IFS: A Tool to Build Application Systems. IEEE