Final Design Review
6/17/20CALIFORNIA SOLAR REGATTA
Team Members
Niko Banks [email protected] Nathan Carlson [email protected] Alex Larson [email protected] Eric Rinell [email protected]
Sponsor (Tournament Host)
Statement of Disclaimer
Since this project is a result of a class assignment, it has been graded and accepted as fulfillment of the course requirements. Acceptance does not imply technical accuracy or reliability. Any use of information in this report is done at the risk of the user. These risks may include catastrophic failure of the device or infringement of patent or copyright laws. California Polytechnic State University at San Luis Obispo and its staff cannot be held liable for any use or misuse of the project.
Due to the effects of COVID-19
Abstract
This Final Design Review report details the research, analysis, and design conducted by a Cal Poly Mechanical Engineering senior project team working on the propulsion system for a solar powered boat. Working in coordination with another senior project team responsible for making the hull, the two teams comprised the Cal Poly team who entered the Sacramento Municipal Utility District (SMUD) 2020 California Solar Regatta Competition. The SMUD Solar Regatta is an annual competition for high school and college students to design and build boats powered by solar power. The solar panels are provided by SMUD, and the battery storage is limited by competition regulations. The scope of this project was to design a propulsion system that would efficiently transfer energy, be easily integrated into the hull design and be competitive in the three races: endurance, slalom, and sprint. This document covers research conducted, objectives for the design, design concepts considered, the chosen final design, manufacturing and
Acknowledgements
First off, a huge thank you to our senior project advisor Dr. Brian Self for helping our team throughout the year, he was always a voice of reason and encouragement. Special thanks to Dr. Peter Schuster for being our senior project coordinator, and for working with Dr. Self to adeptly transition to a virtual workspace our last quarter. We could not have completed this project without the support and funding from Cal Poly and the Mechanical Engineering Department, we were very thankful for this opportunity. Thank you to SMUD for hosting this competition and for sponsoring our team, we were sad you had to cancel the 2020 competition, but Cal Poly is excited to participate again in 2021!
Table of Contents
Statement of Disclaimer ... ii
Abstract ... iii
Acknowledgements ... iv
Table of Contents ... v
List of Figures ... viii
List of Tables ... x
1. Introduction ... 1
2. Background ... 1
2.1. Previous Competitions ... 1
2.2. Similar Existing Products ... 2
2.3. Relevant Technical Aspects of Solar Panels ... 2
2.4. Electrical Components ... 4
2.5. Propulsion Systems ... 4
2.6. Propeller Design ... 5
2.6.1. Propeller Geometry ... 5
2.6.2. Propeller Performance ... 8
2.7. Water Channel Testing ... 11
3. Objectives ... 12
3.1. Quality Function Deployment ... 13
3.2. Needs and Wants ... 13
3.3. Technical Specifications ... 14
4. Concept Design ... 16
4.1. Ideation Process ... 16
4.2. Top Alternatives ... 16
4.3. Selection Process ... 18
4.4. Preliminary Alternative Concept Ideas ... 19
4.5. Preliminary Risk Analysis ... 21
4.6. Changes to Design Direction After Performance Analysis ... 22
5. Final Design ... 22
5.1. Comprehensive Final Design ... 22
5.3. Steering Mechanism ... 26
5.4. Material Choices ... 27
5.5. Propeller Design/Specification Descriptions ... 27
5.6. Electrical System ... 32
5.7. Safety, Maintenance, and Repair Considerations ... 32
5.7.1. Safety ... 32
5.7.2. Maintenance ... 33
5.7.3. Repair Considerations ... 33
5.8. Cost Analysis ... 33
6. Manufacturing Plan ... 34
6.1. Procuring Materials ... 34
6.2. Manufacturing and Assembly ... 34
6.2.1. Mechanical Drive Steps ... 34
6.2.2. Propeller Steps ... 35
6.2.3. Rudder/Water-foil Steps ... 35
6.2.4. Steering Steps ... 36
6.2.5. Motor Tilt Out of Water Steps ... 36
6.2.6. Motor to Hull Steps ... 37
6.2.7. Electrical System ... 37
6.2.8. Outsourced Parts ... 37
7. Design Verification Plan ... 38
8. Testing Plan ... 39
8.1. Component Tests ... 39
8.1.1. Motor Tests ... 39
8.1.2. Solar Panel Tests ... 42
8.1.3. Battery Life Tests ... 45
8.1.4. Propeller Efficiency Tests ... 45
8.1.5. Additional component Tests ... 45
8.2. Full Boat Tests ... 45
8.2.1. Speed and Acceleration Tests ... 45
8.2.2. Turning Radius Tests ... 46
9. Tasks Left for Next Year ... 47
9.1. Motor Testing ... 47
9.2. Manufacture and Assemble Full Propulsion Systems ... 47
9.3. Assemble Full Boat ... 47
9.4. Test Boat Performance ... 48
10. Project Management ... 48
10.1. Design Process ... 48
10.2. Special Techniques ... 48
List of Figures
Figure 2.1 Mirror reflection method for increasing irradiance on solar panels. ... 3
Figure 2.2 Motorboat Prop (a) and Water Jet (b) propulsion systems. ... 5
Figure 2.3 Motorboat powered by a hydrofoil system. ... 5
Figure 2.4. Airfoil shape of blade cross section.[21] ... 7
Figure 2.5. Definition of pitch: (a) helix definition on a cylinder of radius r and (b) development of helix on the cylinder.[21] ... 8
Figure 2.6. Propeller coordinate system.[21] ... 8
Figure 2.7. Visual representation of skew and rake.[22] ... 8
Figure 2.8. Traditional propeller performance chart with EAR = 0.300.[26] ... 10
Figure 2.9. Power-based propeller performance chart with EAR = 0.300.[23] ... 10
Figure 2.10. Velocity diagram for cavitation.[25] ... 11
Figure 2.11. Cavitation on propeller blades.[28] ... 11
Figure 2.12. Rolling Hills Research Corporation Model 0710 University Desktop Water Channel used for propeller design verification. ... 12
Figure 3.1 Boundary diagram used for problem definition. The dotted line represents the scope of the project for the propulsion team. ... 13
Figure 3.2. Slalom race diagram with dimensions added to figure as specified in the race packet.[18] ... 15
Figure 4.1. Rudder with attached single prop. ... 17
Figure 4.2. Dual thrust with adjustable solar panel position. ... 17
Figure 4.3. Prop inside hull pontoons. ... 17
Figure 4.4. Adjustable prop height through linkage system. ... 17
Figure 4.5. Mirror design for extra sunlight on solar panels. ... 18
Figure 4.6. Dual prop design with pontoons. ... 18
Figure 4.7 Weighted decision matrix of concepts generated in ideation process. ... 19
Figure 4.8 The second design integrates the motor and prop into the rudder. ... 20
Figure 4.9 The sixth design utilizes a ducted prop integrated into the hull. ... 21
Figure 5.1. Comprehensive CAD model of the final design. ... 23
Figure 5.2. Propulsion units attached to the back of the pontoons. ... 23
Figure 5.3. Overall components of a single propulsion unit. ... 24
Figure 5.4. Internal components of the transmission housing. ... 24
Figure 5.5. Propeller assembly diagram. ... 25
Figure 5.6. Demonstration of rudder assembly rotation for inspection and maintenance. ... 26
Figure 5.7. Steering diagram. ... 26
Figure 5.8. Parametric study varying efficiency and shaft speed for a specific EAR. ... 28
Figure 5.9. Hull drag coefficient analysis for propeller design. ... 29
Figure 5.10. Traditional performance chart for our propeller design created by OpenProp. ... 29
Figure 5.11. Performance chart with dimensioned variables. ... 30
Figure 5.12. Blade cavitation diagrams from OpenProp. ... 31
Figure 5.13. Blade stress analysis using OpenProp. ... 32
Figure 8.1. Motor test jig for dynamometer test. ... 40
Figure 8.2. Motor test jig setup with dynamometer. ... 40
Figure 8.3. Torque-speed curve for T-motor U8II-KV85 motor. ... 41
Figure 8.5. Shading (≈9 in2) used in test 2 (Panel normal to the sun). ... 43
Figure 8.6. Shading from test 5 (Panels flat on ground) ... 43 Figure 8.7. Power-current plots for each of the 5 tests conducted on the JKM235P-60 Solar module. ... 44
List of Tables
Table 2.1. Common geometric dimensions of propellers. ... 6
Table 2.2. Common performance parameters used in propeller design. ... 9
Table 3.1 Design Needs and Wants. ... 14
Table 3.2. Technical specifications for Solar Regatta propulsion system. ... 14
Table 5.1. Propeller design characteristics. ... 30
Table 8.1. Raw data taken from dynamometer test of T-motor U8II-KV150. ... 41
Table 8.2. Solar Panel Test Results. ... 43
1.
Introduction
For the past eight years the Sacramento Municipal Utility District (SMUD) has hosted an annual competition called the SMUD California Solar Regatta for both high schools and colleges to enter. The program was established to promote renewable energy through solar technology and innovation. The competition consists of three races: the sprint race, slalom race, and endurance race. Additional points are awarded for a presentation of the design, along with bonus points for innovative design, sustainability, and artistry. The slalom race focuses on maneuverability, the sprint race prioritizes speed, and the endurance race emphasizes efficiency. The races make up half of the total score, while the oral presentation and bonus awards make up the other half.[18]
For the first time ever, the Cal Poly Mechanical Engineering Department entered this
competition with a team of students using it as their Senior Project. The team, advised by Dr. Brian Self, was comprised of eight Mechanical Engineering students split into two sub-teams consisting of four students each. One group designed and built the hull while the other designed and implemented the propulsion system. This final design review report is for the Propulsion Team and will outline how the propulsion system for the solar powered boat was designed, built, and tested.
2.
Background
To prepare for designing a propulsion system for a Solar Regatta, we first conducted research to become more informed about the competition and the technology involved. In our research, we found information about previous competitors, other solar powered boats, solar panels, and water propulsion systems. Our findings are detailed in the following sections. As a tournament project, our team and the other senior project team are the main customers.
2.1. Previous Competitions
Boat designs and their results from previous competitions were examined and will be used as benchmarks during the design process. While some benchmarked metrics can be found in Appendix A in the Quality Function Deployment (QFD), many of the specific performance characteristics of competitors’ boats were unknown or hard to measure.
In 2018, the City College of San Francisco won the Solar Regatta by taking 1st place in the
Slalom race, 1st place in the Sprint race, 5th place in the Endurance race, and winning some of the
bonus prizes. These scores totaled to a winning score of 70. Their winning design was a low-profile twin hulled boat powered by a single propeller positioned on the centerline of the boat. During the same year the UC Davis team finished second place overall with 50 points using a single-motor monohulled design, despite placing 6th in Slalom, 6th in Sprint, and 13th in
Endurance [7,15]. This demonstrates that while a high performing boat is important to the overall
A Solar Regatta design created by high school students in Laguna Creek in 2012 was also used as a benchmark for our design. However, some aspects of the competition have changed since they competed, so not all statistics are comparable to this year’s competition [14]. See Appendix B
for pictures of boats from previous years.
2.2. Similar Existing Products
The first boat to drive under solar power appeared in 1985, with the first commercial marine solar vehicle to follow in 1995 [19]. Since then, global attention on climate and pollution has
prompted groups interested in advancing solar vehicle technology to create competitions that involve teams across the globe. A report from the Istanbul Technical University Solar/Electric Boat Team details their experiences in 2007 and 2008 at the Solar Splash Event - Intercollegiate World Championship of Solar/Electric Boating [6]. At the time of Istanbul’s publication, the
event was on its 15th year. While the long-running competition has higher limits on battery size,
many factors are similar. These include a length, width, and freeboard limit of 6m, 2.4m, and 1.5m respectively, 480W solar input, and 1kW•hr endurance battery. The only major difference is that the CA Solar Regatta limits the battery to 180 W•hr (18% of the Solar Splash limit). Even the trio of races are of same name and similar structure.
By studying the history of the vehicles used in these competitions and learning from the design progressions and failures they detail, our team will be competitive with the most experienced teams, bridging a gap of knowledge and experience.
2.3. Relevant Technical Aspects of Solar Panels
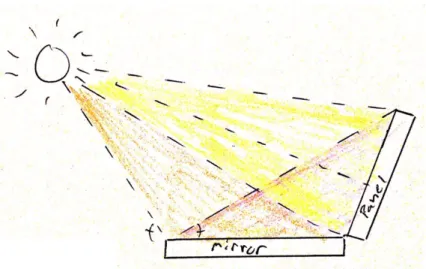
A large design consideration for maximizing the power transfer from the solar cell to the drivetrain is done by reducing losses [2,3]. Another way to increase the efficiency of solar panels
is to increase the amount of light that hits the panel. This increases the irradiance (Ir, W/m2) on
Figure 2.1 Mirror reflection method for increasing irradiance on solar panels.
However, there are issues with increasing the irradiance on the surface of the panels. The main problem is the increased temperature of the panel surface. Solar panels are rated for certain ranges of operable temperatures, and heating past their limits will both hurt efficiency of the panels and possibly damage components.
Another way to increase the power output of Photovoltaic (PV) solar panels is to cool them down. Solar panel efficiency increases with decreasing temperature, at a rate of roughly 0.45%/°C for crystalline Silicon modules, like the ones we will be using. Cooling can be achieved by a variety of methods, such as water cooling, conduction, or convective air cooling. In a study of water cooling by the Raisoni College of Engineering in Nagpur, India, it was discovered that cooling the top surface of the panels was the most effective way to decrease temperature and increase efficiency [5]. However, if an active cooling system is implemented, it
must be ensured that the amount of energy being used to cool the panels is not greater than the additional energy that is provided by the cooler panels. A passive method may be more
beneficial, such as connecting the panels to the lake with thermally conductive material. An even simpler alternative would be to spray the panels with water directly before the races.
According to the data sheets for the solar panels provided by SMUD, the panels to be used will increase power output by 0.45% for every °C decrease, with T = 25°C considered the 100% efficient temperature (where the power output is 235 W). Decreasing the temperature of the cells will allow us to get higher than 100% efficiency. These solar panels have operating temperatures between -40 and 85°C- this means that the power output can range from 300W to 170W, a swing of 56% [18]. However, the specifications were measured at Ir = 1000 W/m2, T = 25°C, and AM =
1.5, not the conditions we expect for the day of the race [16]. AM stands for Air Mass, which is a
unitless ratio of the distance sunlight will travel through the atmosphere compared to the minimum possible distance it must travel to reach sea level. Based on this, it is safe to assume that the standard output of the solar panels as delivered will be less than 235 W.
2.4. Electrical Components
Running solar cells without a battery is not common practice but is required for the sprint and slalom races. Since the power coming from the cell is not constant and changes throughout the course of a day, PV modules can only be used as a direct power source if they are being used on a motor that can handle variable input. We plan to use motors that have this capability.
Solar cell outputs do not only vary at different times of day; there is also considerable signal fluctuation every second. This variation in known as solar noise and is caused by the fluctuation in the radiation the sun gives off. In order to account for this solar noise, the use of a solar regulator is required. A solar regulator is a series of capacitors and inductors that smooths the electrical signal that runs through them, eliminating the solar noise. Multiple units can be used to reduce the noise even further. These solar regulators are designed to eliminate nearly all the solar noise for an average day and can be programmed for your location and time of year to
adequately utilize this process. These devices are allowed to be used in the competition, as the capacitors inside are not designed to store energy.
The use of an electric controller to ensure that the same amount of power is being delivered to each one of the motors is also essential to ensure our models match reality. These controllers have an input and two outputs with a simple interface that allows the user to determine the amount of power going to each of the output terminals. The controller will need to be slightly oversized since it will be essential in the final circuit for the boat to run at its highest efficiency. 2.5. Propulsion Systems
The most commonly used water propulsion system is a propeller and drivetrain. Originally called water screws, propellers were used for water transportation for years before they were used in aviation [20] and can been seen in Figure 2.2a. After their incorporation into avionics, the research
into propeller design took off. Since information gathered on propeller designs through air can be translated into usage in water with given fluid properties, research has been conducted by other engineers and scientists on both air and water-based propellers. Important variables that go into the design of propellers include length to width ratios, pitch, curvature, drag coefficients, and number of blades. Each one of these variables can be varied to achieve maximum efficiency of power transfer [1].
Another type of propulsion that arose from research is waterjet propulsion by use of pumps. This is an interesting idea that was created out of the desire for higher energy transfer efficiencies by the driving mechanical system, a full system is shown in Figure 2.2b. The mechanical energy transfer efficiency needs to be maximized for all types of propulsion.[4] This
https://www.boatus.com/magazine/archives/reasons-to-change-your-prop.asp http://www.marinedieseleurope.com/blog/2015/02/25/water-jet-propulsion-packages/
(a) (b)
Figure 2.2 Motorboat Prop (a) and Water Jet (b) propulsion systems.
An out-of-the-box propulsion concept discovered through research was a hydrofoil. This type of propulsion system would have to be agreed upon by the propulsion and hull team, since it would heavily affect both designs. The main concept that makes this enticing is the drastic decrease in drag force on the boat that this system allows. The hydrofoil acts as a “wing” underwater, generating lift as the velocity of the boat increases [9]. This causes the main hull to come above
the water level while the propulsion system remains submerged as shown in Figure 2.3. Raising it above the water reduces the amount of surface area that is in contact with the water, and therefore reduces drag from the water. Since the drag coefficients of water are significantly higher than air, the total amount of force opposing the motion of the boat drops dramatically
[13,17]. Things to consider when reviewing this idea include initial required thrust for liftoff, speed
requirements for efficient ascension/descension, complexity of the design, competition limitation and rules, storage and stability.
https://wordlesstech.com/hydros-retractable-hydrofoil-boat/
Figure 2.3 Motorboat powered by a hydrofoil system.
After deliberating on each of these design ideas, propellers were chosen for the final boat design over hydrofoils or a waterjet system. More information about our decision-making process can be found in Section 4.3. Research on propeller design is shown in the following section.
2.6. Propeller Design 2.6.1.Propeller Geometry
Table 2.1. Common geometric dimensions of propellers.
Dimension Symbol Figure(s) Shown
Diameter " 2.5
Radius # 2.5
Hub Diameter "$ -
Hub Radius #$ -
Number of Blades % -
Pitch & 2.5, 2.7
Pitch Angle ' 2.4, 2.5, 2.7
Pitch Ratio &/" -
Max Section Thickness ) 2.4
Blade Thickness Ratio )/" -
Chord Length * 2.4
Radial Blade Coordinate + 2.5, 2.6
Disk Area ,- -
Expanded Area ,. -
Expanded Area Ratio /,# -
Skew 01 2.7
Rake 23 2.7
Rake Angle 043 -
Figure 2.4. Airfoil shape of blade cross section.[21]
Pitch and pitch angle are critical to determining a propeller’s performance. Pitch is defined as the total axial (x) distance that a blade would travel with no slip and can be determined from the pitch angle ', as shown in Figure 2.5. Figure 2.6 shows the coordinate system that is typically used with propellers. This system will be used throughout our analysis of propellers as well. Two other important characteristics of blade geometry are rake 23 (or rake angle 043) and skew 01 of a blade. Rake angle is the angle at which the blades are bent forward axially, as shown in Figure 2.7. A rake angle is commonly used for propellers that sit partially out of the water and run at high RPMs, to force water to “stick” better to the blades and produce higher thrust. Skew is implemented to help with cavitation issues along the leading edge, as described in section 2.5.2. Skew is also shown in Figure 2.7.
The disk area ,- of the propeller is defined as the total area that the blades sweep through, while the expanded area ,. is the rough estimate of total blade surface area as seen from the front (pressure side) of the propeller. These can be calculated using the equations below:
,- = 6"7/4 ,. = % 9 *:+ ; ;<
where c is the chord length of each radial cross section of the propeller at radius r. Propellers are commonly characterized by the expanded area ratio /,#, where /,# = ,./,-. /,# affects thrust produced and efficiency of the propeller, with higher /,# values producing more thrust at lower RPMs, but also causing a lower efficiency due to more drag on the blades. Typical
Figure 2.5. Definition of pitch: (a) helix definition on a cylinder of radius r and (b) development of helix on the cylinder.[21]
Figure 2.6. Propeller coordinate system.[21]
Figure 2.7. Visual representation of skew and rake.[22]
2.6.2.Propeller Performance
Propeller performance generally relies on five variables: Thrust (>), inflow speed (?@), rotational speed (A), torque (B), and efficiency (C). All of these variables are interrelated to each other in complex ways and can change depending on the operating conditions and the blade geometry. To design a propeller for a certain operating condition, it is common to use non-dimensional
versions of each parameter. Dimensioned quantities associated with propeller design are shown in Table 2.2 along with their non-dimensional counterparts.
performance chart shows curves for C, DE, and DF as functions of G. Each chart holds multiple curves for different &/", and each chart represents a single value of /,#. This plot is useful for determining propeller characteristics when G can be calculated directly. An example of this type of chart is shown in Figure 2.8.
A different type of performance plot can be used when information about input power is known or desired. The power-based performance chart shows curves for C and H as functions of &/" and IJ. Like traditional propeller performance charts, these charts are for a single value of /,#. An example of this type of chart can be found in Figure 2.9.
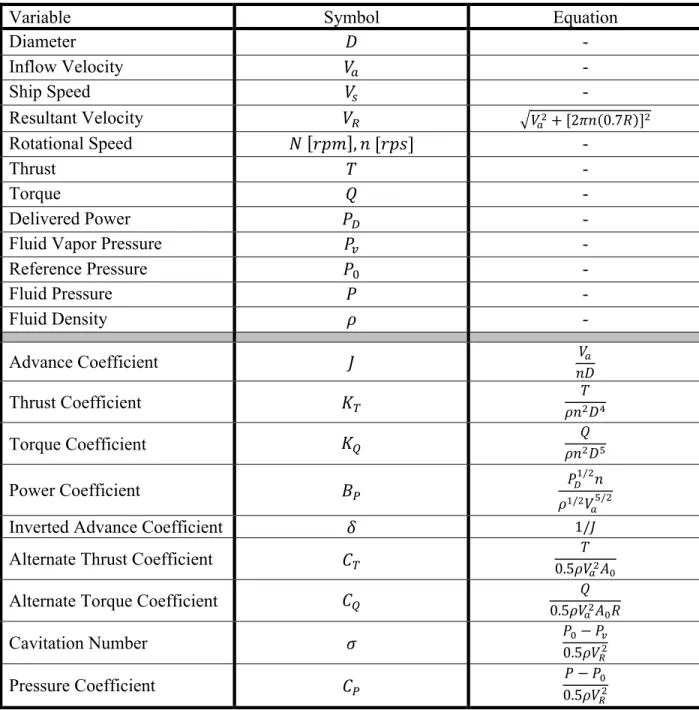
Table 2.2. Common performance parameters used in propeller design.
Variable Symbol Equation
Diameter " -
Inflow Velocity ?@ -
Ship Speed ?1 -
Resultant Velocity ?; K?@7+ [26O(0.7#)]7
Rotational Speed A [+VW], O [+VY] -
Thrust > -
Torque B -
Delivered Power &Z -
Fluid Vapor Pressure &[ -
Reference Pressure &- -
Fluid Pressure & -
Fluid Density \ -
Advance Coefficient G ?@
O"
Thrust Coefficient DE
> \O7"]
Torque Coefficient DF \OB7"^
Power Coefficient IJ &Z_/7O
\_/7? @^/7
Inverted Advance Coefficient H 1/G
Alternate Thrust Coefficient aE
> 0.5\?@7,
-Alternate Torque Coefficient aF 0.5\?B
@7,-#
Cavitation Number c &0.5\?-− &[
;7
Pressure Coefficient aJ
Figure 2.8. Traditional propeller performance chart with EAR = 0.300.[26]
The alternate thrust and torque coefficients aE and aF are also occasionally used for design, though they do not show up in traditional performance charts.
Cavitation in propellers occurs when the pressure at the blade surface (&) drops below the vapor pressure of the fluid, causing the fluid to vaporize. This leads to a lower efficiency of the
propeller and over time can damage the blades. To define when cavitation occurs, the cavitation number c is used in conjunction with the pressure coefficient aJ. With some algebra, it can be shown that cavitation will occur when − aJ⁄ ≥ 1.c [25]
c is calculated using the relative velocity ?;, which is calculated at + = 0.7# where cavitation is typically highest. Figure 2.10 shows the velocity diagram for inflow on a propeller.
Figure 2.10. Velocity diagram for cavitation.[25]
Cavitation occurs first on the leading edge of the propeller blades, and can be reduced by adding skew to the blades. The skew removes the part of the blade where cavitation occurs, effectively removing cavitation altogether. Cavitation can occur again at too high skew angles; there is an optimal skew angle for each design condition where no cavitation occurs. This can be seen in Figure 2.11.
Figure 2.11. Cavitation on propeller blades.[28]
All of this information was used in our propeller design to design a propeller to have a maximum efficiency for our given operating conditions. The final propeller design is covered in more detail in section 5.5.
2.7. Water Channel Testing
propellers. A water channel has a straight test section where uniform flow is reached and is similar to a wind tunnel.
The Cal Poly Aerospace Department had a decommissioned water channel that we planned to use for our testing of the propellers. However, it hadn’t been operational for over two years and required the Variable Frequency Drive (VFD) to be replaced. Electric Motor Wholesaler was gracious enough to support this project and sent us a replacement VFD at no cost. The Water Channel is the Rolling Hills Research Corporation Model 0710 University Desktop Water Tunnel, shown in Figure 2.12.
Figure 2.12. Rolling Hills Research Corporation Model 0710 University Desktop Water Channel used for propeller design verification.
Once the water channel has been restored, it can be used for future tests. See section 8.1.4 for more details about proposed testing with the water channel. Due to Covid-19 our team was never able to conduct testing with the water channel, but hope next year’s team will be able to do so.
3.
Objectives
Figure 3.1 shows our boundary diagram for this project. As the propulsion group, we are responsible for the propulsion system and all components that connect it to the solar panels and battery. The purple dotted line shows our scope for this project. The solar panels must be removable for the endurance race, during which the boat will run completely on battery power.
Figure 3.1 Boundary diagram used for problem definition. The dotted line represents the scope of the project for the propulsion team.
3.1. Quality Function Deployment
To make sure that our project was planned and executed as efficiently as possible, we performed a Quality Function Deployment (QFD) process. This allows us to organize the wants and needs for the design based on the tournament specifications, as well as determine our own
specifications that will ensure that we meet those needs. As a tournament project, the needs and wants are well defined and documented in the competition packet. In this process, our design was benchmarked against teams that competed previously in the competition in 2018 and one that competed in 2012. Initial goals for each specification were set, though they may be changed over time as more research is done regarding each specification. The specifications are outlined in more detail in the next section. For the full QFD analysis performed, see Appendix A.
3.2. Needs and Wants
Table 3.1 Design Needs and Wants.
Needs Wants
High top speed Fun to pilot
Maneuverability Easy to operate
High endurance Reliable
Easily integrated with hull Light weight
Safety Aesthetic design
Solar powered Original design
Battery powered Custom drivetrain
Sustainable design
Needs were defined as items that were determined to be critical for the competition, including characteristics that are awarded points by the judges along with race performance. For the Solar Regatta to perform well in competition, it must have a high top speed, good maneuverability, and high endurance. The competition requires the design to be safe and for the propulsion system to be able to run on solar or battery power. In order to be useful and viable, our design must be able to be incorporated with the hull that the boat team designs.
Wants were defined as anything additional that provide extra non-race points, properties that will help achieve needs, or items that will make the design more enjoyable to operate and build. 3.3. Technical Specifications
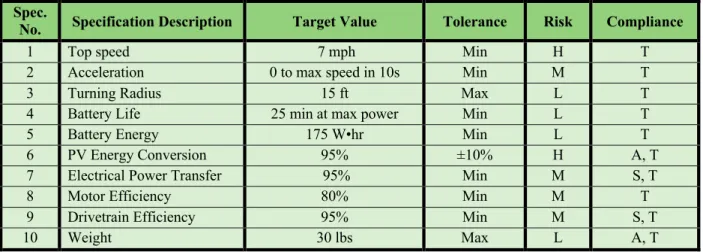
Table 3.2 shows the technical specifications that were determined for the propulsion system for the Solar Regatta. Each specification was determined based off of performance and
characteristics of past race competitors, competition rules, and background research. In the Risk column, H, M and L stand for high, medium, and low, respectively and refer to the risk level of not achieving that objective. In the Compliance column, A, S, and T stand for Analysis,
Similarity, and Test, respectively.
Table 3.2. Technical specifications for Solar Regatta propulsion system.
Spec.
No. Specification Description Target Value Tolerance Risk Compliance
1 Top speed 7 mph Min H T
2 Acceleration 0 to max speed in 10s Min M T
3 Turning Radius 15 ft Max L T
4 Battery Life 25 min at max power Min L T
5 Battery Energy 175 W•hr Min L T
6 PV Energy Conversion 95% ±10% H A, T
7 Electrical Power Transfer 95% Min M S, T
8 Motor Efficiency 80% Min M T
9 Drivetrain Efficiency 95% Min M S, T
10 Weight 30 lbs Max L A, T
to ensure a faster speed than the best competitor. If the boat is to perform well in the sprint race, it must also accelerate quickly enough to get to top speed. A target time to top speed of 10s was estimated based on the time for the entire sprint race.
Turning Radius estimates were determined from the specifications of the slalom race. There are five buoys placed over a 150 yard (450ft) distance, as shown in Figure 3.2. From this, the buoys were estimated to sit about 70 ft apart. From this, a 15 ft turning radius was set as the target.
Figure 3.2. Slalom race diagram with dimensions added to figure as specified in the race packet.[18]
Target battery life was set solely based on the specifications of the endurance race. The race lasts 25 minutes or until the battery runs out, and the goal is to have battery power at max power output for the entire race.
Each of the efficiency targets were based off background research into typical efficiencies of each system. More information about the solar panel efficiency is located in Section 2.3. The total weight of the solar panels alone is 84 lbs (42 lbs each). An estimate for the remaining total weight was made based weight estimates of mounting components, motors, and the battery. Plans to test each of these specifications can be found in Section 7, Design Verification Plan. The hardest specifications to meet (highest risk) will likely be top speed and PV energy conversion. Top speed depends on factors outside of the scope of the propulsion team, such as drag on the hull. The goal is to be the fastest of any team that competes, which could prove to be difficult to achieve. However, we believe it to be beneficial to aim for the best performance, even if we are unable to achieve it in the end. Additionally, the PV energy conversion goal forces us to consider ways to cool the solar panels to increase their relative efficiency. Due to the age and condition of the cells we receive from SMUD, this could also be difficult to accomplish.
150 yds (450 ft)
4.
Concept Design
4.1. Ideation Process
The team determined three main functions that would be essential for the development of a final product: integration with the hull, steering, and power transfer. Each of these will be critical in determining the concept designs that will be integrated into the final design. Different ideation processes were used for determining a large list of ideas under each function, which were later reduced to include only the more realistic options. Some initial ideas had been thought of in previous meetings and meetings after our ideation day, but the bulk of the ideas came from the three processes we used in class.
The first process we used was brainstorming, where we thought of as many ideas we could and said them out loud as we wrote them on the board. A time limit of 15 minutes was given for the process and one team member acted as a moderator to keep the team on track. We used this method to get ideas for the integration with the hull. We came up with a list of 43 ideas that are listed in Table D.1 that range from basic fasteners to complex integration techniques. To facilitate creative ideas and out of the box solutions we encouraged wild, unrealistic, and humorous suggestions throughout the brainstorming process.
The second process the team used is the SCAMPER method (Substitute, Combine, Adapt, Modify, Put to other use, Eliminate, and Reverse) to evaluate three types of steering methods. The steering methods we looked at were the use of a rudder, differential thrust, and a thrust vector. The scamper method allowed us to broaden the view of each one of the processes and find overlap between the three design ideas. The results of the SCAMPER process are presented in Table D.2. These ideas were later turned into design concepts for testing and selection. The third and final process used was brainwriting, a method that promotes individual creation and ideation. The method has everyone write down ideas on a sheet of paper without saying anything to the others before passing on their sheet for other team members to add their ideas. This process was used to come up with power transfer methods for electrical-to-mechanical and mechanical-to-thrust power. All ideas that each team member came up with can also be found in Appendix D. Each one of the expanded-upon concepts was discussed in the concept prototype and selection stages.
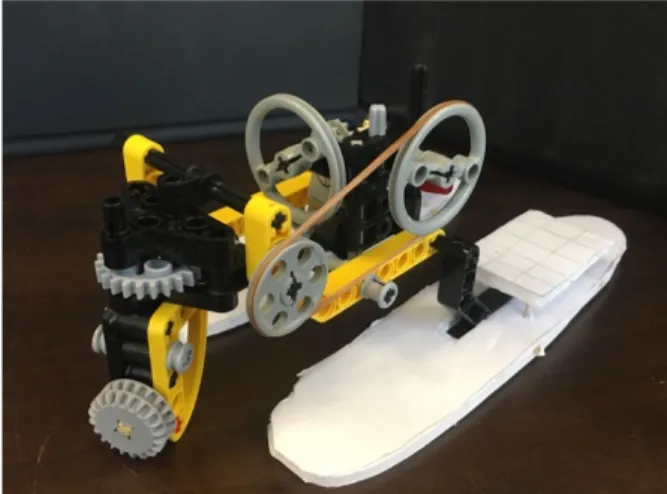
4.2. Top Alternatives
During the ideation process, we came up with multiple design concepts. In one of our class periods, we used a combination of Legos, popsicle sticks, foamboard, and other crafting
materials to create simple concept models of some of the ideas that we came up with. Photos of our top 6 concept models can be found in Figures 4.1-4.6.
Figure 4.2 shows a dual thrust concept with solar panels mounted to a shaft in the center of the boat. The solar panels can rotate side to side to maximize the solar irradiance that hits the panels, increasing their power output.
Figure 4.1. Rudder with attached single prop. Figure 4.2. Dual thrust with adjustable solar panel position.
Figure 4.3 shows a model of a prop inside of a pontoon. There would be no additional drag force acting on the motor and rudder because they do not exist outside of the pontoons. Figure 4.4 shows a model with a height-adjustable prop. The prop is connected to a linkage system that can raise or lower the prop height in the water to the optimal position.
Figure 4.5 shows a solar panel with reflective material around the outside at an angle. This would reflect more sunlight onto the panels and increase power output. Figure 4.6 shows a model with two pontoons with one prop attached to each. Steering would be achieved by adjusting the power to each prop to make one faster than the other.
Figure 4.5. Mirror design for extra sunlight
on solar panels. Figure 4.6. Dual prop design with pontoons.
4.3. Selection Process
To decide which design to use for this project, we used a series of different selection processes. First, Pugh Matrices were created for our four main functions: steering, integration with the hull, and mechanical and electrical power transfer. Each Pugh Matrix evaluated 4-6 different concepts that we had come up with and scored them off of a baseline design, the first design in the matrix. Each Pugh Matrix can be found in Appendix E.
Next, the results from each Pugh Matrix were consolidated into a morphological matrix. The designs were arranged and ranked as they were scored from the Pugh Matrices to see which design concepts would perform well in combination. From this, seven full design concepts were created and compared against each other in a weighted decision matrix. This decision matrix and each design chosen are shown in Figure 4.7.
Figure 4.7 Weighted decision matrix of concepts generated in ideation process.
After more analysis was conducted, many of these ratings did not match up to what we discovered. Our final option ended up being a combination of a couple of these ideas, and is described in more detail in section 4.6, and in section 5 on Final Design.
4.4. Preliminary Alternative Concept Ideas
At the time of the PDR, we decided to research further the second design (single prop attached to rudder with a direct drive), and the sixth design (dual thrust inside pontoons with props with a normal rudder), both seen in decision matrix in Figure 4.7. The sixth design was rated lower than the second design, but until we conducted more research into the true characteristics of each model, we did not want to settle on one solution. These two remaining concepts were researched and tested more thoroughly before the final decision was made.
The second design combines the steering of a rudder and the propulsion of a prop into one design. The entire system would be a ridged body attached to the center platform of the boat. The system would be able to rotate around the vertical axis and move the direction of the driving and opposing forces in the water. This change of force direction would be how the steering was accomplished. A basic computer aided design (CAD) drawing of the system is shown in Figure 4.8a and a functional concept prototype is shown in Figure 4.8b. With the single motor and direct drive, electrical and mechanical losses would be reduced as opposed to a model with a longer drive train. The rudder and prop dimensions were dependent on the dimensions of the boat, and were finalized after the hull was designed. This design would likely require a larger prop
compared to a model with dual props. The rudder would be made from carbon fiber or fiberglass to reduce the weight and the stresses on the mounting system. The system would also have an adjustable lowering mechanism to position it in optimal depth in the water to produce the necessary thrust. The prop would be made from either carbon fiber, CNC milled aluminum, or
California Solar Regatta Propulsion
Score Total Score Total Score Total Score Total Score Total Score Total Score Total
Cost 2 5 10 6 12 2 4 6 12 2 4 4 8 5 10
Maneuverability 5 7 35 7 35 4 20 4 20 4 20 5 25 5 25 Ease of Manufacturing 4 5 20 5 20 4 16 6 24 2 8 4 16 5 20
Top Speed 5 5 25 5 25 5 25 5 25 5 25 5 25 5 25
Low Drag 4 4 16 4 16 6 24 5 20 6 24 5 20 4 16
Aesthetic Design 3 5 15 5 15 8 24 3 9 8 24 7 21 3 9 Lightweight 3 5 15 5 15 6 18 6 18 4 12 6 18 5 15
Reliable 3 4 12 5 15 5 15 3 9 2 6 5 15 4 12
Ease of Integration with Hull 4 6 24 6 24 5 20 7 28 2 8 5 20 7 28
Total: -Designs 1 2 3 4 5 6
7Normal rudder, dual thrust inside pontoons with propsNormal rudder, dual thrust on sides of pontoons with props
160
172 177 166 165 131 168
Single prop attached to rudder, outboarded Single prop attached to rudder, direct drive Dual thrust inside pontoons with props, direct drive Dual thrust outside pontoons with props, strapped Dual thrust inside pontoons with props, internal driveshafts
3D printed material, all of which would be polished to reduce the drag on the blades. After testing the prototypes, we planned to manufacture a modified design for competition that was optimized for our specific performance. Different prop designs may be used for different races depending on the efficiencies and drag created at the different speeds. Testing would be done to determine if this is necessary.
(a) (b)
Figure 4.8 The second design integrates the motor and prop into the rudder. Shown above are (a) the CAD model and (b) the concept prototype.
(a) (b) Figure 4.9 The sixth design utilizes a ducted prop integrated into the hull.
4.5. Preliminary Risk Analysis
Risk increases significantly with designs that involve advanced analysis and unproven
technologies. To determine the risk introduced by each component of the propulsion system, we considered the impact and likelihood of component failure. First, we considered the components that will be included regardless of which design choices we made from this point forward. A major concern in any watercraft drivetrain is water ingress through the shaft bearing where the boundary exists between the lake-water and motor housing. Many boats use sealing systems based around stern tubes. These long bushing surfaces employ water pressure fed from a tank in the boat placed above the surface of the water. The positive differential from inside to outside prevents ingress of seawater. This system necessitates another seal between the stern tube and motor itself. Additionally, commercially available shaft sealing systems - even the smallest - are built for relatively large shafts that transmit hundreds of pounds of thrust. Therefore, we will attempt to use a triple sealed bearing to seal our motor components from the propeller. In risk reduction testing, we will expose the bearing to a depth of water equal to the depth and loads present at operation in the competition.
The risks in the electrical system are significant as well. Since we are not allowed to use capacitors for power storage, the power from the solar panels will travel directly to the motor controller. To remove issues with solar noise, we will have to obtain a solar converter that maintains as constant of an output as possible. Maintaining a constant voltage output from solar panels without the use of capacitors would require changing the current draw rapidly to keep the panels at their optimal peak power voltage. In tests, we worked with other Cal Poly students and professors researching solar panels (Professor Davol, Cal Poly Microgrid PV Array Senior Project, Dr. Dolan, Cal Poly Electrical Engineering professor and Professor Banadaki, Cal Poly
We must also consider personal safety hazards and risks. One of these is the risk of a fast-spinning propeller with sharp blades. During each race, the team members wade through the water to first put boat in the water and then push it out from shore. Mounting the propeller externally would require the kill switch to be activated during the pushout. However, using a waterjet would contain the propeller inside of a fairing completely, removing the risk of a loose propeller becoming a projectile and hitting someone. This would increase safety when deploying the boat in the water.
Exposure to electricity is the final personal risk to discuss. Wet objects normally have a higher conductivity, meaning that the threshold for injury from voltage exposure could be lower. However, the lake water we will be competing in does not have a significant salt content that would require us to lower the threshold of the voltage at the operation point. At most, our system will run at 40V DC, and will only be repaired or altered when fully dried to minimize risk. Further evaluation of risks and safety hazards can be found in Appendix F.
4.6. Changes to Design Direction After Performance Analysis
Since the PDR, we have made slight modifications to our design based off of advice from various professors and our own performance analysis. We decided to incorporate the best elements of the two designs discussed above into our final design. The concept of our final design is to have two propulsion subsystems, one mounted to each pontoon. The motor will be mounted at the top of the rudder and power is directed to the prop through a reduction
transmission at the bottom of the rudder. The rudder will be attached to a steering wheel via cables, which are connected to a steering column in the center of the boat. The rudders will be linked with a rigid bar to keep their turning angles equal, and the motors will be controlled by one throttle to keep the props at equal speeds.
These changes were implemented due to two key findings in our analysis; it was discovered that two smaller propellers would be more efficient than one single propeller, and each propeller has one speed at which it reaches maximum efficiency. Because of this, two propellers were chosen for the design, and each had to be kept at a constant speed. To achieve this and allow for the boat to turn, each propeller was made to rotate with a rudder on the end of each pontoon. The final design is described in more detail in the next section.
5.
Final Design
This section includes a description of the final design, an explanation of its functionality, design justification, material choices, safety considerations, and cost analysis.
5.1. Comprehensive Final Design
Out final design is shown in Figure 5.1 with the full boat assembly created by the hull team. The model incorporates all of the ideas that were envisioned in the preliminary analysis and concept design and has a simple integration with the hull. The entire boat is designed to be modular, and each pontoon can be separated from the overall assembly by removing a few bolts. Each
bridge assembly can easily be shifted up or down the length of the pontoons to optimize a center of mass, and the distance between the pontoons can be adjusted to optimize steering capabilities.
Figure 5.1. Comprehensive CAD model of the final design.
5.2. Propulsion Subsystems
The boat will utilize two propulsion subsystems, one on the back of each pontoon and linked together with a rod to keep them at the same turning angle. A close-up view of the two
propulsion systems is shown in Figure 5.2. Additionally, Figure 5.3 and Figure 5.4 show more detailed views of the propulsion system with components labeled.
Figure 5.3. Overall components of a single propulsion unit.
Each Gearbox Housing is to be manufactured from aluminum using a 5-axis CNC mill, and the Motor Mounts will be 3D printed. These two components will interface directly with the Rudder Downtube. The Rudder is made up of stacked wood panels shaped like airfoils that will be wrapped in carbon fiber. The Rudder Downtube is also made of carbon fiber and will go through a hole in each wood airfoil in the core. This will provide space to run the Motor Driveshaft from the Electric Motor to the Transmission Housing.
The Gearbox Housing can be seen in Figure 5.4 and contains a set of bearings and bevel gears. The gears provide a 2:1 speed reduction and are secured by the press fit bearings and the
Propeller Driveshaft and Motor Driveshaft. The Tail Cone is designed to be 3D printed and will insert into the end of the Gearbox Housing to complete the revolved airfoil profile of the gearbox up until the base of the propeller. A set screw is threaded through the propeller driveshaft to connect it to the propeller. This can be seen more clearly in Figure 5.5. A secondary bearing is also located at the end of the tail cone for support for the propeller driveshaft.
Figure 5.5. Propeller assembly diagram.
Figure 5.6. Demonstration of rudder assembly rotation for inspection and maintenance.
Unfortunately, because of complications with COVID-19 many of these components were unable to be manufactured or assembled into a full propulsion system. Finishing manufacture and assembly of the propulsion system and full boat will be passed on to next year’s team. 5.3. Steering Mechanism
After deciding to use two, rotating propulsion units, the simplest steering method seemed to be via a cabling system. The propulsion units on the back of each pontoon are linked together to keep them at the same turning angle. A cable will be run along the length of the pontoon from each motor mount and wrapped around a steering column to allow the driver to steer. A diagram of the steering system is shown in Figure 5.7.
The cables will be tied with extra length at the ends, allowing for the steering system to be adjusted for any potential position of the bridge. A more detailed analysis of the steering system will be performed to ensure that the driver has adequate control over the positions of each propulsion unit. A fixture made from wood will be used to test the different variables of the steering system that can be adjusted such as the lever arm and the diameter of the drive shaft. A schematic of the system setup can be found in Appendix T.
5.4. Material Choices
The rudder will be constructed with a wood core base that is covered in layer of carbon fiber. This causes it to have a high strength-to-weight ratio, while still being relatively easy to
manufacture. Thin, ¼ inch wood airfoil sections with circular holes in the middle and end are to be stacked on top each other to form the rudder core.
The hinge flange, box tubing, and box tubing support were all chosen to be aluminum so that the aluminum rudder hinge can be welded to both.
The differential housing is to be machined from aluminum for ease of manufacturing and low cost. It will not be welded to anything, and therefore does not have to be the same material as other components.
The propeller, motor mount, and tail cone are to be 3D printed. The motor mount and tail cone can be printed out of PLA at the innovation sandbox at Cal Poly. Prototype propellers made from PLA were printed at Cal Poly, though the final propeller will likely be outsourced to a company with printers large enough to complete the print as one part. Hard resin is being considered for the propeller material because it is light, stiff, and produces one of the best surface finishes of any 3D printed material.
5.5. Propeller Design/Specification Descriptions
To design the propeller for our boat, we used a MATLAB program called OpenProp. OpenProp was developed by MIT and Dartmouth college to analyze propeller performance given a number of inputs. It computes propeller performance using Lerb’s analysis method in conjunction with a lifting-line analysis on the blade surfaces, code similar to what is used in computational fluid dynamics (CFD).[27] This method designs based on inputs of diameter, rotational speed, inflow
velocity, thrust desired, and various geometric inputs. The code then iterates to create a propeller to reach the thrust desired at the maximum possible efficiency, and outputs the resulting
propeller characteristics and full geometry.
Our boat has a limitation of a little less than 230 W of power for each of the two propellers, and we want to design for an unknown maximum inflow velocity and maximum efficiency.
However, OpenProp designs a propeller using a thrust-based method, not power-based method, making it difficult to use for our specific needs. To remedy this, additional code was written to analyze propellers in a way that makes more sense for our specific requirements.
performance curves for a Wangeningen B-series propeller (see Figure 2.8 and Figure 2.9), assuming an input power of 200 W and inflow velocity of 5.5 mph. Initial estimates produced an optimal rotational speed of 500 RPM, diameter of 11.03 in, and efficiency of 79.5%. These hand calculations are located in Propeller Hand Calculations in Appendix H.
To provide a more robust estimate of diameter, rotational speed, and expanded area ratio (EAR), code was developed in OpenProp to iterate over a range of input values to determine which produced the highest efficiency. Results of this iteration are shown in Figure 5.8, which shows efficiency for lines of various diameters as rotational speed is varied. Code was developed to create new plots for different values of EAR; Figure 5.8 shows the value of EAR that produced the highest efficiency, equal to roughly 0.325.
Figure 5.8. Parametric study varying efficiency and shaft speed for a specific EAR.
Each point on the curves in this plot represents a completely new optimized propeller design. Based on the results, we can assume a best possible efficiency of around 84%, with max efficiency increasing with larger diameters. However, larger propellers only reach their
maximum efficiency at a smaller range of RPMs, which would be more difficult to achieve. We chose a diameter of 12 in (blue bolded line) for our final design, as it has nearly the same maximum efficiency as higher diameter propellers and has a wider range of acceptable RPMs. Additionally, 12 in is a much more reasonable size to manufacture.
Another key parameter that affects what our top speed will be is the drag on each hull of the pontoons of the boat. The drag coefficient ag, can be used to determine the required thrust to achieve a maximum speed by using the following equation:
>hij = ag, ∗ (0.5\?@,l@m7 )
different ag, assumed for propeller designs and different actual values of ag, to see how they would affect top possible speed; the results of this test can be seen in Figure 5.9.
Figure 5.9. Hull drag coefficient analysis for propeller design.
From these plots, it is clear that assuming different ag, values for the propeller design does not affect the top possible speed at all; the only difference is the rotational speed that the propeller must be run at to achieve this top speed. This is very useful to know for our propeller design, as it shows that even if we see a drag coefficient that is different than what is expected, our propeller can still be run to achieve the same top speed as if we had seen exactly what we expected. After seeing this, we decided to use a value of ag, = 0.1 ft7 as an input into OpenProp, as a conservative estimate. This value would lead to a predicted top speed of about 7.7 mph, above our goal of 7 mph. Higher speeds are also achievable if ag, is reduced.
The number of blades (%) was chosen with a similar iteration process. In general, efficiency decreases with increasing number of blades, while thrust increases. We chose to use three blades for our design; two would be more efficient, but also had the possibility of adding more vibrational issues if the blades were not manufactured to be perfectly balanced.
Once values for /,#, ", %, and ag, were chosen, setting an input power of &4p = 230W allowed for all design constraints to be established for the code to run. The propeller was designed using a NACA66 series airfoil[29] thickness with NACA a=0.8
meanline, which are typical airfoil shapes of propellers. Figure 5.10 shows the traditional performance curve for the designed propeller, and Figure 5.11 shows a version of the same information with dimensioned instead of non-dimensional variables for a better understanding of what the performance chart shows.
Figure 5.11. Performance chart with dimensioned variables.
Using Figure 5.11, we can see what our predicted performance of the propeller will be more clearly. The color background represents efficiency, with the green line representing the maximum possible efficiency. From this chart, we can see that our input power limits the top propeller speed to about 350 rpm when the boat is at rest, but as the boat gains speed the
propeller speed can increase. The blue dot represents the best performance point, where all input power is being used to overcome drag. Points above the purple line represent states where there is excess force that can be used to accelerate, but below the line drag dominates and causes a deceleration. With our current input estimates, a maximum speed is predicted to be 7.73 mph. All key design characteristics from this analysis are shown in Table 5.1. Propeller design was done for a single propeller at a time, using half of the total power and hull drag that the entire boat will see in operation.
Table 5.1. Propeller design characteristics.
Geometric Variables Value Performance Variables Value
Diameter " 12 in Ship Speed ?1 7.73 mph
Hub Diameter "$ 1 in Rotational Speed A 500 RPM
Number of Blades % 3 Thrust > 12.4 lbf
Expanded Area Ratio /,# 0.325 Torque B 38.9 lbf•in
Meanline NACA a=0.8 Input Power &4p 230 W
Thickness NACA 66 Efficiency C 83.1%
After calculating the geometric dimensions, OpenProp creates a 3D image of the full propeller in a 3D MATLAB plot. However, to convert this into a usable CAD file, it was necessary to turn this 3D data into the correct file format. A function was written in MATLAB to convert the 3D data points that make up the propeller into an STL file, which could then be imported into SolidWorks or Fusion 360 to edit the features of the hub.
OpenProp also contains a function that checks the blades for cavitation. This code was used with our design conditions, and the results from this test are shown in Figure 5.12. Cavitation occurs when − aJ⁄ ≥ 1; for our parameters, this value never exceeded 0.06, signifying that we will c not have a problem with propeller cavitation.
Figure 5.12. Blade cavitation diagrams from OpenProp.
To ensure that our blades would not break under stresses when in operation, a stress analysis was done in OpenProp as well. The results of this test can be seen in Figure 5.13. With our design conditions, the maximum blade stress is only about 3.4 MPa, much lower than the yield strength of any material that we would use to make it. We will 3D print our propellers either out of PLA or epoxy resin, which have estimated yield strengths of 26 MPa and 75MPa, respectively; this would give us a factor of safety between 7 and 22, signifying almost no possible risk of blade yield.
This stress analysis does not take into account the full propeller and does not account for stress concentrations where the blade connects to the hub. However, according to Carlton,[21] a fillet
Figure 5.13. Blade stress analysis using OpenProp.
5.6. Electrical System
The electrical system is made up of nearly all off the shelf components that are wired together for our system to operate. The solar cells are wired to a solar regulator, which are wired to a kill switch, which are wired to the two ESC motor controllers, which are wired to the motors. A diagram of this system can be found in Appendix I. With the desire to reduce losses in the electrical system as much as possible the desire to use off the shelf parts arose. These parts have been designed and re-designed to be as efficient as possible and that is why they were chosen for our design. The regulator and controllers are kept in a sealed plastic box on the boat during operation to eliminate the chance of water interaction with the components.
5.7. Safety, Maintenance, and Repair Considerations
Since the boat will be used just for the competition this year the maintenance and repair
considerations are going to be specific to getting the boat to compete. The safety considerations will include safe practices for manufacturing, transportation, and operation of the boat.
5.7.1.Safety
a sealed plastic container so people cannot interact with live wires. Life vests, safety flags, airhorns, and a paddle will be on the boat during usage, in case of emergency.
5.7.2.Maintenance
Since the system is designed to be used for a single day of competition there is not much planned for maintenance. All rotating and sliding parts will be oiled or greased to prevent frictional ware. Cleaning after practice runs and testing will reduce the chance of any buildup on the system. 5.7.3.Repair Considerations
All major components will have spares made in case of failure on the day of competition. This includes driveshafts, rudders, props, controllers, and motors. The modular design makes
replacements for these parts easier to do on the beach the day of competition. Additional carbon fiber patch kits, electrical wire, and tools will be on site as well. In case of failure in the
transmission box an additional premanufactured unit used to change direction without reduction will be brought in case there are major issues on the day of the race
5.8. Cost Analysis
The four subsystems to be cost-analyzed in this section are: powertrain, hull-mounting, electronics, and steering.
The powertrain makes up most of the cost due to the expense of highly efficient motors. The desired T-motor U8II is $319.99, with the associated motor controller costing $60.00. Other high-cost components in the powertrain are the gearing housing and motor-mount due to their complexity that necessitates a 5-axis CNC to produce them. Due to a sponsorship by a local company with donated machine time and materials, these manufacturing costs have been reduced to zero. Finally, the propeller would be expensive to manufacture if 3D printing was not as mature and reliable as it is now, and if the powertrain had an input power of more than 3kW, which would exceed the yield strength of inexpensive materials.
The hull mounting subsystem components are manufactured from stainless steel donated by Stainless Steve Fabrications. Because the size of these components is small, the cost would not be above $50.00 for materials.
SMUD provided the solar panels, which otherwise would have cost a total of $500.00. The other electronic components include a power optimizer, costing $109.67, and wiring, which will cost between $25-$40.
6.
Manufacturing Plan
This section of the report will outline the steps needed to get all raw materials, how to process those materials into parts, how to assemble the parts together, and what will be outsourced. Materials that were donated and services donated do not have associated cost and are called out as donated throughout this section. Drawings of parts to be manufactured are located in
Appendix M, and links to parts that we are buying off the shelf are located in Appendix O. 6.1. Procuring Materials
The most used material for this product is aluminum and is likely to be the costliest material used. The team was able to find local vendors that were willing to donate the aluminum and reduce the cost of the system. Wooden plywood or MDF sheets will be used for the
rudder/water-foil, they will be purchased from Home Depot. Along with the wood core, Carbon Fiber will be used for the exterior and interior supports. The interior supports will be purchased online from a yet to be determined source, while the exterior carbon has been donated by the SAMPE club on campus. The Motors were purchased online from Arrow Motors. The bearings, gears, ball joints, steering rods, housing, and related parts will be purchased from McMaster. The box tubing, sheet metal, eyebolts, solid aluminum rods, bolts, nuts, and washers will be
purchased from Home Depot. The Solar Panels are provided by SMUD and have been brought down to San Luis Obispo. The Solar Regulator and ESC will be purchased from T-motors online. Any additional parts needed for fabrication will primarily be donated from local vendors or purchased from them.
6.2. Manufacturing and Assembly
This section describes a step-by-step process for creating each part of the propulsion assembly. Any parts that are planned to be outsourced will have a comment in this section before
describing how the part will be integrated with the other components of the system. The timeline for manufacturing, assembly, and testing can be seen in the Gantt Chart found in Appendix F. 6.2.1.Mechanical Drive Steps
1. Convert CAD models into CAD/CAM and product G-Code script to produce the differential housing, motor mounts, and shaft adapter.
2. Machine differential housing with 5-axis CNC (outsourced) 3. Machine motor mount with 5-axis CNC (outsourced) 4. Machine motor-shaft adapter 5-axis CNC (outsourced) 5. Press pinion into small bearing with a bearing driver 6. Press gear into large bearing with press and vice 7. Press small bearing into housing with a bearing driver 8. Press pinion-shaft into pinion with press and vice 9. Press gear into housing with a bearing driver 10.Press prop-shaft into gear with press and vice
11.Bond differential into rudder/water-foil with epoxy and two through bolts
12.Bond motor mount into rudder/water-foil with bolt through down-shaft and epoxy to connect bottom surface of the mount and the top of the water-foil
13.Run long shaft through carbon tube with bearing supports on top and bottom to ensure alignment
14.Install motor adapter onto motor with bolts and hand wrench 15.Mount motor onto motor mount over long shaft
16.Tighten the set screw on the motor adapter onto the shaft 17.Install 0.5-13 Helicoil into prop hub
a. This step and the next are to be completed once props are ready to be attached 18.Screw prop onto prop shaft
6.2.2.Propeller Steps
1. Produce STL file with OpenProp through MATLAB given design conditions of water and boat
2. Convert STL to solid and 3D Print out of Resin (Outsourced) 3. Tap hole on rear or prop for mounting
4. Attach shaft with duel sided threads onto prop and then to differential 6.2.3.Rudder/Water-foil Steps
1. Using NACA airfoil generator software create an airfoil with around a 1” maximum height. Make sure the length to height ratio is at least five. (NACA 0018 was used) with a 0.75” diameter hole at the center of the tallest length
a. Drawings shown in Appendix L-9
2. Make cutting pattern for 2’ by 4’ wood panels out of the airfoil generated in the previous step with a depth of 1” (may use different depth depending on the tools available) in CAD/CAM software and export for laser cutters
3. Cut out enough airfoils to create a height of 36” (2x18”) with the laser cutter in Mustang 60
4. Slide the wood pieces onto the purchased carbon fiber tubes with an exterior diameter of 0.75” one at a time adding epoxy to the top of each piece before adding next, except for the last one
a. Let it dry
5. Cut prepreg carbon fiber rectangles with a height of 18” and a width of the perimeter length of the airfoil
a. A string wrapped around the airfoil can produce an accurate perimeter reading. 6. Wrap the airfoils in the cut carbon fiber sheets and cure at manufactures recommended
cure cycle
7. After cure cover end of airfoil with an additional epoxy treatment to ensure the end is sealed
8. Sand and water seal the entire carbon fiber section to ensure no water ingress
9. Drill holes through carbon fiber and wood with drill press and proper drill bits (be sure to wear proper PPE’s)
![Figure 2.4. Airfoil shape of blade cross section. [21]](https://thumb-us.123doks.com/thumbv2/123dok_us/8219010.2179108/17.918.121.800.107.536/figure-airfoil-shape-blade-cross-section.webp)
![Figure 2.7. Visual representation of skew and rake. [22]](https://thumb-us.123doks.com/thumbv2/123dok_us/8219010.2179108/18.918.189.752.502.770/figure-visual-representation-skew-rake.webp)
![Figure 2.9. Power-based propeller performance chart with EAR = 0.300. [23]](https://thumb-us.123doks.com/thumbv2/123dok_us/8219010.2179108/20.918.150.767.538.1018/figure-power-based-propeller-performance-chart-ear.webp)
![Figure 2.11. Cavitation on propeller blades. [28]](https://thumb-us.123doks.com/thumbv2/123dok_us/8219010.2179108/21.918.109.809.689.891/figure-cavitation-on-propeller-blades.webp)