SCHOOLS OF EXCELLENCE AND EQUITY: CLOSING ACHIEVEMENT GAPS THROUGH ACADEMIC EMPHASIS
Jen Benkovitz
A dissertation submitted to the faculty of the University of North Carolina at Chapel Hill in partial fulfillment of the requirements for the degree of Doctor of Education in the
School of Education.
Chapel Hill 2008
ABSTRACT
JEN BENKOVITZ: Schools of Excellence and Equity: Closing Achievement Gaps Through Academic Emphasis
(Under the direction of Dr. Kathleen Brown)
Currently, the debate in public schools centers on the achievement gap and is politically bathed in the language of equity and excellence. While research continues to suggest that our schools are plagued with inequities that perpetuate this gap and maintain the status quo (Darling-Hammond; 1994; Jenks & Phillips, 1998; Kozol, 1991; McKenzie & Scheurich, 2004), there are some schools that play a key role in raising student
achievement for all students and in closing the achievement gap across socio-economic and racial lines (Comer, 1994, Ladson-Billings, 1994, Reyes et al., 1999, Skrla & Scheurich, 2001). This study explored how K-5 elementary school principals of state recognized “Honor Schools of Excellence” are (or are not) pursuing, supporting, and achieving excellence and equity and sought to offer school leaders specific strategies for attaining this goal.
For the purpose of this study, data were analyzed through the lens of Academic Emphasis (Hoy, Tarter, and Hoy, 2006). Schools with high levels of academic emphasis are characterized by high but achievable academic goals for all students, a belief that all students are capable of achieving these goals, an orderly and serious school environment, and an overall pursuit for academic success (Goddard et al., p.684). Research
ACKNOWLEDGEMENTS
This dissertation represents four years of work, the collective support and
encouragement of my many people, and the completion my childhood dream of attending and graduating from the University of North Carolina.
First and foremost, I have many people to thank at UNC, many of whom began instilling faith in me six years ago when I first entered the Master’s Program. I would especially like to thank Dr. Kathleen Brown, my committee chair, for her constant support and encouragement. I would also like to thank my dissertation committee, Dr. Schainker and Dr. Veitch, whose professional feedback and support will last a lifetime. Finally, a special thank you to A.J. Muttillo and Thad Urban, the graduate students with whom I worked to complete this study.
My friends and family also played a large role in the completion of this study. To my father, I would like to express my appreciation for his ongoing support and
inspiration; this dream started in our living room twenty-four years ago when, upon watching UNC beat Duke in the ACC Championship, he educated me about the rigor and prestige of UNC and made me believe I could get here. I also want to thank my
grandmother for listening to me talk about this study each and every morning and for always believing in my ability to “get it done.” To my friend and colleague, Dara Butler - thank you for believing in me and for pushing me to believe in myself when you
for inspiring me to “dream big.” Finally, I would like to thank Chris Scott, the only person I know who may be a little more competitive than I am; thanks for pushing me to the finish line, Chris.
I must also recognize the amazing staff, students, and families with whom I have the privilege to work. Thank you for your patience and for the inspiration you offer me as I aspire each day to be a better leader.
I would also like to thank the members who participated in this research study; each willingly shared his/her time and insight with me and their contributions are immeasurable.
TABLE OF CONTENTS
Page
LIST OF TABLES... xii
LIST OF FIGURES ... xiii
I. INTRODUCTION………1
Problem Statement ... 1
Purpose Statement... 1
Research Questions………..3
Background ... 3
Historical Roots ... 5
Present Issues in Education... 6
Conceptual Framework... 10
Limitations ... 11
Definition of Terms... 12
Significance... 14
II. REVIEW OF THE LITERATURE AND CONCEPTUAL FRAMEWORK... 15
Introduction... 15
Systemic Equity ... 16
Achievement Equity... 17
Exemplars ... 18
HiPass ... 19
School Restructuring... 23
Programmatic Equity ... 27
Students in Special and Academically Gifted Programs ... 27
Discipline ... 30
Rigorous Curriculum ... 32
Teacher Quality Equity ... 36
Certification ... 36
Years of Experience... 39
National Board Certified Teachers ... 40
Teacher Quality Formulas... 43
Other Studies... 44
Leadership for Excellence and Equity ... 46
Principal’s Role in Promoting Student Achievement ... 46
Characteristics of Effective School Leaders ... 48
Leadership for Social Justice, Equity and Excellence ... 54
Challenging the Status Quo ... 55
Understanding Policy... 56
Resisting Deficit Thinking... 57
Moral Leadership ... 59
Critical Reflection... 60
Leadership for Transformation through Community... 61
Instructional Leadership... 64
Collective Efficacy... 73
Roots ... 73
Theoretical Background... 76
Significance of Collective Efficacy ... 78
Faculty Trust ... 80
Conclusion ... 85
III. METHODOLOGY ... 89
Introduction... 89
Research Purpose ... 89
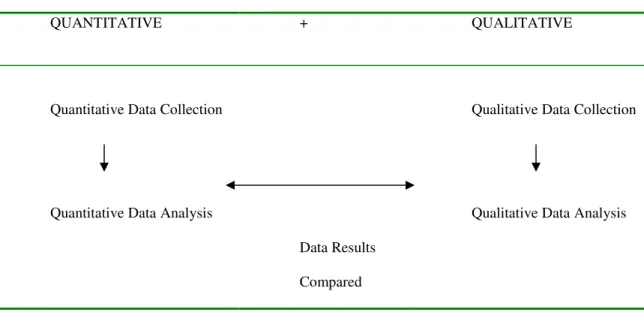
Rationale for Mixed Methods Research Design ... 91
Role of the Researchers ... 93
Data Collection Procedures... 94
Research Questions... 95
Two-Phase Research Design... 96
Site Selection ... 98
Data Collection ... 102
Phase One………102
Phase Two………...106
Methods of Verification………108
Limitations………111
Outcome of the Study………...112
IV. QUANTITATIVE DATA ANALYSIS……….113
Audit of Teacher Quality……….114
Audit of Programmatic Issues………115
Audit of Achievement………118
Concluding Discussion………..120
V. QUALITATIVE DATA ANALYSIS……….124
Introduction……….124
Policy: Principal Sets the Stage………..128
Student Achievement is a Collective and Collaborative Effort……….128
Recruit Highly Qualified Teachers Who Share Your Vision…………134
A Safe and Orderly Environment………..139
Practice: Close Monitoring of Teaching and Learning………..144
Recognition, Encouragement and Celebration of Academic Achievement………...144
Data Driven Decision-Making……….147
Principal Offers Instructional Feedback and Support………..151
Beliefs: High Expectations……….158
Expecting Excellence………..158
The State's Curriculum is Non-Negotiable……….161
Summary………165
VI. CONCLUSION………..168
Introduction………...168
SGS and LGS Similarities: Achieving Excellence………...171
A Teamwork Approach………173
A Balanced Approach………..174
Guided by a Strong Sense of Purpose………..176
An Insistent Disposition………...177
Answering the Research Questions………... 181
Recommendations for Future Research………..184
VII. REFERENCES……….187
VIII. APPENDICES………203
A: Semi Structured Interview Protocol for Principals……….203
B: Semi Structured Interview Protocol for Assistant Principals……….204
C: Semi Structured Interview Protocol for Teachers………...205
D: Semi Structured Interview Protocol for Parents……….206
LIST OF TABLES
Table 2.1 Top Ten Principal Leadership Responsibilities:
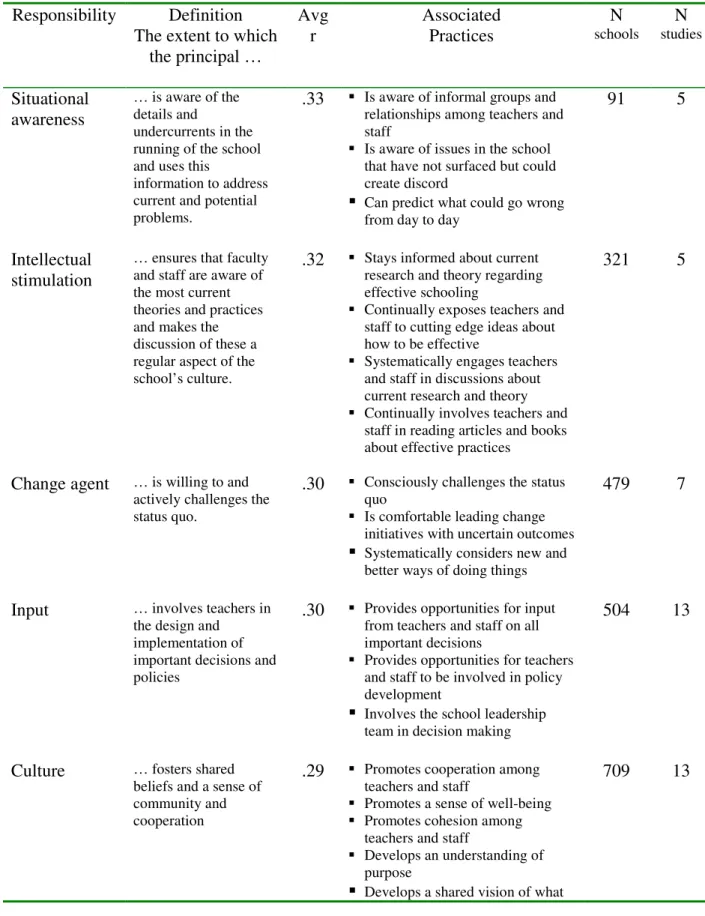
Average r and Associated Practices ………..51 Table 2.2 Academic Emphasis Scale Items ……….……….71 Table 3.1 Demographic Data for Smaller Gap Schools (SGS)
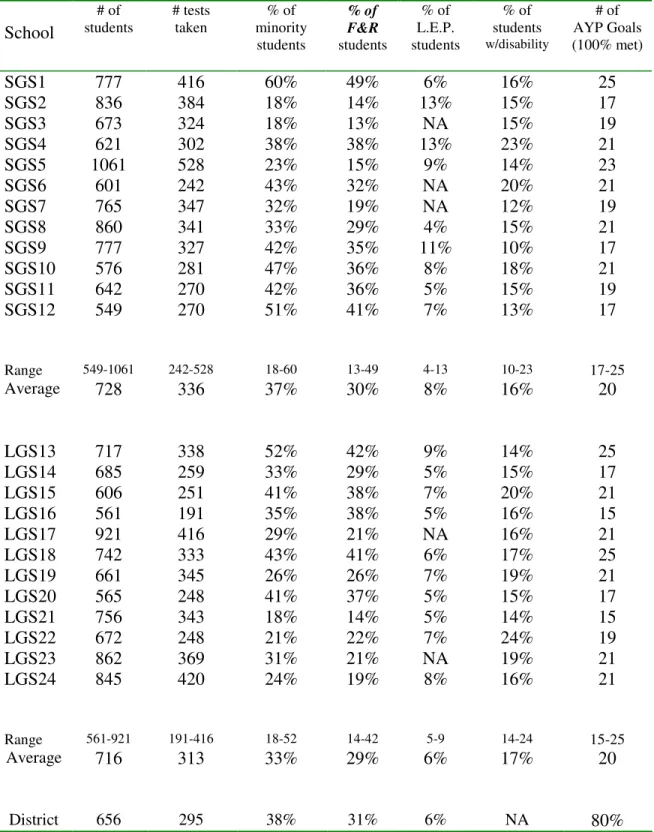
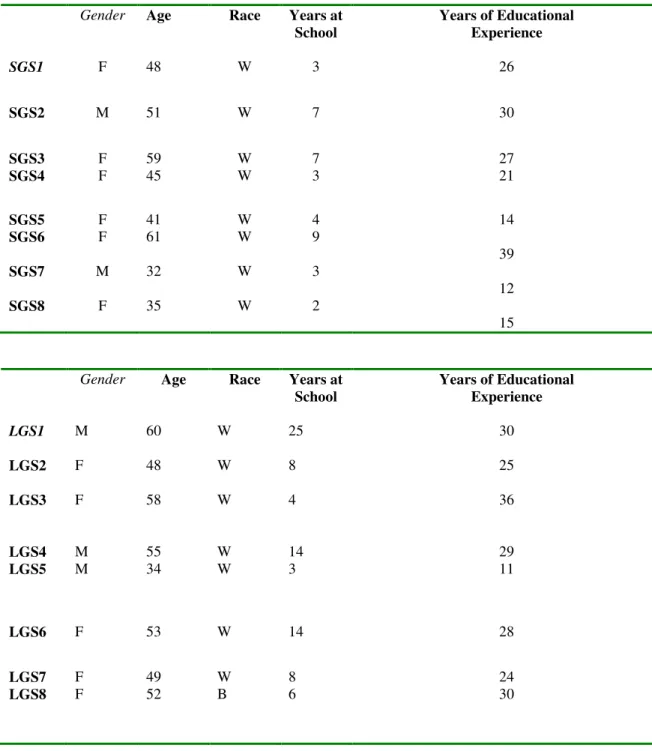
and Larger Gap Schools (LGS) – Complete data set
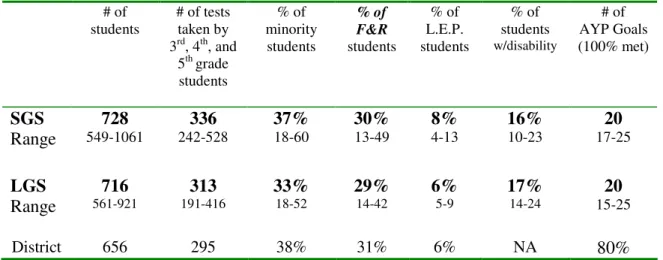
for 2004-05………...………100 Table 3.2 Principals’ Demographic Information ………109 Table 4.1 Data for Smaller Gap Schools (SGS) and
Larger Gap Schools (LGS) – Average data set
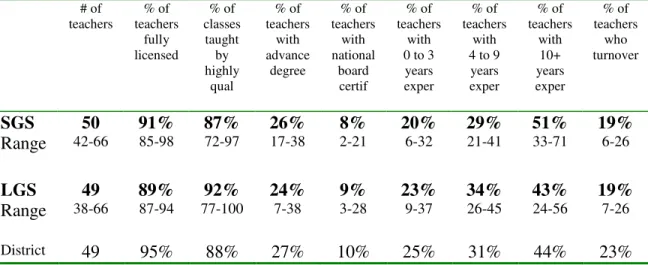
for 2004-05 ……….………114 Table 4.2 Teacher Quality Data for Smaller Gap Schools (SGS)
and Larger Gap Schools (LGS) –
Average data set for 2004-05 ………..………116 Table 4.3 Programmatic Data for Smaller Gap Schools (SGS)
and Larger Gap Schools (LGS) – Average data set
for 2004-05……….…….119 Table 4.4 Working Condition Data for Smaller Gap Schools (SGS)
and Larger Gap Schools (LGS) – Average data set
for 2004-05………..………119 Table 4.5 Achievement Equity Data for Smaller Gap Schools (SGS)
and Larger Gap Schools (LGS) –Average data set
for 2004-05………..…………120 Table 5.1 Emergent Themes Regarding Policies, Practices,
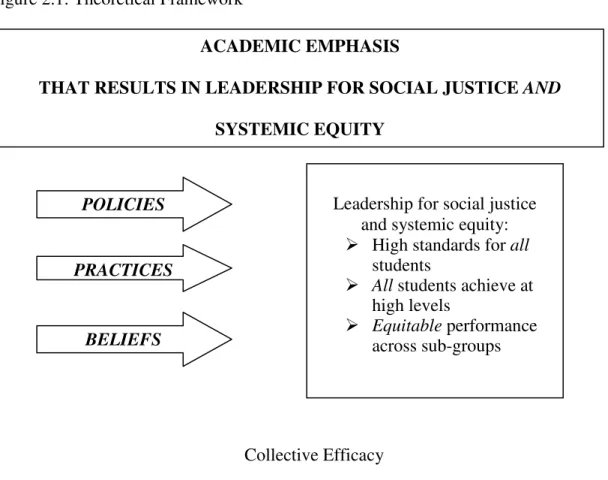
LIST OF FIGURES Figure 2.1 Academic Emphasis for Social Justice
I. INTRODUCTION Problem Statement
Although studies have examined schools that make a difference in the lives of marginalized children (Oakes, Quartz, Ryan & Lipton, 2000; Riester, Pursch & Skrla, 2002), there is an absence of literature regarding principals as the unit of analysis and the process of principals serving as leaders for social justice. Related to this is an absence of documented strategies that principals who are leading for equity and excellence use to advance their work in the face of countervailing pressures of public schools.
Purpose Statement
Left Behind (NCLB) proficiency requirements for Adequate Yearly Progress (AYP).
This accountability system conflates excellence and equity, therefore offering a narrow definition of student achievement and perpetuating the current achievement gap that separates many minorities from their white counterparts.
In Phase One, quantitative data were collected through equity audits to scan for equities and inequities across multiple domains of student learning and activities. The purpose was to document and distinguish between “good schools” (i.e. those that are both excellent and equitable) and those that are notand to uncover practices in the “good schools” that lead to both excellence and systemic equity. In Phase Two, through the use of semi-structured interviews with principals, assistant principals, teachers, and parent leaders, qualitative data were collected to document the specific strategies that principals of “good schools” used to confront and change past practices anchored in open and residual racism and class discrimination. “Good leaders” committed to excellence and
equity find a way “for all students to achieve high levels of academic success, regardless of any student’s race, ethnicity, culture, neighborhood, income of parents, or home language” (Scheurich & Skrla, 2003, p.1).
For the purpose of this study, the researchers rank ordered and then separated the identified schools into two categories. The 12 more equitable schools that recorded achievement gaps of 15% or less between their White students and their minority students were labeled SGS for “small gap schools.” The 12 less equitable schools that recorded achievement gaps of more than 15% between their White students and their minority students were labeled LGS for “large gap schools” (see Chapter 3 for
researchers the opportunity to compare and contrast leadership styles with the hope of identifying specific practices that support both excellence and equity.
Research Questions
The following question focused the research study: How are principals of K-5 public “Honor Schools of Excellence” pursuing, supporting and advancing social justice, excellence, and systemic equity in a suburban southeastern county? The sub-questions include the following: a) What are principals of K-5 “Honor Schools of Excellence” doing to ensure the success of all of their students? b) What similarities do school leaders who are successful in creating equity and excellence have in common? (c) What findings can connect to and build upon the literature related to leadership for social justice and systemic equity? (d) What can be learned from “Honor Schools of Excellence” that could benefit other schools with similar demographics?
Background
The historical marginalization of underprivileged students often results in a school culture that perpetuates the status quo and ignores the social injustices that permeate our schools. As a result, the fate of many of our students is a pre-determined mold designed for school failure and social inequity. A school culture that does not embrace the
Social justice, due to its historical roots, carries various, contextual meanings and is therefore an elusive term to define. “In Latin, justice comes from the word equitas, which means fairness, and social derives from the word socius, meaning companion. Combining these Latin roots produces a literal definition of social justice as being fair to one’s companion” (Shoho, Merchant & Lugg, 2005, p.47). Social justice has roots in fields such as sociology, history, law, social work, and theology. While there appears to be no single definition for social justice, there has been wide consensus with regard to the guiding principles of equality, fairness, acceptance of others, and inclusiveness (Shoho et al., 2005).
Recently, many prominent scholars in the field of education have offered definitions of social justice (Bogotch, 2002; Furman & Gruenewald, 2004; Riester, Pursch, & Skrla, 2002; Shields, 2004). Scheurich and Skrla (2003) equate social justice in schools with equity and excellence in schools whereby “literally all students achieve high levels of academic success, regardless of any student’s race, ethnicity, culture,
neighborhood, income of parents or home language” (p.1). Moreover, Theoharis (2004), in a paper entitled “Toward a Theory of Social Justice Educational Leadership,” goes a step further by attributing social justice [in schools] to school leadership by stating:
I define social justice leadership to mean that [these] principals advocate, lead and keep at the center of their practice and vision issues of race, class, gender, disability, sexual orientation, and other historically and currently marginalizing conditions in the United States. (p.3)
Historical Roots
Spring (2005), in his book, The American School: 1642 – 2005, suggests that hegemony is a central theme in educational history. Spring lays the foundation beginning with the English invasion of North America in the 16th century, eventually leading the U.S. government to aim for a national culture to preserve, honor and maintain Protestant Anglo-American values. He reveals that one reason for the 19th century development of public schools was to “ensure the dominance of Anglo-American values that were being challenged by Irish immigration, Native Americans and African-Americans” (p.3). Spring explains that public schools, as a result, became “defenders of Anglo-American value with each new wave of immigrants” (p.3) and, in the following century, served to assimilate minorities and therefore perpetuated hegemonic practices. Although educators have preached equality of opportunity, schools have been repeatedly plagued with acts of religious intolerance, racial segregation, cultural genocide, and discrimination against immigrants and non-whites. Spring argues that hegemony (this quest for cultural and racial domination) persists today in the debate over multiculturalism and is evident as schools perpetuate and reproduce the dominant cultures and values in society.
Although Brown sparked four major educational developments (Elementary and
Secondary Education Act Title I and Title VII, funding equity and adequacy, affirmative action, and multicultural education), “improvement has been mixed, slow in coming, insufficient in impact, and with a few backward steps” (Valverde, 2004, p.377).
Present Issues in Education
Currently, the debate in public schools centers on the achievement gap and is politically bathed in the language of equity and excellence. Despite decades of efforts to provide an equitable education to all of our nation’s students, significant gaps in
achievement remain between White students, students of color, and students living in poverty. A gap also exists for middle class students of color in suburban schools. This achievement gap has been reported and discussed extensively in the research on student achievement (Kozol, 1991; Jencks & Phillips, 1998; Williams, 2003).
Recent data compiled by the National Center for Education Statistics (NCES) indicate that this achievement gap persists. Using data from the 2005 National
who were not eligible for subsidized lunches. The gap between the same subgroups was 29 scale score points on the reading section of the NAEP.
McKenzie and Scheurich’s (2004) research of the current educational achievement gap reveals the following:
There is an abundance of data and research that show that students of color not only are performing at lower achievement levels than their White counterparts but, also, are overrepresented in special education and lower level classes, dropping out of school at higher numbers, frequently educated by teachers who do not believe they can learn or who are actively negative in their attitude toward these students, underrepresented in gifted and talented and higher level classes, often times educated in schools with less resources and with the least experienced teachers, and more likely to be suspended or expelled. (p.602)
These data reflect an inequality with regard to student achievement, program accessibility, teacher expectations of students, instructional delivery, curriculum implementation, and resource allocation. There is no question that minority and socio-economically disadvantaged children are being left behind and, as a result, this growing disparity has gained national attention.
Many researchers have attempted to explain why this gap exists. Some (Jensen, 1969; Herrnstein & Murray, 1994) believe that the gap exists due to the genetic
inferiority of African-Americans in comparison to Whites. Although the validity of their studies has come into serious question, many still subscribe to this genetic deficiency line of thinking. Other scholars, such as Slavin (1986), have pointed to class differences, families, and the access to learning opportunities at home as a major cause of the
achievement gap. Slavin, and others who believe as he does, postulates that, if students of color or students of poverty were raised in White middle-class homes, they would
These same authors, however, do not address the many examples of students who are successful but were not raised in White middle-class homes.
Valencia (1997) called the views of individuals such as Slavin, Jensen and others
deficit thinking. Those who believe in these views blame poor school achievement on the deficits of the students and their families. When blame is placed on the student, it
simultaneously exonerates the school. As King, Houston, and Middleton (2001) state, “Individual characteristics emerge as most responsible for poor school performance. Such discussions render invisible schooling practices that contribute to school failure” (p.434). However, many schools exist that have been successful educating students of color and students of poverty (Comer, 1994; Johnson & Asera, 1999; Ladson-Billings, 1994; Reyes, Scribner, & Scribner, 1999; Skrla & Scheurich, 2001). Considering the evidence from these schools, it is impossible to ignore the role that the school system plays in providing an excellent and equitable education for all students.
achievement that exists in our nation’s public schools. Granted, this is not an easy
problem to solve, but as Skrla, Scheurich, Johnson, and Koschoreck (2001) conclude, “… the fact that, broadly speaking, our children experience differential levels of success in school that is distributed along race and social class lines continues to be the overridingly central problem of education” (p.239).
The standards based movement, along with the federal No Child Left Behind (NCLB) legislation, proposes criteria for how to eliminate the achievement gap between minority students and their peers. “The broad goal of NCLB is to raise the achievement levels of all students, especially underperforming groups, and to close the achievement gap that parallels race and class distinctions” (Darling-Hammond, 2004, p.3). Across the country, school systems are required to publish “report cards” that report disaggregated data regarding students’ results on standardized tests. This information is then used to advertise the qualityof teaching within a school, the performance of individual groups of students and, in many cases, leads to the dismissal of school leaders and/or the
involvement of a team of people (often without educational experience) who “take over” the school to ensure equity and excellence.
to ten times greater funding than that of students in our poorer districts. Kozol’s (1991) research, documented in his book, Savage Inequalities, elaborates upon these funding inequities and paints a sad, disheartening picture of the impact they have upon the education of poor and minority children across our nation. Regardless, there is still hope that the United States will move forward with a socially just agenda of providing all children with equal access to quality, desegregated public education (Brown & Harris, 2004).
Despite funding inequities that favor the wealthy and ignore the disadvantaged, despite federal mandates that conflate measuring schools with fixing them, and despite societal norms and values that often serve as impediments to equality and excellence, our schools can serve as vehicles for social justice. We must first turn our attention to what is happening within our schools; we must uncover and expose hegemonic practices, identify socially and morally just strategies for how to respond, and must insist and ensure that all children receive the equitable and excellent education to which each is entitled. The success of our schools relies upon leadership that upholds and advocates equality of opportunity for all of our children.
Conceptual Framework
structural model of academic optimism supports and builds upon Seligman’s model of learned optimism. Hoy and his colleagues outline three underlying components: (1) academic emphasis; (2) collective efficacy; and (3) faculty trust, and suggest that collectively, these components enhance learning, improve student achievement, and shape school norms and behavioral expectations.
Limitations
One of the central limitations of this study is that “excellence” in the selected county is defined solely by students’ attainment of a target score (AYP) on a standardized test. The “target” score, as defined and measured by NCLB, conflates excellence and equity, therefore offering a narrow definition of student achievement and perpetuating the current achievement gap that separates many minorities from their white counterparts.
Another limitation to this study is its focus on a single school district. Furthermore, this district is unique in its focus to keep most schools balanced by subgroups of students identified under NCLB. As a result, most of the schools in this study have a population of African-American and Hispanic students that ranges from 20% to 40% of the total school population. This is not representative of many districts or many schools in these districts that essentially remain segregated. Despite the limitation, it is an opportunity to add a unique district to the research on equity in schools. Also, the site selection process did not include factors and/or variables such as Title I status, budgets, etc. that may have had an impact upon the findings.
between 10 and 20%. Admittedly, these schools are not perfectly equitable. However, it further illustrates the need for this research and the importance of not only learning from, but also building on, the success of the more equitable schools in the district.
A final limitation is a result of the large quantity of interviews (80 in all) that were conducted by multiple researchers. As a result, a broad semi-structured interview
protocol was used, which did not allow for specific probing. In addition, data was self-reported in interviews but not verified through observations. To counter this limitation, data was collected and triangulated through multiple sources.
Definition of Terms
Academic Optimism: A conceptual framework adopted by this study that consists of three sub-components. The sub-components include:
o Academic emphasis: The extent to which a school is characterized by a
press for academic achievement (Hoy, Tarter, & Woolfolk Hoy, 2006).
o Collective efficacy: Includes self-efficacy beliefs of students, self-efficacy
beliefs of teachers, and teachers’ collective efficacy beliefs about the school (Hoy, Tarter, & Woolfolk Hoy, 2006).
o Faculty trust: A willingness to be vulnerable to another party based on the
confidence that the party is benevolent, reliable, competent, honest, and open (Hoy, Tarter, & Woolfolk Hoy, 2006).
Deficit Thinking: Students who fail in school do so because of alleged internal deficiencies (such as cognitive and/or motivational limitations) or shortcomings socially linked to the youngster—such as familial deficits (Valencia, 1997).
Leadership for Excellence and Equity:
o Schools in which all students achieve high levels of academic success,
regardless of any student’s race, ethnicity, culture, neighborhood, income of parents, or home language (Scheurich & Skrla, 2003, p.1).
o Schools in which principals advocate, lead and keep at the center of their
practice and vision issues of race, class, gender, disability, sexual
orientation, and other historically and currently marginalizing conditions in the United States. (Theoharis, 2004, p.3).
Systemic Equity: The transformed ways in which systems and individuals
habitually operate to ensure that every learner—in whatever learning environment that learner is found—has the greatest opportunity to learn enhanced by the resources and supports necessary to achieve competence, excellence,
independence responsibility, and self-sufficiency for school and for life (Scott, 2001).
o Achievement Equity: Having comparably high performance for all groups
of learners when academic achievement data are disaggregated and analyzed.
o Opportunity to Learn Equity: Equal access to a rigorous curriculum for all
students.
o Resource Distribution Equity: Equal distribution of funds and human
resources to all schools and students who populate those schools
o Treatment Equity: The belief and expectation that literally all students can
Significance
Many people, including educators, still believe that factors such as genetic
deficiency, class differences, families and access to learning opportunities at home are the most reliable predictors of school achievement. With this view, schools excuse
themselves from any accountability for inequities among student subgroups. However, with this study of schools that teach similar populations of students from the same geographical region, it is impossible to ignore the reality that the school plays an
important role in the achievement of all students. This study gives leaders data to support the notion that the school plays a significant role in the achievement of students. More importantly, educational leaders who read this study will learn strategies that will facilitate excellence and equity from the principals who lead the most equitable schools in this district.
II. REVIEW OF THE LITERATURE AND CONCEPTUAL FRAMEWORK Introduction
Efforts to provide an equal education for racially and economically diverse students can be traced back to 1849 when an African-American father sued the city of Boston for mandating that his child walk beyond a White school to attend a school established for Blacks only. In Roberts v. City of Boston (1849), the court concluded that the school committee was within its power to separate the White and Black students, especially if the education was equal (Gooden, 2004). Gooden points out that the struggle to achieve equality in education gained national prominence in 1954 with the landmark court case of Brown v. Board of Education of Topeka, Kansas.
Since Brown, authors such as Edmonds (1979) have documented schools that do provide an equal education to students regardless of their race or family’s socioeconomic status. Edmonds noted that student performance did not derive from family background, but rather it derived from the school’s response to family background. While this
discussion of providing an equitable education for all students has continued for well over a century, our current educational system remains inequitable.
Our current discussions of equity in education are centered around the No Child Left Behind Act of 2001 (NCLB) that was signed by President Bush on January 8, 2002. The stated purpose of this law is to close “the achievement gap between high- and low-performing children, especially the achievement gaps between minority and non-minority students, and between [economically] disadvantaged children and their more
p.1). NCLB defines non-minority students as White students and divides minority students into the following subgroups: African-American, Hispanic, and Native-
American students. To remain consistent with the terms defined by NCLB, the literature refers to subgroups of students such as African-American, Hispanic, White, economically disadvantaged, and non-economically disadvantaged. It is important to recognize that an achievement gap exists between these subgroups of students; this does not mean, for example, that all African-American or Hispanic students are low-achieving compared to their White counterparts. Although the manner in which the discussion of equity is framed has changed over time, our schools have not. They remain systemically inequitable.
The following review of the literature describes the current research on the three components of Systemic Equity: (a) Achievement Equity; (b) Programmatic Equity; and (c) Teacher Quality Equity. After broadly discussing these three components, the review moves into the literature on the role leadership plays in creating schools that are
systemically equitable. Specifically, the authors review the literature on characteristics of leaders for social justice, equity, and excellence. The conceptual framework of Academic Optimism is then described in detail.
Systemic Equity
This persistent inequity has prompted Skrla, Scheurich, Johnson, and Koschoreck (2001) to conclude, “… the fact that, broadly speaking, our children experience
research that centers around systemic equity (Scott, 2001). Scott defines systemic equity as:
The transformed ways in which systems and individuals habitually operate to ensure that every learner—in whatever learning environment that learner is found—has the greatest opportunity to learn enhanced by the resources and supports necessary to achieve competence, excellence, independence responsibility, and self-sufficiency for school and for life. (p.2)
The literature review is based on Scott’s four components of systemic equity: (a)
achievement equity; (b) opportunity to learn equity; (c) resource distribution equity; and (d) treatment equity. The researchers have combined Scott’s four components into three sections titled: (a) Achievement Equity; (b) Programmatic Equity; and (c) Teacher Quality Equity. The review begins with achievement equity and evidence that it is possible to create schools that are excellent and equitable. Next, the literature on programmatic equity is presented and specifically addresses students in special and academically gifted programs, inequities in the disciplining of students as well as offering a rigorous curriculum for all students. The following section addresses teacher quality equity and includes sections on teacher certification, years of experience, National Board Certification, and teacher quality formulas.
Achievement Equity
Introduction
According to Scott (2001), achievement equity means having comparably high performance for all groups of learners when academic achievement data are
In answer to his own question, how many schools one would have to see in order to be persuaded of the educability of poor children, Edmonds (1979) answered, “If your answer is more than one, then I submit that you have reasons of your own for preferring to believe that basic pupil performance derives from family background instead of school response to family background” (p.23). Unfortunately, many educators still believe, despite overwhelming evidence to the contrary, that the school system cannot impact student achievement as much as family background. However, researchers have found schools that are both excellent and equitable (Comer, 1994; Ladson-Billings, 1994; Reyes, Scribner, & Scribner, 1999; Skrla & Scheurich, 2001).
Exemplars of Achievement Equity
In a study of high-performing, high-poverty elementary schools, Johnson and Asera (1999) found nine schools that were excellent schools. One school in their study was 100% African-American, with 87% of the students receiving subsidized lunches, experienced a rapid growth in test scores over a short period of time. For example, fourth grade students passed the state’s reading test at a rate of only 22.4% in the spring of 1994. However, in the spring of 1998, fourth grade students passed the test at a rate of 65%. This was better than the state average of 58.6%. Although the success of the nine schools in the study was similar, Johnson and Asera reported that the methods by which each school achieved success were varied.
classes. The schools compare favorably with schools that serve mostly students from middle class surroundings. Perhaps the most significant finding is that “the distribution of achievement is becoming more equitable” (p.74). Although these schools were part of the Comer Process and the School Development Program where they were reformed using particular strategies and resources, that does not discount them as exemplars of the fact that all students, regardless of their background, can (and should) achieve academically.
In a study of school districts, Skrla, Scheurich, Johnson, and Koschoreck (2001) found evidence of entire districts that were successful with all students. One district in their study, with an African-American population of 36% and a Latino population of 47%, raised test scores for both subgroups of students from 45% to 76% passing and 56% to 81% passing respectively. With evidence of highly successful schools that serve large groups of economically disadvantaged and minority students, it seems impossible to ignore the role that schools play in student achievement.
In their study of five high performing, high poverty schools, Ragland, Clubine, Constable, and Smith (2002), studied five elementary schools that had at least 60% of their students receiving subsidized lunches. Two of the five schools had 92% of their students receiving subsidized lunches. All five of these schools received Exemplary or Recognized status, which means 80% of all subgroups of students passed the reading, writing, and math sections of the Texas Assessment of Academic Skills.
HiPass Model
environment and strong academic success for low-SES students of color” (p.452). This grassroots model, developed and implemented by school-level administrators, is known as HiPass (High Performance All Student Success Schools). Scheurich documents the importance of five core beliefs and seven cultural characteristics that are common to each of the identified (HiPass) schools and attributes each to the vision, commitment and practice of the school leader. The five core beliefs include: (1) All Children Can Succeed; (2) Children or Learner Centered Schools; (3) All Children Must Be Treated With Love, Care Appreciation and Respect; (4) The Racial Culture, Including the First Language of the Child is Always Valued; and (5) The School Exists for and Serves the Community, and the seven cultural characteristics are: (1) A Strong, Shared Vision; (2) Loving, Caring Environments for Children and Adults; (3) Strongly Collaborative – We Are a Family; (4) Innovative, Experimental, Openness to New Ideas; (5) Hardworking but Not Burning Out; (6) Appropriate Conduct is Built Into the Organizational Culture and (7) School Staff as a Whole Hold Themselves Accountable for the Success of All Children. The principals included in the study each stated that these core beliefs and cultural characteristics serve as a prerequisite for high achievement. According to Scheurich, these principals, while retaining 80% to 90% of teachers, transformed these schools within about a 3- to 5- year period into schools that were academically competitive with some of the higher performing schools in the state. One high school principal, for
measured solely by student scores on standardized tests; HiPass is an embodiment of the espoused and enacted beliefs and values of the schools’ leaders. Under the leadership of these principals, the HiPass schools are “highly collaborative and democratic, with all participants, including parents, empowered; they do not treat the student as a passive consumer of knowledge; and they deeply value the racial culture and language of the child” (p.455).
Effective Schools Research
The quest for more effective forms of schooling has traditionally been synonymous with the quest for greater educational equity across racial and
socioeconomic levels. Beginning with the Coleman Report of the mid-1960s (Coleman, 1966), the past 40 years have witnessed a growing number of research studies aimed at reducing the gap in quality between the school experiences of economically
leadership practices that are critical to enhanced student achievement and school
productivity, regardless of family background. These unique characteristics and processes within the purview of schools are correlated with high and equitable levels of student learning.
Summarizing these findings, Odden and Odden (1995) noted that effective teachers maximize instruction time; are well prepared; maintain a smooth and steady instructional pace (especially during the first few weeks of school); focus on academic learning; and emphasize student mastery of material. With regard to organizational characteristics, effective schools evidence strong instructional leadership, usually provided by the principal; consensus on academically focused school goals; realistic but high expectations for student learning; regularized monitoring of progress toward academic goals; ongoing staff development; and an orderly and secure environment (Odden & Odden, 1995).
School Climate and Community
Other studies found similar characteristics of a school’s climate associated with improved student learning. For example, in 1988, Bryk and Driscoll expanded the notion of school commonality, arguing that "communally organized" schools evidence: (1) a consensus over beliefs and values; (2) a "common agenda" of course work, activities, ceremonies, and traditions; and (3) an ethic of caring that pervades the relationships of student and adult school members. On the basis of analyses of a national sample of schools and students, Bryk and Driscoll found that schools with higher levels of
and teachers), and higher levels of student achievement. Shouse’s (1996) follow-up study separately examined the achievement effects of commonality (measured along lines similar to those of Bryk and Driscoll's study) and "academic press" (measured in terms of an assortment of survey items reflecting school academic climate, disciplinary climate, and teachers' instructional behavior and emphasis). The findings revealed that academic effectiveness among low-SES schools was significantly tied to academic press and to an integrated culture of academic press and commonality. Achievement in low-SES schools having high levels of both academic press and commonality rivaled that of schools serving more affluent students. Conversely, the least academically effective low-SES schools were those that combined strong commonality and weak academic press. Although these findings reveal the tensions between meeting students' social and
academic needs, they also reveal the tremendous potential of school social networks that are supportive, cohesive, and academically oriented to greatly enhance the quality of educational experiences for disadvantaged students (Shouse, 1996).
School Restructuring
student assessment; and (3) reducing school size, typically through the creation of "schools within schools.” Research evidence links the collective adoption of these areas with significant gains in high school achievement. A study by Lee and Smith (1994), for example, contrasted achievement gains in three types of school: (a) those with no reform or restructuring; (b) those that had sought to improve on their traditional, more
bureaucratic practices; and (c) those that had engaged in some level of organizational restructuring. Although students in traditionally oriented schools that were seeking improvement outgained those in non-reform schools, students in restructured schools (those having adopted at least three out of 12 restructuring practices) significantly outgained those in both other types of schools. More important, the achievement gap between more economically advantaged students and less economically advantaged students was narrowest within restructured schools.
Also significant, the collective involvement of teachers appears to be a key to effective school restructuring. Researchers found that school effectiveness and student learning were enhanced when schools took on the qualities of "professional
deprivatization of practice, and collaborative efforts all enhance shared understandings and strengthen relationships within a school. Barth (1990) added that a “good school … is a place where everyone is teaching and everyone is learning—simultaneously, under the same roof” (p.163). He writes that the adults enter into a collaborative relationship and create an “ecology of reflection, growth, and refinement of practice” (p.162). Such communities of teachers, administrators, and parents promote purposeful and
collaborative classrooms to improve instruction, create a climate of care, and use accountability to continuously scan for inequities across multiple domains of student learning and activities.
In recent years, a revival of effective schools research has surfaced, most likely due to widespread national concerns about student achievement. Such research has
the students first to improve students learning; (2) strong building leadership; (3) strong teacher collaboration; (4) focus on professional development and innovation; (5)
consistent use of student performance data to improve learning; and (6) strong links to parents. Such research stresses the importance of educators (teachers and principals) learning and changing together over an extended period of time, as they reflect on their practice and implement new teaching strategies (Fullan & Hargreaves, 1996).
While the effective schools movement has been influential among researchers, educators, and policymakers, questions persist regarding its various recommendations, particularly the direction of causal effect. In other words, although certain characteristics might produce higher-achieving students, the reverse might also be the case. That is, schools may maintain these characteristics because they are fortunate enough to have greater numbers of high-achieving students. That some schools identified as effective at one point in time were found not to be so a few years later might, for example, suggest the latter possibility. Thus, although "effective schools" clearly share important practices, it has never been consistently established that ineffective schools could become more effective by adopting these features. Still unattained and perplexing is the crucial research goal of establishing a reliable set of techniques for transforming ineffective schools into effective ones. As such, the next section emphasizes the critical role of programmatic equity as a vehicle for attaining systemic equity.
a reality and spent the majority of their time focusing on strategies to help all students be successful. Perhaps the most prevailing theme that arose from all of these studies was that of a collaborative environment. Educators at these schools worked together to ensure the success of all students. If schools that serve high populations of minority students and poor students are highly successful, one cannot argue that a student’s background is the sole predictor of school-achievement. It becomes the duty of educators then to create schools that are equitable and serve literally each child well (Scheurich & Skrla, 2003). The next section reviews the literature on equity as it relates equal access to educational programs. It is divided into three sections: (a) Students in special and academically gifted programs; (b) Inequities in discipline; and (c) Access to a rigorous curriculum.
Programmatic Equity
Students in Special and Academically Gifted Programs
The two largest programs that schools offer to students include special education and academically gifted education. Both programs tend to label and exclude students in different ways. Special education has historically excluded students in a negative way by grouping struggling students together, excluding them from their non-disabled peers, and giving them limited access to the regular and advanced curriculum. In contrast, students who are selected for academically gifted education have had a more positive experience being grouped with other students of high ability and given access to the most advanced curriculum. In terms of programmatic equity, it is essential that all students be equally represented in both of these programs.
gifted classes (Donovan & Cross, 2002; Ford, 1998; Ford & Harris, 1999; Obiakor, 2007; Patton, 1998; U.S. Department of Education, 2001). For example, according to a 2001 U.S. Department of Education report, White students make up 67% of the general population but only 43% of the special education population. While White students are under-represented, African-American and Hispanic students are over-represented. African-American students make up 16% of the general education population but that percentage climbs to 20% of the special education population. The numbers for Hispanic students are more inequitable with Hispanics making up only 4% of the general education population but 14% of the special education population.
Donovan and Cross (2002) further illustrate these inequities in their analysis of data taken from a 1998 Civil Rights Compliance report. Donovan and Cross found that African-American students were more than twice as likely to be identified as mentally retarded than their White and Hispanic peers. Inequities in the identification of students as emotionally disabled also existed. The percentages were approximately 1/2, 1, and 1.5 for Hispanic, White, and African-American students respectively. If the system were equitable, enrollment numbers for general education and special education would be equal.
Donovan and Cross (2002) also found inequities in the percentage of students in academically gifted programs. While 6.2% of the overall student population is identified as academically gifted, White students are over-represented at 7.47%, and African-American (3.04%) and Hispanic students (3.57%) are under-represented in the academically gifted population. This disproportionate representation has led to
standards, while students in special education classes are held to much lower standards. Logically, this contributes to inequity in schools. However, it is not necessarily the intelligence of the students that places them in academically gifted education or special education.
Davis and Rimm (1997) report that 90% of schools continue to use intelligence or achievement tests as the sole measure of “giftedness.” Since these tests can be culturally biased, fewer African-American students are selected for gifted programs. Another reason for the disproportionately low numbers of African-American students in
academically gifted programs is the teacher referral practice. Ford (1996) found that even African-American students who had high test scores were not referred for screening. Since the teacher is often the only referral point, this severely limits the number of African-American students being referred for academically gifted programs.
In order to increase the number of students in academically gifted programs, Harris, Brown, Ford, and Richardson (2004) recommend two critical changes. First, the authors recommend using a more culturally sensitive instrument by which to identify students. Tests such as the Naglieri Non-Verbal Abilities Test and Raven’s Matrix Analogies Tests, are considered to be less culturally biased than traditional tests like the Wechsler Intelligence Scale for Children-Revised (WISC-R). The authors also
recommend greater multi-cultural preparation for all school personnel. As teachers learn to implement multicultural strategies, all minority students will have a greater
Although curricular opportunities are limited in the special education classroom and abundant in academically gifted classrooms, the opportunities within regular education classrooms are also inequitable. The next session will focus on the literature surrounding inequities in discipline.
Discipline
In response to recent acts of violence in schools, many schools and systems have become focused on creating a safe and orderly school culture. One example is the implementation of zero-tolerance policies. Verdugo (2002) contends that such policies, however, have a profound implication in our schools, especially with regard to race and social class relations. It is also noted that zero-tolerance policies are more prevalent in minority and poor communities. In fact, little research exists to support the
implementation of these policies. Although these policies are implemented with the intention of creating a safer learning community, Verdugo concludes that zero-tolerance policies result in an overwhelmingly disproportionate number of minority suspensions and seemingly appear to be “inequitably directed at ethnic/racial minority students” (p.59). In addition to the disproportionate number of minority suspensions, this study also revealed that minority students are suspended for ambiguous reasons such as threatening appearance or disrespect, whereas White students are suspended for clear violations such as guns, weapons, or drugs. Verdugo concludes his study by calling for more equitable, culturally responsive, and child-centered ways of achieving safety in our schools.
Scheurich, Skrla, Garcia, and Nolly (2005), conducted a study in 2001-2002 to analyze discipline referrals in a small-town high school of 1,300 students. It was
proportional representation in the student population and that for Latino males the rate was nearly four times disproportionate. As the authors point out, this school, like many others nation-wide, is characterized by a glaring inequity with regard to student
discipline.
Watts and Erevelles (2004) argue that school violence stems from socially unjust social conditions that perpetuate individual blame rather than address the inequitable social context of our schools that are rooted in oppressive beliefs and practices. The authors contend that the social context of our schools “normalize structural violence in the daily lives of oppressed peoples” (p.294). We must, according to the authors, address the system, rather than place blame on individuals who are merely victims of an
oppressive social context. Watts and Erevelles call for schools to “define alternative modes of practice that will enable both students and their communities to advocate for social transformation and social justice” (p.294).
Scheurich and Skrla (2003) promote the use of equity audits to ensure systemic equity within schools. This process involves gathering and analyzing data to identify inequities that serve as barriers to academic achievement. Equity audits can be
implemented to address issues of discipline and identification for services such as special and gifted education. With regard to discipline, Skrla and Scheurich (2001) conducted a number of studies highlighting a disproportionate number of referrals for minority students and argue that rather than blame the students for their behavior, we must seek to understand our minority students’ cultures and must acknowledge that
Students who spend less time learning in the classroom are not afforded an equitable opportunity to learn.
Another important aspect of programmatic equity is the availability and access to a rigorous curriculum. In other words, it is essential that all students, regardless of their NCLB sub-group, have equal opportunities to learn.
Rigorous Curriculum for All Students
Our country has a history of tracking students by perceived ability. These practices have resulted in the racial and socioeconomic segregation of students (Oakes, 1985). In other words, the majority of students identified in the NCLB subgroups of African-American, Hispanic, and economically disadvantaged have been
disproportionately represented in the lower track classes where they cannot access
higher-level courses. This has helped create inequity in schools. This inequity is reflected in racially separate programs that provide minority children with restricted educational opportunities and outcomes (Oakes, 1995). Recent research indicates that as schools enroll more students in rigorous courses, the percentage of students passing state exams and entering college will increase (Gamoran & Hannigan, 2000; Luce & Thompson, 2005). Although definitions of academic rigor vary, for the purpose of this study, academic rigor will be defined as the most challenging courses a school has to offer. Specifically, this usually means honors and advanced placement courses.
According to a 1997 report published by the North Carolina Manpower
developed a project entitled, Alliance for Achievement. The Alliance project is an effort to improve the academic preparation of all students. The report describes a Louisville middle school where only 2% of its students were achieving “proficient” or
“distinguished” on state math tests in 1992. At the same time, only 25% of eighth graders studied algebra. By 1995, all of the eighth grade students studied algebra. As a result of providing access to a rigorous curriculum for all students, the percentage of students scoring “proficient” or “distinguished” increased from 2% to 18%.
Stone High School, located in Stone County Mississippi, experienced similar results when a team decided to allow most of its students to enroll in Algebra in eighth grade. In the same previously mentioned report, the MDC (1997) found that the number of students scoring in the top two quartiles of state math tests increased from 52% in 1992 to 77% in 1995 for White students and from 22% to 62% for African-American students. These increases in test scores corresponded with the increase in access to rigorous courses. This finding is particularly significant in that gains achieved by African-American students doubled that of their White peers. If schools are looking to reduce the achievement gap and provide a more equitable education, providing all students with access to rigorous curriculum appears to be a useful strategy.
Basic range. However, students who did not take algebra scored a mean of 141—two points below the Basic level.
Although much of the research on the effects of rigorous courses is measured by math achievement, Carbonaro and Gamoran (2002) found improvements in English achievement data as well. Using the National Longitudinal Survey of 1988 (NELS), the authors looked at over 8,000 students in various academic tracks named general,
academic and honors. They found that, “students who have more intellectually
challenging content in their English classes tend to have higher levels of achievement” (p.819).
Recent reform literature (Anfara & Waks, 2000) focuses on the need for increasing academic rigor in the middle schools. A 1998 article in Education Week
Turning Points 2000 emphasizes the untracking of students. The book cites numerous studies that point to repeated overrepresentation of minority and economically disadvantaged students in lower tracks. As Oakes (1995) has found, this
overrepresentation is flawed. Even when students of varying ethnic backgrounds score the same on placement tests, minority students are less likely to be placed in higher-track classes. Specifically, Oakes found that while only 56 percent of Latinos scoring between 90 and 99 on placement exams were placed in accelerated classes, 93 percent of White students gained admission to these classes. Jackson and Davis (2000) also cite research that instruction in the low track classes is far from excellent and causes gaps in
achievement between the two groups to widen. However, schools that implement
Turning Points seem to diminish these achievement gaps. Felner and Jackson (1997) studied 93 schools and over 15,000 students who attended schools that implemented the
Turning Points recommendations. When analyzing achievement test scores for schools with “full implementation,” the authors found scores of 298, 315, and 275 on
mathematics, language, and reading tests. These scores compared favorably with students from non-implemented schools, who earned scores of 248, 254, and 247 on the same tests.
Teacher Quality Equity
Research has shown that teacher quality is a strong predictor of student
achievement. This data should be encouraging in terms of improving systemic equity in our nation’s public schools. If stronger teachers taught students who have been
historically marginalized by our public schools (e.g., minority students and students living in poverty) then the achievement of those students should increase. The research tends to view stronger teachers as those who are traditionally and fully certified,
experienced, and score higher on teacher quality formulas. Alarmingly, however, recent research has indicated that less competent teachers are more likely to teach minority students and students living in poverty (Borman & Kimball, 2005; Lankford, Loeb, & Wyckoff, 2002; Shen, Mansberger, & Yang, 2004). The following section reviews the extent to which different indicators of teacher quality impact student achievement, as well as the distribution of quality teachers to students of varying characteristics. The indicators include certification, years of experience, National Board Certification, teacher quality formulas, and other related studies.
Certification
of under-certified teachers are typically higher in impoverished and urban schools (Go, 2002; Lankford, Loeb and Wycoff, 2002). As a result, students who have historically underachieved have the least access to certified teachers.
Goldhaber and Brewer (2000), using data from the National Educational Longitudinal Study of 1988, found that the certification status of teachers impacted achievement in 12th grade math scores. The mean score for students who were taught by a traditionally certified teacher was 51.52 compared to only 41.93 for students of
probationally-certified teachers and 43.74 for students with emergency-certified teachers. Felter (2001) also found that students who were taught by teachers with
emergency certification scored lower on standardized tests. Felter analyzed student data (approximately 300,000 students in grades 9-11) from California’s Stanford 9 Math Achievement Test. The data showed a statistically significant negative correlation between teachers with emergency certifications and lower student test scores. Felter’s findings are consistent with the other studies regarding teacher certification and emphasize the findings that students who are taught be fully-certified teachers out perform students who are not. An underlying reason behind the success of traditionally-certified teachers is the emphasis of content specific course work. In California, as in many other states, one can earn an emergency certification as few as nine content-specific graduate hours. A traditionally-certified teacher will earn many more credits in addition to receiving specific pedagogical training.
Arizona (with requirements similar to that of California). The study included 293 certified and under-certified teachers from five low-income districts in Arizona. After comparing students’ scores on the SAT 9, Lazco-Kerr and Berliner found that students of certified teachers significantly outperformed students of under-certified teachers. As an example, the mean score of the reading section of the SAT 9 for students of certified teachers was 36.52, in comparison to 30.67 for students of under-certified teachers. While the mean difference in math scores was not statistically significant, it followed a similar trend with students of certified teachers outperforming students of under-certified
teachers (38.8 v. 35.82). It is important to note that the study was replicated the following year. In addition to finding similar results, the researchers also found the scores on the math section to be statistically significant. As Fuller and Alexander (2004) concluded, the data are similar for non-certified teachers.
Fuller and Alexander (2004) performed multiple regressions on data from four Texas districts (including 578,123 students). The researchers found that students with certified teachers performed better than students who were taught by non-certified teachers on the 1999 TAAS (Texas’ standardized math test).
Analyzing 1998 data from the National Center for Education Statistics, Croninger et. al. (2007) found a statistically significant positive correlation (.078) between a
teacher’s type of degree and students’ cognitive reading achievement score. Specifically, the researchers found that the students of teachers who held an elementary degree
outperformed other students. Although this finding does not specifically address
However, students in poverty tend to be exposed to more uncertified teachers than the rest of the student population. Using data from the Baccalaureate and Beyond
Longitudinal Study 1993-1997, Shen, Mansberger and Yang (2004) found that in schools where 20-49% of the students were living in poverty, only 8.5% of the teachers were non-certified. However, the number nearly doubles to 16.9% when over 50% of the students attending the school live in poverty.
Knoeppel (2007) also found inequities in teacher resource distribution. Even after the state of Kentucky reformed their finance system to focus on vertical equity, “the least experienced teachers with the least training are found in schools with greater student need” (p.437).
Years of Experience
Research indicates that novice teachers are less effective than experienced teachers (Felter, 2001; Hanushek, Kain, O’brien, & Rivkin, 2005; Clotfelter, Ladd, and Vigdor, 2006; Croninger et. al., 2007). In a previously mentioned article, Felter (2001) studied the impact of teachers’ years of experience in addition to certification. Felter analyzed the impact that years of experience has on mathematics achievement as well as student dropout rates. Using data from the Stanford Nine, Felter found a positive
correlation (.36-.39 depending on the grade level) between test scores and years of experience. That is, more experienced teachers had higher passing rates on standardized tests than less experienced teachers.
that years of teaching experience had a stronger correlation (.20) than the poverty level of the student (.13), a reminder that the school system’s response to family background is more powerful than the background alone.
For example, Clotfelter, Ladd, and Vigdor (2006) found that highly experienced teachers increase student achievement in math by close to a tenth of a standard deviation when compared to novice teachers. With half of the achievement effect being attributable to teachers in their first few years, the authors conclude, “Regardless of how effective (first year teachers) may eventually become, during their first year of teaching they are clearly less effective than more experienced teachers” (p.18).
Results achieved in a study by Hanushek, Kain, O’brien, and Rivkin (2005) were similar to Clotfelter, Ladd, and Vigdor (2006). Using teacher data from the Texas
Schools Microdata Panel data from 1989-2002 and student data from the Texas
Assessment of Academic Skills, Hanushek et. al. found that a new teacher lowers student achievement growth by .12-.16 standard deviations. The authors’ findings are significant when coupled with the fact that African-American students are more likely than their White peers to encounter first-year teachers. Using 2001 data from 7th grade teachers across North Carolina, Clotfelter, Ladd and Vigdor (2005) found that African-American students were 54% more likely to have a novice math teacher than their white peers. The authors also found that African-American 7th grade students across North Carolina were 38% more likely to have a novice English teacher.
National Board Certified Teachers
find only four studies (Bond, Smith, Baker, & Hattie, 2000; Cavalluzzo, 2004; Stone, 2002; & Vandevoort, Amrein-Beardsley, & Berliner, 2004) that investigate the effectiveness of NBCTs in comparison to non-NBCTs.
Stone (2002) studied the 16 of Tennessee’s 40 NBCTs who had value-added teacher reports. A value-added teacher report is a summary of annual achievement gains exhibited by each teacher’s students. Student achievement is estimated on the basis of how much students gain in comparison to their achievement increases in previous years. Stone defined exceptional teaching as that which brings about an improvement in student achievement equal to 115% of one year’s academic growth in the local school system (Stone). When taken collectively, the 16 teachers received 123 teacher-effect scores as a result of multiple subjects taught over multiple years. Only 18 of these scores, or 15%, reach the exemplary level and 13 of the scores would be designated as “deficient.” In summary, Stone’s study did not find that NBCTs had a positive impact on student achievement.
study all entered at the same ability level. The absence of the data calls into question the validity of the study, especially since other studies have already indicated that higher performing students tend to be assigned to NBCTs more than lower performing students.
Cavalluzzo (2004) also found that students with NBCTs outperformed students who did not have NBCTs. Using data that included 108,000 individual student records from the Miami-Dade County Public Schools, Cavalluzzo’s results indicated that students with NBCTs “gained 12 percent of a standard deviation more than others on the end-of-grade exam in mathematics, all else equal” (p.25). However, to the author’s own acknowledgement, all else is not equal. The students in Cavalluzzo’s study are not distributed equitably among teachers. She found that NBCTs were less likely to teach students who receive subsidized lunches, were minority, had attendance problems, and were suspended throughout the year. These are all characteristics of students who have historically underperformed in schools. This is a significant limitation, since it is unclear whether the gains these students are making are a result of the certification status of their teachers or other factors. It is also important to note that Cavalluzzo’s study was funded by the National Board for Professional Teaching Standards.
Vandevoort, Amrein-Beardsley, and Berliner (2004) studied 35 NBCTs from 14 Arizona school districts. They analyzed four years of results from the Stanford
67% of the comparisons, no statistically significant difference between NBCTs and non-NBCTs was found. Another limitation includes the small sample size of the study. The authors only included 35 of the 80 available NBCTs in the 14 Arizona school districts.
To date, Goldhaber and Anthony (2005) present the most comprehensive study of the effectiveness of NBCTs. Using teacher records from the North Carolina Department of Public Instruction from the years 1996-1999, the sample included 390,449 students and over 300 NBCTs. The authors found that while the NBCT process is successful in identifying effective teachers, the process itself does not increase teacher effectiveness. Related to systemic equity, Goldhaber and Anthony found, “that schools with NBCTs receive substantially more educational benefits from having their NBCTs teach low-income students in earlier grades” (p.26). Cavalluzzo (2004) reported a similar finding in her study in Miami-Dade. However, within North Carolina schools, Clotfelter, Ladd, and Vigdor (2006) found the more privileged students (defined by the authors as not
receiving subsidized lunches and whose parents are college graduates) have more access to Nationally Board Certified teachers than less-privileged students.
Teacher Quality Formulas
Characteristics of good teachers, such as certification, years of experience, National Board Certification and type of degree earned, are all important factors when attempting to quantify good teaching. Additional research has been done that attempts to combine these qualities into one teacher quality variable.