Corresponding Author: Manssour A. Abdulsalam Bin Miskeen, Department of Civil and Structural Engineering, Faculty of Engineering, University Kebangsaan, Malaysia, 43600 UKM Bangi, Selangor Darul Ehsan,
Evaluate the Service Quality of Local Airline Companies in Libya Using
Importance-Satisfaction Analysis
1
Manssour A. Abdulsalam Bin Miskeen,
2Ahmed Mohamed Alhodairi and
1Riza Atiq Abdullah
Bin O.K. Rahmat
1
Department of Civil and Structural Engineering, Faculty of Engineering, National University of
Malaysia, 43600 UKM Bangi, Selangor Darul Ehsan, Malaysia.
2
Department of Architecture and Urban Planning, Faculty of Engineering, Sabha University, Libya
P.O.Box: 68 Brack – Alshatti; Libya
Abstract: It is essential for the airlines to deliver high quality service to passengers in order to compete in the market. Generally competitive advantage of airlines is impacted by service quality conditions, which results in market share, and profitability. In this context, this study has been conducted in Libya, for the purpose of determining the level of satisfaction to facilitate an airline and airport management to fully recognize the deficiencies of their service quality. This study, which is the first of its kind in Libya, has investigated the customer satisfaction with the service delivery of the domestic airline. For this purpose, the questionnaire was personally administered to the target population of domestic air travelers within Libya. A stratified sampling procedure has been used for this research; therefore, the final research sample consisted of 312 participants. The investigation has revealed that, the level of customer satisfaction is moderate, which clearly indicates that there is a mismatch between the airline service quality and the expectations of customers. Ultimately, this study proposes that, policy-makers and airline management should take practical actions to enhance the service quality of the airline. Nevertheless, it is vital for air service providers to understand the significance of customer satisfaction; as such satisfaction may be the foundation for successfully running business in Libya. Moreover, it is crucial to minimize or avoid customer defection to alternative transport modes.
Key words: Importance-satisfaction Analysis, Customer Satisfaction Index, Airline Service, Service Quality, Enhancing Passenger satisfaction.
INTRODUCTION
Of late, Libya is facing an explosive growth in vehicle ownership and utilization, which leads to traffic accidents, congestion and pollution. Therefore, government policy encourages people, to use safer mode of intercity transportation. However, most of the Libyans prefer to use private vehicles due to the bad quality of services offered by public transports. In this regard, intercity transport operators, especially airlines are forced to emphasise to monitor and improve the services provided. This study focuses on passengers satisfaction in terms of air transport based on service quality attributes.
Intercity transportation in Libya has been dominated by automobiles since the 1960s, however, air service is ranks second, and is turning out t be a significant aspect in the frontiers, where the traffic is heavy enough to require frequent service (Ministry of Transportation in Libya, 2012). Presently, there are three competing airlines in the domestic market of Libya such as: the Libyan Airline, Afriqiyah Airways and Buraq Air provide international and domestic services.
Source: Public Administration of Traffic, 2010.
Fig. 1: Registered cars and road fatalities in Libya (2001-2010)
Therefore, this is the right time to demand a policy, which will improve intercity transport, especially air transport, and vehicle ownership regulations. The Libyan government has conducted several studies to overcome these problems (Manssour and Riza 2011, 2012 and Manssour et al., 2012). Moreover, the government policy encourages people to use other mode of intercity transportation, instead of their private car for reduction of traffic accident, congestion and air pollution (Manssour et al., 2013 a, b, c). Customer satisfaction is one of the most important influential factors in airline industry, and is recognized as a key to the success of business competition. Customer satisfaction is the individual’s perception of the performance of the service in relation to expectations. Customers have substantially diverse expectations; therefore all the airliners thrive hard to maximize customer satisfaction for the purpose of sustaining their business. Nevertheless, they have comprehended the necessity of satisfying customers, to retain existing customers and to gain new ones, hence they have started to initiate many projects to measure service quality and satisfy the customers by improving service quality.
Air transport is considered a vital global industry, due to its fast and efficient development, and technical achievements, which makes it one of the most important industries in the progress of modern civilization. Air transport plays a vital role in moving people or products from one domestic or international location to another, and has become the most important segment in the economic development of a nation. Service quality can be described as a general perception of consumers towards the relative effectiveness and services of an organization. It is very important to understand the exact expectations of customers for defining and delivering high-quality service. Service quality is one of the best models for evaluating expectations and perceptions of customers. The performance of a company, leads to satisfaction of the customers towards its product or service. Passenger satisfaction is essential to the practice of consumer authority. Recently many researchers have stressed that, customer satisfaction have become an important aspect for marketing practitioners because of the rapid business environment. According many scholars and practitioners, customer satisfaction is determined by the experiences of a customer on the quality of a service (Swan & Combs, 1976; Westbrook & Reilly, 1983; Parasuraman et al., 1988; Oliver, 1993; Sultan & Simpson, 2000; Gronroos, 2000; Parker & Mathews, 2001; Kotler & Keller, 2006). In general, it is accepted by academicians that, service quality primarily relates to the perception of the product/service by customers. Several empirical studies have found that, customer satisfaction is not only influenced by cognizance of customer perception towards service quality, but also by visceral dimensions, which impacts the post-purchase behavior as well as expectation.
Giving good quality service to passengers is significant, so that airlines could strengthen and overcome their competitiveness. Service quality level determines an airline’s competitive advantage, which results in market shares, and finally leads to profitability (Morash & Ozment, 1994). Satisfaction can be explained as an attitudinal judgment, made after a service is being offered, or a series of customers’ product dealings. Majorities of the studies depend on the concept that, affirmation or rejection of perceived opportunity or what is expected from the service, is one of the crucial influential factors in that determine satisfaction. This connotes that consumers might have a particular service quality in mind previous to consumption (i.e expectations), furthermore they scrutinize the service effectiveness and relate it to their standards, from there they come up with satisfaction conclusions, according to the comparison made. The outcome judgment will be tagged as negative confirmation, in case the service received is poorer than expected, and it will be labeled as positive confirmation, in case the service offered is superior to what is expected; this is just confirming what is expected (Lovelock and Wirtz, 2007).
Customer satisfaction in airline operations has become critically important (Clemes et al., 2008). In this context airlines have started to offer various incentives e.g. brochures, competitive prices and computerized reservation system with purpose of creating customer loyalty (Clemes et al., 2008). According to Ostrowski et al. (1993) if all airlines become similar in terms of incentives, the company with better perceived service will capture passenger from other airlines. Chang and Yeh (2002) have argued that, quality in airline service is difficult to describe and measure, due to its divergence, intangibility, and coherence, and it is only possible for the customer to truly define service quality in airline industries (Butler and Keller, 1992). Fundamentally, airline industry has to essentially understand the needs passengers, to provide the desired service quality (Gilbert & Wong, 2003), and consequently to understand its performance levels (Chen & Chang, 2005). Customer satisfaction in airline operations has become critically important; and Dennett, Ineson, Stone, and Colgate (2000) have suggested that, as competition created by free trades have become more intense, and service quality in the airline industry has also received more attention.
Yu-Kai Huang (2009) has attempted to enhance the how air passengers understand their personal decision-making processes through testing a conceptual framework based on airline service quality, service value, perceived sacrifice, satisfaction, as well as behavioral intentions. They have applied two modeling approaches such as: the importance-performance analysis (IPA) and the structural equation modeling (SEM). Based on the Structural Equation Modeling the service value has been identified as the main predictor that can affect the behavioral intention, whereas, the outcome of IPA have indicated that, responsiveness or sensitiveness to the consumers need is seen as the most significant airline service quality that is expected by the consumers.
Archana and Subha (2012) have examined the underlying forces of service quality influences on passengers’ satisfaction in aircraft transport. They have assessed the factors that have a positive influence on service quality, and the factors that have the maximal and minimal impact on service quality in international air travel, as perceived by airline passengers. The results have suggested that, quite a number of factors of in-flight service quality are important, according to the customer seat classes. They have also explored the dimensionality of perceived service quality in international air travel and have identified three dimensions, such as, in-flight service, in-flight digital service and back-office operations. The findings have revealed that, these three dimensions are positively related to perceived service quality in international air travel; in terms of in-flight service quality , cuisines provided, seat comfort safety are the most important dimensions. Personal entertainment is the most important dimension in, In-flight digital service quality. Online ticket booking is another important dimension in back-office operations. In addition, the findings have indicated that, satisfaction of passengers on different airline companies differs based on the services delivered.
Significance of satisfying the customers has no limitation i.e. it involves all firms and companies including airlines. Degirmenci et al. (2012) have stated that, “airline companies have realized the importance of satisfied customers to find a place for themselves in this competitive world and initiated many projects to measure service quality and satisfy the customers by improving service quality”. Degirmenci et al. (2012) have analyzed the factors affecting customer’s experience at Turkish Airlines, based on weighted SERVQUAL methodology. The results have suggested that, image dimension has the highest customer satisfaction level, followed by employees and empathy dimensions. E-commerce has the lowest satisfaction level; in-flight services and ground handling service followed that. Furthermore, meals and passenger transferring services have the highest impact on customer satisfaction.
In an extremely competitive and stimulating environment, provision of high standard services to consumers is the main competitive benefit for continuous growth and profitability of an airline (Chen, 2008). In the recent past decade, air transportation ventures has even become more demanding, numerous airlines have to center on the service quality of their ventures, to boost service satisfaction. The quality service conditions enhance a firm’s competitive advantage in order to retain customer patronage, which leads to market share and profitability (Park et al., 2004; Morash and Ozment, 1994).
passengers. However those studies have generally focused on measuring the quality of air transportation based on the following: (i) hybrid fuzzy MCDM model, (ii) non-additive fuzzy integral model, (iii) fuzzy multi-criteria analysis, (iv) SERVQUAL-model, (v) Rasch model, (vi) regression analysis model, (vii) pearson correlation, (viii) Importance-performance analysis (IPA), and (ix) the structural equation modelling (SEM). Apart from the above models, those studies have also adapted descriptive to assess customer satisfaction.
It is noteworthy that, depicting and assessing quality in airline service are totally challenging tasks, due to its heterogeneity, intangibility, and inseparability; furthermore, it is only possible for the customers to appropriately describe the quality of service rendered by the airline industry. Keeping these challenges in mind, this present study has used a unique method, which was not present in earlier air transportation studies, known as Importance-Satisfaction Analysis (ISA). The ISA has been employed to gauge the quality of service rendered by the airline industry to its passengers. We believe that, Importance-Satisfaction Analysis (ISA) would be capable enough to handle the different types of responses from the passengers, and facilitate us to recognize the significant decisive criteria (items). We have employed ISA to categorize those items according to their precedence, for example some items are classified in ‘‘Concentrate here’’ quadrant, and by analyzing those items we were able to emphasize the detrimental influences on airline service quality were highlighted.
An airline offering excellent quality service would be in the forefront of the market. It is ultimately essential for airlines to recognize their competitive benefits on service quality. Few recent empirical studies have showed the various ways of approaching airline service quality. To summarize, knowledge from previous research shows that, air transport is still an alternative choice of intercity travel mode for many people. In order to attract prospect passengers, air transport operators must improve their services to accommodate wide range of needs and expectations of customers. In this paper we have studied importance of passengers’ satisfaction towards air transport in the major cities of Libya. This study is aimed to answer the following research questions: (1) what are the factors that influence the quality of services in air passengers? (2) Are the customers satisfied with the service provided?, and (3) What actions need to be taken, to improve the quality of service?
Methodology:
This study has been conducted with the following objectives: (i) to understand the satisfaction level of customers who use airline service, (ii) to identify the main factors that provides optimum satisfaction to the airline service customers, (iii) to identify the aspects that has to be enhanced, to increase the satisfaction amongst the customers. This study covers a sample of 312 respondents and the survey was conducted at the major airports terminal of Libya. The duration of the fieldwork was from November 2, 2010 to January 25, 2011. Data used in this paper were collected from five major cities, including Tripoli, Benghazi, Surt, Sabha and AlKufrah as shown in figure 2. Sampling has been done by randomly interviewing selected passengers, at different times of the day, on every day of the week, over a period of four weeks. A structured questionnaire was used for data collection. In the survey questionnaire, questions on customer satisfaction were asked with responses in the scale of 1-7, ranking from 1 “highly dissatisfied” to 7 “highly satisfied”.
The survey form was provided in two languages, i.e. Arabic language and English language. The questionnaire was divided into three sections; the first section reveals the demographic profile of respondents, such as gender, age, occupation, purpose of using the airline service and also the frequency of using the airline in a month. The second and third sections were designed to evaluate their overall experiences they received from the airline services, and the importance and satisfaction levels of Consortium airline services. The factors surveyed for the airline service importance and satisfaction were the same, which includes, comfort, staff behavior at the counter, service, aircraft, punctuality, security and safety, and ticket price.
a) Importance-Satisfaction Analysis (ISA):
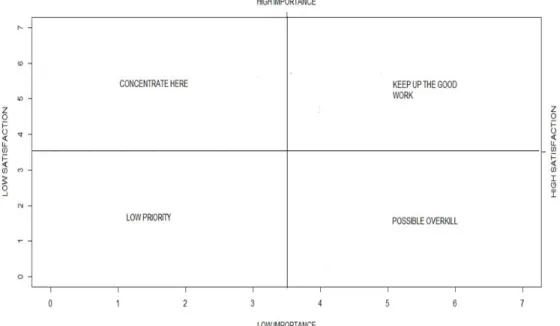
The present study used the ISA (Importance-Satisfaction Analysis) as a useful analysis, to recognize the areas of improvement, equally, as a directory to strategic planning. ISA (Importance-Satisfaction Analysis) is related to the IPA (Importance-Performance Analysis) designed by Martilla and James (1977). The main variation between the two tests is that, IPA employs the views of the respondents concerning the performance of the issue under study, whereas ISA employs the satisfaction of the respondent. The technique is equally useful and simple for recognizing those features of a goods or services that are most very essential for enhancement, or helpful for likely cost-saving situation, without inversely affecting the whole quality. The important attributes were considered first, thereafter the satisfaction was considered using the measured qualities. The mean attributes for importance as well as satisfaction are used as x-axis and y-axis, respectively as shown in Figure 3.
Quadrant ‘Concentrate here’ (low satisfaction and high importance), it is important to give necessary attention to the attributes. If one fail to recognize those attributes it may affect the sustainability of some companies and may lead to consumer dissatisfaction. The attribute ‘Keep-up the good work’, illustrates the possibility of achieving competitive advantage, as it is the core power, which has high satisfaction and importance. The management makes resolution to sustain its good services from the above quadrant, because the consumers are highly satisfied, and think that, these features is extremely essential to them. The quadrant ‘Low priority’ implies that, both, satisfaction and importance are very low, and minor weaknesses are the key features in the quadrant, as results do not require additional effort (i.e. Low priority). Meanwhile, the quadrant ‘Possible overkill’ indicates that, there are ways, which the resources could be organized at other areas. The reason being that, consumers were highly satisfied with this feature; however they think that this attribute has less importance.
Fig. 3: Importance- Satisfaction Analysis (ISA)
b) Customers Satisfaction Index:
Consumers Satisfaction Index is yet a different instrument that helps to ascertain consumer satisfaction level, in order for the airline company to ensure that, the service provided is usually consistent (Zalina et al., 2009). As stated, this study centers on CSI, which is measured by the means of satisfaction rates as expressed by customers, calculated on the platform of the important rates, based on the formula given below:
Where
importance rates as mentioned by the consumers on the k attribute and the total of the average importance rates of the entire service quality features:
Before Customers Satisfaction Index can be achieved, the following are the steps required to be taken: 1. Estimate the mean importance (A) for all qualities
2. Find the weight factor (B), where (B) = (A) / (total (A)). 3. Estimate mean satisfaction (C) for all the features
4. Estimate weight score using the formula of weight score = (B) * (C). 5. Calculate Weightage percentage = total of weightage score * 100. 6. Lastly, Customers Satisfaction Index is obtained using the formula of:
(CSI) = (weightage percentage / 7) * 100 Normally CSI is given in the form of percentage.
According to Heskett et al. (1997), consumer service is at the outstanding level, if it has consumer’s satisfaction point at 81%-100%; while the consumer’s Satisfaction Index which is between 41%-80% connotes that service rendered is good; however, passengers’ Satisfaction Index which is between 0-40% is considered as average or unsatisfactory level.
RESULT AND DISCUSSION
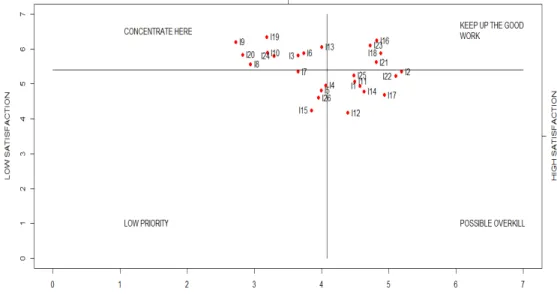
The two types of tools for analysis are clearly discussed in this part; results of Importance- Satisfaction Analysis, (ISA) and also outcomes from CSI Customers Satisfaction Index (CSI). Figure 4 shows a scatter plot of the mean values for the participants’ satisfaction and importance including the elements in service. The data collected have been analyzed with SPSS 20.0 for Windows program and R software programming language. Figure 4 states the relative status of the features in matrix format, as well as the values of satisfaction on the horizontal axis and values of importance on the vertical axis. Airline service quality questionnaire are categorized into quadrants as depicted in the graph below: quadrant I (Concentrate here), quadrant II (Keep up the good work), quadrant III (Low priority) and quadrant IV (Possible overkill). As indicated in Figure 4, nearly all the items gathered in quadrants I, II and IV, with just a little in quadrants III. Moreover, some items fell too close to satisfaction axis or importance axis, which had confused the authors to make incorrect decisions. For instance, some attributes fell within the ‘low priority’ quadrant, while others fell within the same quadrant however too close to the ‘concentrate here’ and ‘Possible overkill’ quadrant boundary such as I7 and I4
respectively, while another fell within the “Possible overkill”, but very close to the ‘Keep up the good work" quadrant boundary. As the conventional ISA fail to distinguish the items placed into the same quadrant as well the borderline items might not give accurate managerial decisions, the researchers might not possess the capability to give accurate report about the findings. The above mentioned problem was tackled, with Tarrant and Smith (2002) framework to make ISA (Importance- Satisfaction Analysis) a bit more sensitive to the variance of the responses. The standard error was estimated for the individual item, including, importance and the satisfaction values. Summing the standard error to the data points on the Importance -Satisfaction graph, a confidence interval with the mean value in the centre and two standard error bars has been created. The standard error bars expand horizontally for satisfaction values and vertically for importance values in both negative and positive values of the mean.
"Keep up the good work" Quadrant, stand for the region that items are essential, and degrees of passenger’s satisfaction are high. On the quadrant, the management should keep up the current action strategies. In other words, consumers consider that, as high service quality and their satisfaction status with the airline company services is also high considering items I16 (Aircraft condition), I18 (Cabin cleanliness), I21 (Security devices
appropriate for use) and I23 (Flight Safety). While the items I2 (Seat Condition), I25 (Children Cost) and I22
(Luggage storage guarantee) are close to the border line of this quadrant, Tarrant-Smith framework suggests that these items are falls in “possible overkill” quadrant. The airline companies should keep up the good work about those items.
"Possible overkill" quadrant stands for the area, where participants' satisfaction levels are high, however these are not seen as essential. The quadrant indicates the, efforts towards those items can be abridged. Invariably, this quadrant has items that give satisfaction to the participants, but not as significant as the rest items. As mentioned by the air travelers, the items that are under this quadrant are I1, I2, I11, I12, I14, I17, I22 and
I25.
“Low priority”, means; area where the conditions are not seen as essential, as well as the satisfaction of travelers towards the criteria is seen as low, and not seen as a main concern for implementing enhancement activities, and the quadrant. The item I15 (Catering services) belong to this quadrant and seen as the least
cities in Libya is about one hour. According to Tarrant-Smith framework, the items staff behavior at the counter factor (I4 friendly and I5 tidy and neat) and I26 (festive season cost) belong to this quadrant “Low priority”.
Moreover, the item I7 (fast and organized queues) is very close to the border line of “Concentrate here”
quadrant, Tarrant-Smith framework suggests that this item among the “Low priority” quadrant, but the airline companies should make attention to this item in order to improve their service quality.
Fig. 4: Results of Importance-Satisfaction Analysis of Airline service in Libya
“Concentrate here”: means an area, where items are essential, equally where the consumers’ satisfaction levels are low. Focusing on enhancement activities in this aspect would yield maximum outcomes. These kinds of items are essential and should be given more priority by the management, in order to implement plans, to develop the value of services offered. In this research, the given items were placed within this quadrant, organized in ascending order of importance: I3, I6, I9, I10, I19, I20 and I24. The item I8 is extremely close to the
border line of "Low priority" quadrant, Tarrant-Smith framework suggests that really belong to "Concentrate here" quadrant. Tarrant-Smith model states that item I13 belongs to the "Concentrate here" quadrant however
this item is extremely close to the border line of "Keep up the good work" quadrant. This given section rap-ups the analysis for these items.
"Concentrate here" connotes a region, where items are essential, equally when the level of consumers’ satisfaction are very little. Concentrating enhancement actions in this segment will yield maximum outcome.
I3 (The Service inside Aircraft): If services rendered in flight are not up to the standard, and if the behavior
of cabin crew is also rude and unhelpful, it will lead to complaint. The in-flight hospitality provided by high spirited air travel attendants (Ng, et al., 2011) influence passengers’ satisfaction. The study showed that customers were not contented with the In-flight service. Many participants have complained: the inadequate of service given inside aircraft and insufficient luggage space. The comment reveals that, the seats and the leg room are comfortable and specious. The entertainment tools and gadgets are very poor. Airline Company should make more entertainment facilities available for the travellers. In service training should be given to the flight attendants, in order to enhance the ability and capacity of the company. Therefore, they can increase the level of customer satisfaction by providing more number of flight attendants. They can be trained in order to become more polite and passengers’ friendly.
I6 (Degree of Courtesy of Staff): this item denotes, the capacity of workers to relate with passengers, being
improvement of the ability and capacity of attendants, the enterprise could provide in-service training to the workers. Such training may include behavior modification strategies and attitudes, for this reason, the company could ask the workers to modify their attitudes for better, concerning the interactions with passengers.
I8 (Ease of Purchase Tickets): Passengers were very dissatisfied with purchasing tickets. Passengers cannot
purchase tickets at the airline office service, because they are not available in all cities. In order to improve their service, they airline should increase the number of branch offices or use new technologies such as, enabling users to buy tickets using phones or by websites (they could make payment through debit or credit card). Respondents have reported discrepancy in fare related issues, such as, incorrect fare information, extra charges; wrong availability status etc. The item was named by consumers as the lower level of satisfaction and higher level of importance. Importantly, the item is inbuilt in the course of selling out tickets, a procedure that influences the degree of passengers’ satisfaction in relation to various other items. As a result of this, the subsequent section will reveal comprehensively study of the case.
Table 1: Results of Importance-Satisfaction Analysis (ISA) Dimension
s of Quality
Content of Question Items
Satisfaction Importance S. E
- SE +
S.E
S. E
- SE +SE
Comfort Factor
(I1) Luggage storage facilities 4.570 0.120 4.450 4.690 4.940 0.086 4.854 5.026
(I2) Seat Condition 5.190 0.110 5.080 5.300 5.350* 0.113 5.237* 5.463*
(I3) The service inside Aircraft 3.650 0.090 3.560 3.740 5.810 0.079 5.731 5.889 Staff
behavior at the Counter Factor
(I4) Friendly 4.060* 0.100 3.960* 4.160* 4.970 0.087 4.883 5.057
(I5) Neat and tidy 3.990* 0.090 3.900* 4.080* 4.820 0.090 4.730 4.910
(I6) Degree of courtesy of staff 3.730 0.090 3.640 3.820 5.880 0.072 5.808 5.952 (I7) Fast and organized queues 3.650 0.090 3.560 3.740 5.350* 0.067 5.283* 5.417* (I8) Ease of purchase tickets 2.940 0.096 2.844 3.036 5.560* 0.101 5.459* 5.661* Service
Factor
(I9) Announcement of delay and arrival
2.720 0.115
2.605 2.835
6.200 0.067
6.133 6.267 (I10) Availability of online service 3.190 0.102 3.088 3.292 5.890 0.067 5.823 5.957 (I11) Clear journey time information
board
4.490 0.067
4.423 4.557
5.070 0.090
4.980 5.160 (I12) Ticket refund service 4.390 0.072 4.318 4.462 4.170 0.135 4.035 4.305 (I13) Exchanging of departure time
service
4.000* 0.085
3.915* 4.085*
6.060 0.075
5.985 6.135
(I14) Baggage services 4.630 0.057 4.573 4.687 4.780 0.120 4.660 4.900
(I15) Catering services 3.850 0.091 3.759 3.941 4.240 0.138 4.102 4.378
Aircraft Factor
(I16) Aircraft condition 4.820 0.082 4.738 4.902 6.240 0.060 6.180 6.300
(I17) Aircraft type 4.930 0.087 4.843 5.017 4.680 0.119 4.561 4.799
(I18) Cabin cleanliness 4.880 0.088 4.792 4.968 5.880 0.067 5.813 5.947
Punctuality Factor
(I19) Departure time as scheduled 3.180 0.102 3.078 3.282 6.340 0.061 6.279 6.401
(I20) Convenience of schedules 2.820 0.094 2.726 2.914 5.840 0.067 5.773 5.907
Security/ safety factor
(I21) Security devices suitable for use 4.810 0.082 4.728 4.892 5.630* 0.096 5.534* 5.726* (I22) Luggage storage guarantee 5.100 0.122 4.978 5.222 5.220* 0.115 5.105* 5.335*
(I23) Flight Safety 4.720 0.090 4.630 4.810 6.100 0.073 6.027 6.173
Ticket price factor
(I24) Adult cost 3.290 0.100 3.190 3.390 5.800 0.070 5.730 5.870
(I25) Children Cost 4.480 0.067 4.413 4.547 5.240* 0.114 5.126* 5.354*
(I26) Festive season Cost 3.950* 0.091 3.859* 4.041* 4.600 0.118 4.482 4.718 Note: * Is the suggestion of Tarrant and Smith (2002) framework about the items which fall very close to axis (I2, I4, I5, I7, I8, I13, I21, I25 and I26)
I9 (Announcement of Delay and Arrival): Passengers were very dissatisfied with announcement of delay
and arrival. In order to avoid this problem, when there are flight related problems, it is important to give authentic and timely information to passengers, as well as alternative arrangements should be made at least for onward connecting passengers. If there is planned cancellation or delay, then passengers must be informed well in time, so that they can report accordingly. The major complaint is the departure time, all the respondents have complained about the delay. The airline company should be cautious on this issue. Though, services such as online ticketing, communication concerning the ticket price, information concerning destination etc. are unsatisfactory.
I10 (Availability of Online Service): Passengers were very dissatisfied with the online ticket service and
journey information of the airline. It is necessary to improve this item, as it is considered essential by customers, i.e., to increase the degree of services, such as online ticketing, communication about the ticket price, information about destination, etc. are not pleasing.
I13 (Exchanging of departure time service): It is imperative to stress that special consideration should be
I19 (Departure Time as Scheduled): participants were not satisfied with the airline management on this item.
Numerous aspects that cause the delay of the airplane during departure time were mentioned. The opinion of most consumers about pre-flight service is bad. The main complaint is the period before. All the respondents have complained regarding the delay. The airline company should take caution on this aspect.
I20 (Convenience of Schedules): time arrangement is based on when and where the airline will take-off.
Passengers were very dissatisfied with the airline fly schedules; there need to be more trips per a day, for example three trips a day for the major cities, because one trip is not enough comparing with the population of these cities. Planning of Flight timing is established to make the most of long-term profitability. The income and cost related to each timing are based on very diverse views of the similar information.
I24 (Adult Ticket Cost), this item is the money paid and the service rendered by airline. Note that, in order to
enhance the customers’ satisfaction regarding this item, the airline companies should reduce the value of the ticket fare.
The essential thing to highlight is that, unique concentration has to be given to items I24 (Adult Ticket Cost),
I19 (Departure period of the flight as planned), I20 (Convenience of Schedules) and I10 (Availability of Online
Service). Meanwhile, a more in-depth analysis of the highly critical items reveals that, the core problem is the procedure of takeoff time of the flight as planned. The results indicate that quite a number of efforts should be devoted to improve the level of passengers’ satisfaction so that the problem of losing the competitive advantage, could be prevented, for instance, preventing passengers from changing airline to use private cars. Despite the fact that, the evaluation of the influence and repercussions of these problems, in order to enhance the transportation quality services by airline, are not within the coverage of the study. It is therefore, very feasible that optimistic outcomes can be achieved, if these suggestion and result are essentially carried out.
Table 2 illustrates the outcomes of analysis done using Customers’ Satisfaction Index method, which reveals based on the degree of the importance, the mean for every attributes, as well as the level of satisfaction, level of weight age, and the score of weight age in order to get the index value of users’ satisfaction, CSI (i.e. CSI = 4.05/7 * 100 = 57.88%). This shows that, as a whole, Customers’ Satisfaction Index (CSI) for airline Consortium Company is 57.88%, which is at a moderate level.
Table 2: Importance and Satisfaction Mean, Weightage Level and Score
Attribute Importance Mean (A)
(B) = (A)/ (total (A))
Satisfaction Mean (C)
Weight score = (B)*(C)
Comfort Factor
(I1) Luggage storage facilities 4.94 0.035 4.57 0.161
(I2) Seat Condition 5.35 0.038 5.19 0.197
(I3) The service inside Aircraft 5.81 0.041 3.65 0.151
Staff behavior at the Counter Factor
(I4) Friendly 4.97 0.035 4.06 0.143
(I5) Neat and tidy 4.82 0.034 3.99 0.137
(I6) Degree of courtesy of staff 5.88 0.042 3.73 0.156
(I7) Fast and organized queues 5.35 0.038 3.65 0.139
(I8) Ease of purchase tickets 5.56 0.040 2.94 0.116
Service Factor
(I9) Announcement of delay and arrival 6.20 0.044 2.72 0.120
(I10) Availability of online service 5.89 0.042 3.19 0.134
(I11) Clear journey time information board 5.07 0.036 4.49 0.162
(I12) Ticket refund service 4.17 0.030 4.39 0.130
(I13) Exchanging of departure time service 6.06 0.043 4.00 0.172
(I14) Baggage services 4.78 0.034 4.63 0.157
(I15) Catering services 4.24 0.030 3.85 0.116
Aircraft Factor
(I16) Aircraft condition 6.24 0.044 4.82 0.214
(I17) Aircraft type 4.68 0.033 4.93 0.164
(I18) Cabin cleanliness 5.88 0.042 4.88 0.204
Punctuality Factor
(I19) Departure time as scheduled 6.34 0.045 3.18 0.143
(I20) Convenience of schedules 5.84 0.042 2.82 0.117
Security and safety factor
(I21) Security devices suitable for use 5.63 0.040 4.81 0.192
(I22) Luggage storage guarantee 5.22 0.037 5.10 0.189
(I23) Flight Safety 6.10 0.043 4.72 0.205
Ticket price factor
(I24) Adult cost 5.80 0.041 3.29 0.136
(I25) Children Cost 5.24 0.037 4.48 0.167
(I26) Festive season Cost 4.60 0.033 3.95 0.129
Weight Percentage 4.05%
Conclusion:
The enhancement in the quality of service is a means towards better profitability. Therefore, investing money in advanced technologies alone may not solve the problems, but to prioritize company activities in the way they could enhance the degree of quality perceived by passengers. This will result in providing attractive services to the customers. Due to the premise that, if customers’ satisfaction level could be sustained, it could probably build their loyalty toward the company.
This study had found that, generally, customer satisfaction with air service quality is poor or below the satisfactory level in Libya. This implies that, policy makers and industry regulators such as, the Ministry of Transport, as well as the Board of Directors for Air transport in Libya, need to be alerted with this empirical fact, and take pragmatic steps to ensure that the domestic airlines and local airports improve their efficiency and effectiveness to provide air services that meet and exceed customer needs, desires and expectations. This can be done by encouraging the authorities of the domestic airline and local airports to focus more attention and resources on service quality dimensions, which are found to be the least satisfying as identified in this study. In this regard, efforts and resources should be focused on improving those dimensions, which are found to be most dissatisfying and would be detrimental to the long term viability of air transport in Libya. This means that, a more concerted effort by management and intensive strategies must be geared towards improving those services, for which passengers are least satisfied.
In short, we have discovered that, users’ perception of airline companies could be improved further, when the key factors are identified, they can be categorized according to their order of importance as well as satisfaction. As a result, airline companies are required to follow some steps to enhance particular features, in order to improve the level of customers’ satisfaction. Every step taken must aim at satisfying the users’ need.
ISA (Importance-Satisfaction Analysis) was employed to categorized items based on their priority, particularly the items categorized in "Concentrate here" quadrant. Items placed into this quadrant were calculated and the negative influences on service quality were stated. Sorting process was also carried out in order to give service quality indexes to one of pre-defined levels, which stand for the levels of satisfaction. After explanation of the outcome and observations, it was discovered that, the major problems are; the procedure of departure time as planned, convenience of schedules, announcement of delay, arrival and availability of online service and proportion of the Adult ticket cost. Some likely modifications could be done to enhance the services quality based each critical item (criterion). It must have the inclination for timely cost reduction, fulfill the highest International Aviation Safety; criteria, practices and meet up their standards, and keep services transparent and simple.
This study is the pioneer in the field of air transportation research to employ Importance-Satisfaction Analysis (ISA) by using Tarrant and Smith (2002) framework. The standard error for every item was estimated, including both the importance value and satisfaction. Summing up the standard error with the data points on the Importance -Satisfaction graph, a confidence interval with the mean value in the middle and two standard error bars was provided. The standard error bars extended horizontally for satisfaction values and vertically for importance values in both negative and positive values of the mean. For example, some attributes fell within the ‘low priority’ quadrant, whereas, others fell within the ‘low priority’ quadrant, but extremely close to the ‘concentrate here’ and ‘Possible overkill’ quadrant boundary such as, I7 and I4 respectively, while another fell
within the “Possible overkill”, but very close to the ‘Keep up the good work" Quadrant’ quadrant boundary. The researchers might not be able to report accurate findings. In order to tackle this problem, Tarrant and Smith (2002) framework was employed to make Importance- Satisfaction Analysis (ISA) more susceptible to the variance of the responses.
The conclusion of this modelling will be helpful in the intercity travel demand analysis for the Libyan Airlines and the Ministry of Transportation and Communication. It will also help the government air transportation agencies and private carriers to make marginal decisions and prevent form under or over designing of their facilities, and to improve their service.
ACKNOWLEDGEMENT
This study supported by the Ministry of Transportation in Libya whose support is highly appreciated. The authors would also like to thank the National University of Malaysia and the Sabha University in Libya for the support provided for this work.
REFERENCES
Archana and Subha, 2012. A Study on Service Quality and Passenger Satisfaction on Indian Airlines. International Journal of Multidisciplinary Research, 2: 50-63.
Chen Fang-Yuan and Yu-Hern Chang, 2005. “Examining Airline Service Quality From A Process Perspective”. Journal Of Air Transport Management., 11: 79-87.
Chen, C.F., 2008. Investigating structural relationships between service quality, perceived value, satisfaction, and behavioral intentions for air passengers: Evidence from Taiwan, Transportation Research Part A, 42: 709-717.
Clemes, M.D., C. Gan, T. Kao and M. Choong, 2008. An Empirical Analysis of Customer Satisfaction in International Air Travel. Innovative Marketing, Volume 4, Issue 2.
Degirmenci, E., H. Basligil, A. Bolat and Y. Ozdemir, 2012. Customer Satisfaction Measurement in Airline Services Using Servqual. 1: 294. doi:10.4172/scientificreports.294.
Dennet, C.E., M. Ineson, G.J. Stone and M. Colgate, 2000. Pre-Bookable Services in the Chartered Airline Industry: Increasing Satisfaction through Differentiation. Service Industries Journal, 20(2): 82-94.
Gilbert, D. and R.K.C. Wong, 2003. Passenger expectations and airline services: a Hong Kong based study. Tourism Management., 24: 519-532.
Gronroos, C., 2000. Service Management and Marketing. Lexington, MA: Lexington Books. J. Heskett, W.E. Sasser and L.A. Schlesinge, 1997. The Service Profit Chain. New York : Free Press. Kotler, P., & K. Keller, 2006. Marketing Management (12th ed.). New Jersey: Pearson Education Inc. Lovelock, C., J. Wirtz, 2007. Services Marketing: People, Technology and Strategy. 6th Edition. Pearson Prentice Hall.
Manssour, A., 2013. Abdulsalam Bin Miskeen, Ahmed Mohamed Alhodairi and Riza Atiq Abdullah Bin O.K. Rahmat, 2013a. Modeling of Intercity Transport Mode Choice Behavior in Libya: a Binary Logit Model for Business Trips by Private Car and Intercity Bus. Australian Journal of Basic and Applied Sciences, 7(1): 302-311.
Manssour, A., Abdulsalam Bin Miskeen, Ahmed Mohamed Alhodairi and Riza Atiq Abdullah Bin O.K. Rahmat, 2013b. Behavior Modeling of Intercity Travel Mode Choice for Business Trips in Libya: a Binary Logit Model of Car and Airplane. Accepted by Journal of Applied Sciences Research, 53JASR.
Manssour, A., Abdulsalam Bin Miskeen, Ahmed Mohamed Alhodairi and Riza Atiq Abdullah Bin O.K. Rahmat, 2013c. Modeling of Intercity Travel Mode Choice Behavior for Non-Business Trips within Libya. Accepted by Research Journal of Applied Sciences, Engineering and Technology. 9716-RJASET-DOI
Manssour, A.A.B. Miskeen and Riza A.O.K. Rahmat, 2012. "Influencing Intercity Mode Choice Behavior in Libya," International Journal of Information and Electronics Engineering, 2(4): 547-551.
Manssour, A.A.B. Miskeen, Riza A.O.K. Rahmat and Ahmed M Alhodairi, 2012. Modelling Intercity Route Choice Behaviour to Explore Road Users’ Response to Road Pricing Policy in Libya," Australian Journal of Basic and Applied Sciences, 6(9): 431-439.
Manssour, A.A.B., Miskeen and Riza A.O.K. Rahmat, 2011. Development Of Disaggregate Mode Choice Models of Intercity Travel in Libya. 6th IEEE Joint International Information Technology and Artificial Intelligence Conference, (ITAIC). 2: 197-201, China, Chongqing.
Martilla, J.A., J.C. James, 1977. Importance-performance analysis. Journal of Marketing, 41(1): 77-79. Morash, W.A. and J. Ozment, 1994. Toward management of transportation service quality, Logistics and Transportation Review, 30: 115-140.
Ng, S.I., M. Sambasivan, S. Zubaidah, 2011. Antecedents and outcomes of flight attendants’ job satisfaction. Journal of Air Transport Management, 17: 309-313.
Oliver, R.L., 1993. Cognitive affective and attribute bases of the satisfaction response. Journal of Consumer Research, pp: 418-430.
Ostrowski, R.L., T.V. O’Brien and G.L. Gordon, 1993. Service Quality and Customer Loyalty in the Commercial Airline Industry. Journal of Travel Research, 32(2): 16-24.
Parasuraman, A., V.A. Zeithaml, & L. Berry, 1988. A Multiple-Item Scale for Measuring Consumer Perception of Service Quality. Journal of Retailing, 64(1): 9-19.
Park, J.W., R. Robertson and C.L. Wu, 2004. The effect of airline service on passengers’ behaviourl intentions: a Korean case study, Journal of Air Transport Management, 10: 435-439.
Parker, C., & B. Mathews, 2001. Customer satisfaction:contrary academic and consumers' intrepretations. Marketing Intelligence and Planning, 19(1): 38-44.
Report of Ministry of Transportation in Libya 2012.
Sultan, F., & M.C. Simpson Jr, 2000. Internaitonal service variants: airline passenger expectations and perceptions of service quality. Journal of Services Marketing, 14(3): 178-227.
Swan, J.E., & L.J. Combs, 1976. Perfromance and consumer satisfaction: A new concept. Journal of Marketing, 40(2): 25-33.
Tarrant, M.A., E.K. Smith, 2002. The use of a modified importance-performance framework to examine visitor satisfaction with attributes of outdoor recreation settings. Managing Leisure., 7: 69-82.
Yu-Hern Changa, Chung-Hsing Yehb, 2002. A survey analysis of service quality for domestic airlines, European Journal of Operational Research, 139: 166-177.
Yu-Kai HUANG, 2009. The Effect of Airline Service Quality on Passengers’ Behavioural Intentions Using SERVQUAL Scores: A TAIWAN Case Study. Journal of the Eastern Asia Society for Transportation Studies, 8.