RESEARCH ARTICLE
Efficient conformational sampling
and weak scoring in docking programs?
Strategy of the wisdom of crowds
Ludovic Chaput
1,2,3,4,5and Liliane Mouawad
1,2,3,4*Abstract
Background: In drug design, an efficient structure-based optimization of a ligand needs the precise knowledge of the protein–ligand interactions. In the absence of experimental information, docking programs are necessary for ligand positioning, and the choice of a reliable program is essential for the success of such an optimization. The performances of four popular docking programs, Gold, Glide, Surflex and FlexX, were investigated using 100 crystal structures of complexes taken from the Directory of Useful Decoys-Enhanced database.
Results: The ligand conformational sampling was rather efficient, with a correct pose found for a maximum of 84 complexes, obtained by Surflex. However, the ranking of the correct poses was not as efficient, with a maximum of 68 top-rank or 75 top-4 rank correct poses given by Glidescore. No relationship was found between either the sampling or the scoring performance of the four programs and the properties of either the targets or the small molecules, except for the number of ligand rotatable bonds. As well, no exploitable relationship was found between each pro-gram performance in docking and in virtual screening; a wrong top-rank pose may obtain a good score that allows it to be ranked among the most active compounds and vice versa. Also, to improve the results of docking, the strengths of the programs were combined either by using a rescoring procedure or the United Subset Consensus (USC). Oddly, positioning with Surflex and rescoring with Glidescore did not improve the results. However, USC based on dock-ing allowed us to obtain a correct pose in the top-4 rank for 87 complexes. Finally, nine complexes were scrutinized, because a correct pose was found by at least one program but poorly ranked by all four programs. Contrarily to what was expected, except for one case, this was not due to weaknesses of the scoring functions.
Conclusions: We conclude that the scoring functions should be improved to detect the correct poses, but some-times their failure may be due to other varied considerations. To increase the chances of success, we recommend to use several programs and combine their results.
Keywords: Docking, Rescoring, USC, Gold, Glide, Surflex, FlexX, DUD-E, Benchmark
© The Author(s) 2017. This article is distributed under the terms of the Creative Commons Attribution 4.0 International License (http://creativecommons.org/licenses/by/4.0/), which permits unrestricted use, distribution, and reproduction in any medium, provided you give appropriate credit to the original author(s) and the source, provide a link to the Creative Commons license, and indicate if changes were made. The Creative Commons Public Domain Dedication waiver (http://creativecommons.org/ publicdomain/zero/1.0/) applies to the data made available in this article, unless otherwise stated.
Background
In drug discovery campaigns, hit-to-lead is the stage during which the binding affinity between a newly iden-tified molecule and a therapeutic protein target is opti-mized. A structure-based optimization necessitates the precise knowledge of the interactions between the ligand and the protein in order to improve the ligand affinity
in an efficient and rational way. This knowledge is best obtained by resolving the structure of the protein–ligand complex, either by X-ray crystallography or by NMR, which is time consuming and sometimes difficult to achieve, especially if the binding mode of several com-pounds has to be investigated. Hence the use of docking programs, which could be precious tools for the identifi-cation of the binding modes considering their ease of use and rapidity. However, despite the continuous improve-ments brought to these programs, the predicted binding
Open Access
*Correspondence: [email protected]
3 Inserm, U1196, Orsay, France
modes of the ligands are still far from being absolutely reliable [1].
Both commercial and non-commercial docking pro-grams are available, Autodock [2], Gold [3], Glide [4], Surflex [5] and FlexX [6] being the most used [1]. While Autodock, an open-source program, is popular in aca-demic research groups, private companies usually pre-fer commercial solutions such as Gold, Glide, Surflex and FlexX, for their speed and efficiency. Here, we only consider the last four programs. Benchmarks of docking programs are regularly released to compare their per-formance, whether by using semi-rigid docking (flexible ligand, rigid protein) [7–14], flexible docking (flexible ligand and protein) [15–17], ensemble docking (using several conformations of the protein) [15, 18] or cross-docking (cross-docking ligands taken from some structures on proteins from other structures) [19, 20]. We may cite more particularly some semi-rigid docking benchmarks that include Gold, Glide, Surflex or FlexX and that were made on a large number of targets. Usually, benchmarks are used to compare, or simply evaluate, the performance of programs or scoring functions. For example, Liebes-chuetz et al. [21] evaluated the pose prediction and the performance of Gold scoring functions using the Direc-tory of Useful Decoys (DUD) dataset [22], which con-sists of 40 varied protein targets. They found that 81% of the top-rank poses were close to the crystal conforma-tion with a root-mean-square deviaconforma-tion (RMSD) lower than 2 Å. Recently, Murphy et al. [23] investigated, by an ensemble docking, the performance of various scoring functions in Glide for docking and virtual screening on 22 targets and obtained 92% of the top-rank poses within 2 Å from the crystal pose. In other cases, benchmarks are also used to correlate the program performance to the protein or ligand properties. For instance, Kellenberger et al. [24] evaluated the ability of six docking programs to recover the X-ray pose for 100 protein–ligand complexes. They reported that Gold, Glide, Surflex and FlexX were the most accurate programs and that generally their per-formance decreased with the size of the binding site, the size of the ligand and the number of its rotatable bonds. Some of these observations were corroborated by Li et al. [12] on 195 protein–ligand complexes. On the other hand, Wang et al. [25] have reported from a comprehen-sive evaluation of ten docking programs that the correla-tion between the scores of some programs (Gold, Glide and Surflex, among others) and the binding affinities may be high for certain protein families (up to 0.7). They concluded that these programs may be more suitable for these families. However, this assertion seems fragile in the absence of information concerning the degree of identity between the proteins of the same family and the similarities between their ligands.
Some conclusions of these docking benchmarks seem to be in contradiction with our observations made on a virtual screening benchmark [26]. Indeed, we have reported recently the results of the benchmark of Gold, Glide, Surflex and FlexX for virtual screening on the 102 protein targets of the Directory of Useful Decoys-Enhanced database (DUD-E) [27]. We have shown that the good performance of these programs was mainly due to biases in some properties of the chemical libraries and that in contrast, there was no clear relationship between the performance and the properties of the protein cavi-ties or the protein families. The reasons for these discrep-ancies should be investigated. Are they solely due to the difference between docking (i.e., the comparison between poses of the same molecule) and virtual screening (i.e., the comparison between the top-rank pose of several dif-ferent molecules)? Since the first is the basis of the sec-ond, we may ask if there is a relationship between the performances of these programs in docking and in virtual screening and what would be the influence of the protein and ligand properties on the results of docking. Finally, the weaknesses of the scoring functions were described to be responsible for the docking bad performance of some programs. Is this always the case? And is there a strategy to overcome this bad performance?
To answer these questions, we performed docking cal-culations on the crystal structures of 100 protein–ligand complexes taken from the DUD-E dataset, using Gold, Glide, Surflex and FlexX. Since only the semi-rigid dock-ing is common to these programs, it was adopted here for the sake of comparability. In what follows, the dock-ing performance of the four programs is first evaluated; then, for each program, the relationship between the performance and the properties of the proteins and the small molecules is investigated and the docking and vir-tual screening performances are compared; finally, two procedures to improve the chances of obtaining correct poses are explored. But beforehand, the pertinence of the protein–ligand database is investigated to assess its representativeness.
Results and discussion
Pertinence of the database for docking
lower than 1 Å [28]. Of these proteins, only 58 could be gathered in 9 varied families [26]: protein kinases, nuclear receptors, proteases, GPCRs, cleaving enzymes, cycloox-ygenases, cytochromes P450, ion channels and histone deacetylases. The others were unique samples gathered in a miscellaneous set. In addition, their binding sites were shown to be diverse considering their size (i.e., the total number of heavy atoms in the cavity), their hydrophobic-ity (represented by the fraction of carbon atoms, FCA, in the cavity) and their exposure to the solvent (Additional file 1: Fig. S1). Regarding the crystal ligands, some of their physicochemical properties were calculated: the molecu-lar weight (MW), the octanol/water partition coefficient (AlogP), the polar surface area (PSA), the embranchment count (EC), the number of hydrogen bond acceptors (HBA), the number of hydrogen bond donors (HBD), the ring count (RC) and the number of rotatable bonds (RB). For more details, see “Methods” section and Ref. [26]. The distribution of these properties, spreading on a wide range (Additional file 1: Fig. S2), shows a good diversity of the ligands. All these considerations make this dataset of 100 protein/ligand complexes adequate for the assess-ment of the docking programs.
Evaluation of the docking programs
All docking programs follow the same general scheme consisting of two main steps: first, the program generates a large set of poses by exploring multiple conformations of the ligand into the binding site, with a rough evalua-tion to reject the most unrealistic ones, and second, the retained poses are more finely evaluated and ranked using a scoring function. The four programs considered here have different search algorithms. Glide [4, 29] relies on a rough systematic search in a cuboid grid, followed by a refinement using Monte Carlo sampling. The pose gen-eration of Surflex [5] and FlexX [6] is based on an incre-mental construction algorithm where the small molecule is decomposed in fragments that the program attempts to place in the binding site. The particularity of Surflex is that the positioning of the fragments uses a proto-mol that fits the site surface. The conformational search method of Gold is based on a genetic algorithm. Con-sidering the scoring functions, Surflex is mostly based on empirical energetic terms [30]. Glidescore, FlexX and
Piecewise Linear Potential (PLP, one of the Gold scoring functions) derive from the empirical ChemScore function [31]. Goldscore (another Gold scoring function) [3, 32] is a sum of empirical terms and force field-like terms for van der Waals and Coulombic energies. In Glide, Emodel
[4] combines Glidescore and nonbonded energy terms. For each program, 30 ligand poses per protein tar-get were requested. With Glide the two available con-formational sampling methods were used: the standard
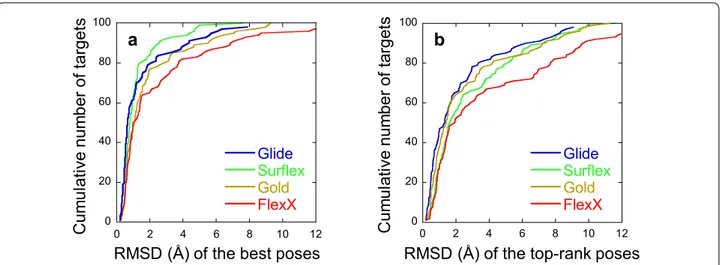
precision (SP) and the extra-precision (XP) methods. The obtained poses were ranked using several scoring func-tions, when available, i.e., either Glidescore or Emodel for Glide and either PLP or Goldscore for Gold. Our analy-ses focus on both the ability of the programs to gener-ate a correct docking pose and to top-rank it. To assess the quality of the poses, the root-mean-square deviation between them and the conformation of the correspond-ing ligand in the crystal structure was used, based on heavy atoms. This RMSD calculation takes into consid-eration the symmetry of the ligands (see “Methods” sec-tion for more details). A pose is considered correct or good when its RMSD from the crystal structure is less than 2 Å, a value corresponding to thermal fluctuations. The summary of the results, given in Table 1, shows that, although a total of 3000 poses were requested for the 100 targets, none of the programs did generate and retain such a number. The obtained poses ranged between 392, for Glide-XP, and 2915, for FlexX. However, a high num-ber of poses does not guarantee their good quality. For instance, there are a little more poses generated with FlexX than with Surflex (2915 and 2899, respectively), but significantly fewer correct poses (910 against 1152) and these poses belong to less targets (65 and 84, respec-tively). Additionally, the generation of good poses does not guarantee their good ranking. For instance, Surflex generated much more correct poses than Glide-XP (1152 against 210), belonging to significantly more targets (84 vs 74). However, the number of targets for which a good pose is ranked in the top 4 is slightly smaller for Surflex than for Glide-XP (72 vs 73) and the gap is widened for the top 1 pose (56 against 68).
These preliminary results suggest that the efficacy of the programs for the sampling procedure may be ordered as follows: Surflex > Glide-SP > Gold > Glide-XP > FlexX, and for the top-ranking, the scoring functions efficacy as follows: Glidescore ≥ Emodel > PLP > Goldscore > Sur-flex > FlexX.
A more detailed comparison between the scoring func-tions of the same program, i.e., Glidescore and Emodel on the one hand and PLP and Goldscore on the other hand, is given in Additional file 1: Fig. S3, upper panels. It shows that Glidescore > Emodel and confirms that PLP > Gold-score. Therefore, in the rest of the work, unless otherwise stated, for Glide, Glide-SP with Glidescore will be consid-ered, and for Gold, the scoring function PLP will be taken into account.
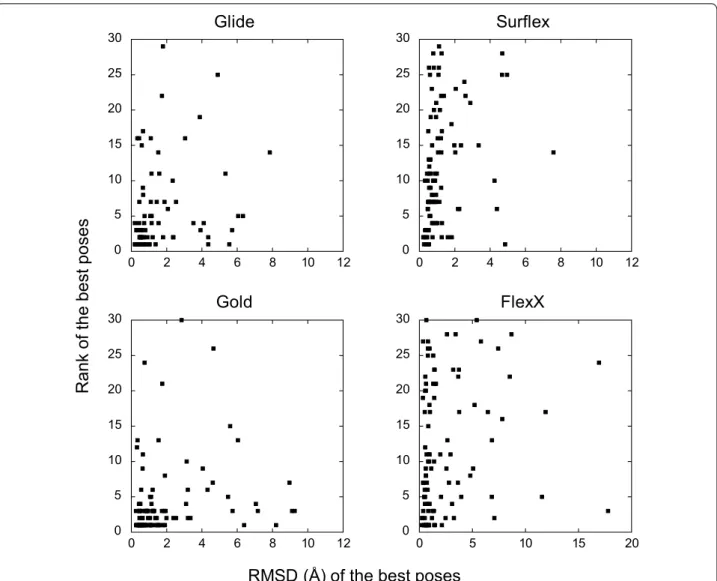
them, i.e., when the top-rank poses are considered. Note that for Glide and Surflex, for all targets, the best pose has an RMSD under 8 Å and for Gold under 10 Å. For these three programs, the best poses with the highest RMSDs correspond to ligands that occupy correctly the cavity as to their shape, but with top-to-tail positions relative to the crystallographic ones. By contrast, for FlexX, the best poses may reach an RMSD of 18 Å, corresponding
to positions outside of the binding site, at the edge of the cavity. However, in all cases, even when a program suc-ceeds in finding good poses, their ranking may still be unsatisfactory. Indeed, the rank of the best poses ranged between 1 and 30 with all programs. As observed in Fig. 2, being a correct best pose, with RMSD < 2 Å, does not prevent from being in the bottom of the ranking. This is especially true for Surflex and FlexX, where 48 and 46% Table 1 Comparison of the efficacy of the programs
The comparison is made for ligand conformational sampling (columns 1–3) and pose scoring (columns 4 and 5). From the requested 3000 poses per program (30 poses per target, for 100 targets), the number of obtained poses is given in the first column. Of these poses a certain number is correct, with RMSD < 2 Å from the crystal position, (column 2) and corresponding to a number of targets (column 3). The number of targets whose correct poses are ranked in the top 4 are given in column 4 and those whose correct poses are top-ranked are given in column 5. The number of targets with a correct pose obtained with the USC method, based on the docking results, is reported in the last line (see the “USC method” section below)
Programs: sampling methods
and scoring functions
Conformational sampling Scoring
1-Number
of poses obtained 2-Number of correct poses 3-Number of targets with a correct pose 4with a correct pose -Number of targets ranked in the top 4
5-Number of targets with a correct pose ranked as the top 1
FlexX 2915 910 65
FlexX 57 52
Surflex 2899 1152 84
Surflex 72 56
Glide-SP 2393 624 79
Glidescore 75 65
Emodel 72 65
Glide-XP 392 210 74
Glidescore 73 68
Emodel 73 66
Gold 1447 330 77
PLP 74 64
Goldscore 73 60
USC based on docking
results 87
0 2 4 6 8 10 12
0 20 40 60 80 100
Cu
mu
la
tive
num
ber
of targets
RMSD (Å) of the top-rank poses
Glide
Surflex Gold FlexX
0 20 40 60 80 100
0 2 4 6 8 10 12
Cu
mu
la
tive
num
ber
of targets
RMSD (Å) of the best poses
Glide
Surflex Gold FlexX
b
a
of the correct best poses, respectively, are placed beyond the 10th rank. For Glide and Gold, these numbers fall to
13 and 8%, respectively.
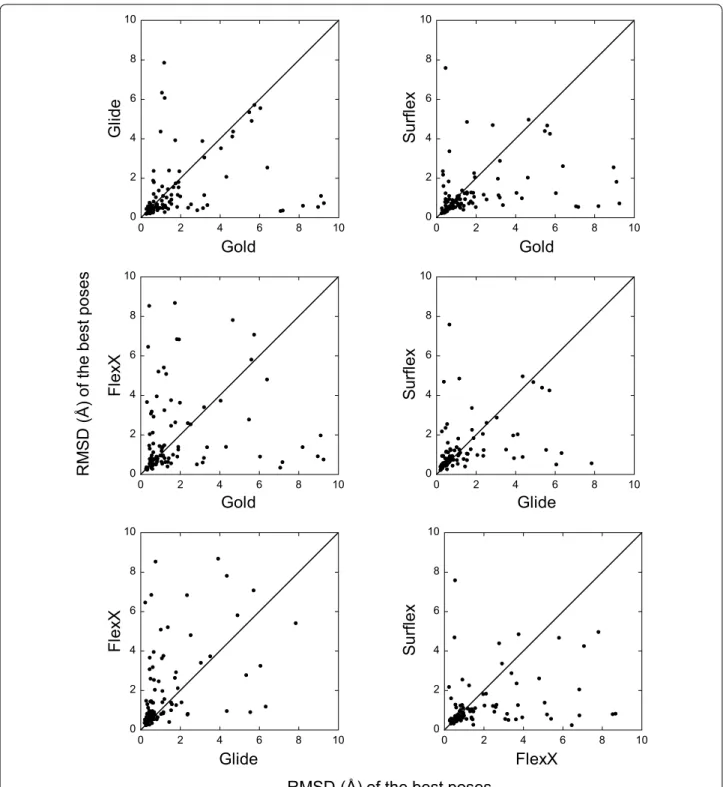
For each target, the best poses (or the top-rank ones) obtained with one program were compared to those obtained with another program. This comparison shows the absence of correlation between the results (Figs. 3, 4). Indeed, for many targets, while a program finds a best pose with an RMSD lower than 2 Å (or top-rank it), another program would be completely unable to find any correct pose for the same target. For instance, if we con-sider the two programs with comparable performances, namely Glide and Gold, whose best poses were correct for 79 and 77 targets, respectively, they have in common only 67 targets with correct poses, not 77 as could be expected.
Despite the lack of correlations, for 28 targets, all programs succeeded in finding a correct pose and to top-rank it. So these targets will be referred to as “easy”. On the contrary, there were 6 “hard” targets, for which the search algorithms of all programs failed in finding any correct pose. The list of all targets is given in Additional file 2: Table S1, where the easy target cells are colored in green and those of the hard targets in red.
Is the success of docking influenced by some protein or ligand properties?
In order to identify the exogenous factors that could influence the pose prediction accuracy, the protein and ligand properties presented above were used, i.e., for the targets, two properties concerning the protein in its
RMSD (Å) of the best poses
x
e
lf
r
u
S
e
d
il
G
X
x
e
l
F
d
l
o
G
Rank
of the
best
pose
s
0 5 10 15 20 25 30
0 5 10 15 20 25 30 0 5 10 15 20 25 30
0 5 10 15 20 25 30
0 2 4 6 8 10 12
0 5 10 15 20
0 2 4 6 8 10 12
0 2 4 6 8 10 12
entirety (the resolution of the crystal structure and the protein family), and three properties concerning solely the binding site (the size of the cavity, its FCA and its
exposure to solvent), in addition to eight properties of the ligands (MW, ALogP, PSA, EC, HBA, HBD, RC and RB).
0 2 4 6 8 10
0 2 4 6 8 10
Gold
Gl
id
e
0 2 4 6 8 10
0 2 4 6 8 10
Gold
Su
rfle
x
0 2 4 6 8 10
0 2 4 6 8 10
Gold
Fl
ex
X
0 2 4 6 8 10
0 2 4 6 8 10
Glide
Fl
ex
X
0 2 4 6 8 10
0 2 4 6 8 10
Glide
Su
rfle
x
0 2 4 6 8 10
0 2 4 6 8 10
FlexX
Su
rfle
x
RMSD (Å) of the best poses
RM
SD
(Å)
of the
best
pose
s
The easy targets have nothing in common, neither the properties of the target itself nor those of the corre-sponding ligand. Indeed, there is no significant difference between these properties and those of all other targets, or more importantly, of those of the hard targets, as given
by either the Student t-test or the Mann–Whitney–Wil-coxon test, according to the normality of the property distribution, with a significance threshold of 1% (see Additional file 1: Fig. S4). All the properties are reported in Additional file 2: Table S1.
0 2 4 6 8 10
0 2 4 6 8 10
0 2 4 6 8 10
0 2 4 6 8 10
0 2 4 6 8 10
0 2 4 6 8 10
0 2 4 6 8 10
0 2 4 6 8 10
0 2 4 6 8 10
0 2 4 6 8 10
0 2 4 6 8 10
0 2 4 6 8 10
Gold
Gl
id
e
Gold
Su
rfle
x
Gold
Fl
ex
X
Glide
Fl
ex
X
Glide
Su
rfle
x
FlexX
Su
rfle
x
RMSD (Å) of the top-rank poses
RM
SD
(Å)
of the
top-rank
poses
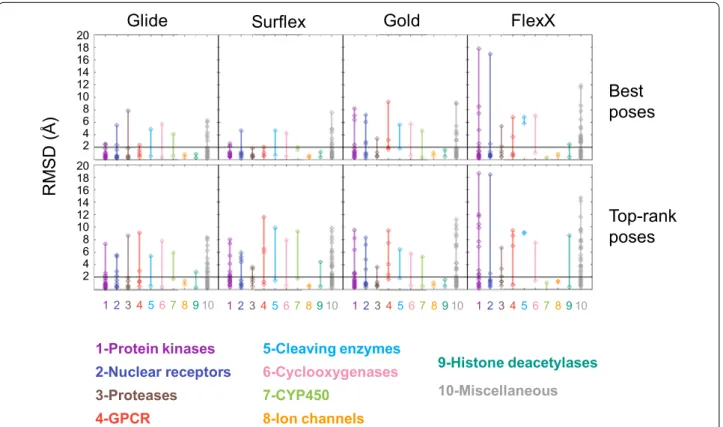
There is no obvious relationship between the protein families and the success of the programs in finding the correct pose or in top-ranking it (Fig. 5). Indeed, con-cerning the top-rank poses obtained with any of the four programs, in a given family there are members with high and others with low RMSD, apart from a few exceptions, like the ion channels (2 targets) for which all programs succeeded (low RMSD). A similar observation can be made concerning the best poses: for most families, the programs succeeded for some targets but not for others, like the nuclear receptors (11 targets), with Surflex, and the proteases (6 targets), with Glide. This is true, despite the existence of some families for which a given program succeeded for all their members, like the proteases (6 tar-gets) with Surflex.
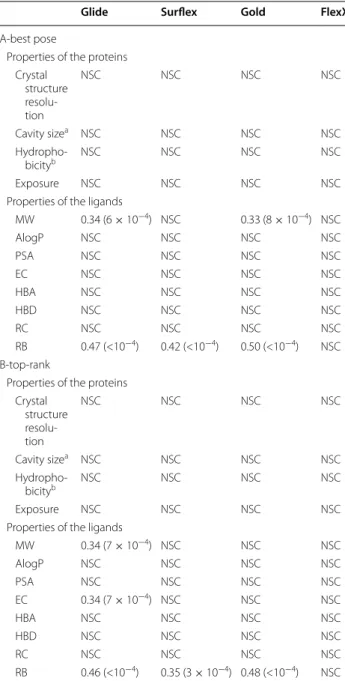
For all the other protein or ligand properties, the Spear-man correlation coefficients between the descriptors and the RMSD of both the best poses and the top-rank ones were calculated (Table 2). This correlation was adopted because the descriptors do not follow normal distribu-tions and we do not presume the existence of linear rela-tionships between them and the RMSDs. The correlation is considered as significant when the p-value is less than 10−3, the limit over which, in our case, a relationship
between the variables is not visible in the plots.
We observe that none of the programs performance are correlated to the protein properties. The performance of FlexX is not even correlated with any property of the ligands. Glide, Surflex and Gold results are impacted by the number of rotatable bonds, for either the scoring or the conformational sampling of the small molecules. Indeed, the performance is degraded (increasing RMSD) with increasing number of RBs. In addition, there are also small correlations of MW with Glide and Gold per-formances, and the scoring function of Glide with the number of embranchments (EC) of the small molecules. The correlation with MW may be due to the increasing number of RBs for larger molecules, which is reflected by the significant correlation between MW and RB (0.63). Therefore, except for the number of rotatable bonds that may make the sampling and scoring of the ligand difficult with Glide, Surflex and Gold, there is no real influence of the properties of the protein or the ligand on the success of the four programs in finding the right pose.
The influence of some of the properties considered here on the performance of the four docking programs was reported in the literature. We will cite the results obtained on Gold and Glide by Perola et al. [8], Kel-lenberger et al. [24] and Li et al. [12], on Surflex by Li et al. [12] and Kellenberger et al. [24] and FlexX by only
Surflex
Best
poses
X
x
e
l
F
d
l
o
G
e
d
il
G
Top-rank
poses
1 23 4567 8910 123 45 678910 1 234 567 8910 123 4567 8910 20
16
12
6
2 14 18
10 8
4
20
16 12
6
2 14 18
10 8 4
1-Protein kinases
2-Nuclear receptors
3-Proteases
4-GPCR
5-Cleaving enzymes
9-Histone deacetylases
6-Cyclooxygenases 7-CYP450
8-Ion channels
10-Miscellaneous
RM
SD
(Å
)
Kellenberger et al. [24]. In these works, for Gold, Glide, Surflex and FlexX, the docking accuracy seemed to increase for ligands with higher percentage of buried solvent accessible surface area (SASA) and to decrease
with the number of rotatable bonds. Li et al. [12] also investigated the effect of the binding pocket hydropho-bicity and reported that the performance of Glide and Surflex is better for indisputably hydrophobic or hydro-philic binding pockets than for pockets with intermedi-ate hydrophobicity, while Gold tends to perform better on only hydrophobic pockets. Kellenberger et al. [24] reported that Gold, Surflex, and FlexX perform better on small binding sites (<700 Å3), while Glide performs
bet-ter on medium binding sites (700–1500 Å3), and that all
programs have relatively better performance for small hydrophobic ligands. Except for the rotatable bonds, these results may seem in contradiction with our conclu-sions about the influence of the protein and ligand prop-erties. These apparent discrepancies are merely due to the difference between our approach, which consists of calculating the correlation between the properties and RMSDs, and the approach presented in these articles, which consists of clustering the properties into discrete groups and considering the percentage of good RMSDs in each group. If we had adopted the latter approach, our results would have been in complete agreement with the published ones, but we preferred not to do so, because the groups are not equally populated, neither in our case nor in the cited articles. Indeed, the groups at the edges are much less representative, which may yield misleading conclusions, especially in the absence of statistical signifi-cance estimations of the differences among these groups. Note that one of the indicators used in the cited articles, namely the percentage of the ligand SASA, is not explic-itly present here. However, this indicator is comparable to the binding site exposure, which represents the open-ness of the cavity, since the more the cavity is closed, the more the ligand is buried. We preferred the exposure of the binding site to the percentage SASA of the ligand, because the latter is based on the prior knowledge of the structure of the protein–ligand complex, which is far from being the case when docking is needed.
Comparison with virtual screening
The poor correlations observed above contrast with the observations based on the results of the virtual screen-ing (VS) that we performed recently with these four programs, using the same procedure (except for Gold, where the scoring function Goldscore was used in the virtual screening study) [26]. In VS, it was observed that the performances (BEDROC scores) of all four programs are somehow influenced by the small molecule proper-ties. Therefore, one may ask if there is any relationship between the results of the docking presented here and those of the virtual screening. To answer this question, for each target, the BEDROC score obtained with a pro-gram is plotted versus the RMSD of its top-rank pose Table 2 Spearman correlation between the programs
per-formance and the properties of the proteins or the ligands
The correlations are calculated between the properties of the targets or the ligands and the RMSD of the best poses (A) obtained by docking with the 4 programs or the top-rank poses (B). The p-values are in parentheses. The correlations are considered non-significant for p-value ≥ 10−3, and therefore they are omitted
NSC no significant correlation
a Cavity size = total number of the cavity heavy atoms at 4 Å from the surface b Hydrophobicity of the cavity = fraction of carbon atoms (FCA) among the cavity heavy atoms
Glide Surflex Gold FlexX
A-best pose
Properties of the proteins Crystal
structure resolu-tion
NSC NSC NSC NSC
Cavity sizea NSC NSC NSC NSC
Hydropho-bicityb NSC NSC NSC NSC
Exposure NSC NSC NSC NSC
Properties of the ligands
MW 0.34 (6 × 10⁻⁴) NSC 0.33 (8 × 10⁻⁴) NSC
AlogP NSC NSC NSC NSC
PSA NSC NSC NSC NSC
EC NSC NSC NSC NSC
HBA NSC NSC NSC NSC
HBD NSC NSC NSC NSC
RC NSC NSC NSC NSC
RB 0.47 (<10−4) 0.42 (<10−4) 0.50 (<10−4) NSC B-top-rank
Properties of the proteins Crystal
structure resolu-tion
NSC NSC NSC NSC
Cavity sizea NSC NSC NSC NSC
Hydropho-bicityb NSC NSC NSC NSC
Exposure NSC NSC NSC NSC
Properties of the ligands
MW 0.34 (7 × 10⁻⁴) NSC NSC NSC
AlogP NSC NSC NSC NSC
PSA NSC NSC NSC NSC
EC 0.34 (7 × 10⁻⁴) NSC NSC NSC
HBA NSC NSC NSC NSC
HBD NSC NSC NSC NSC
RC NSC NSC NSC NSC
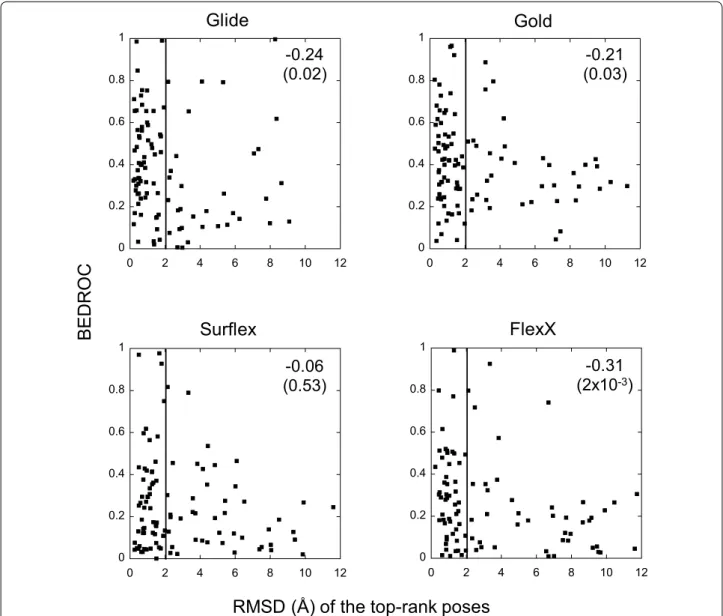
(Fig. 6), because only this pose is taken into account in VS ranking and therefore in the BEDROC score. This comparison should be taken with its limitations, because in docking we only consider one ligand whereas in VS we consider an entire chemical library. However, this comparison is still legitimate, because docking is the basis of VS and in our case, all VSs were done on the target crystal structures that were used here for dock-ing. Concerning Gold, the RMSD of the poses ranked with Goldscore is used in this subsection since only this scoring function, which yielded better results than PLP
for VS, was adopted for the BEDROC scores. In Fig. 6,
it can be observed that, whatever the program, there is no exploitable correlation between the results of docking and VS. For FlexX this correlation is higher than the oth-ers, but it mainly concerns weak results in both meth-odologies. If we only consider the targets with successful VS (BEDROC > 0.5), Glide and Gold failed in docking (RMSD ≥ 2) for 21 and 23% of them, respectively. This number of targets raises to 27% for Surflex and 36% for FlexX, but in this case the total number of targets with successful VS is much smaller than for Glide and Gold. So for the four programs, the relationship between docking and VS is not exploitable in practice. Indeed,
0 0.2 0.4 0.6 0.8 1
0 2 4 6 8 10 12
0 0.2 0.4 0.6 0.8 1
0 2 4 6 8 10 12
0 0.2 0.4 0.6 0.8 1
0 2 4 6 8 10 12
0 0.2 0.4 0.6 0.8 1
0 2 4 6 8 10 12
RMSD (Å) of the top-rank poses
BEDRO
C
Glide
Surflex
Gold
FlexX
-0.24
(0.02)
(0.03)
-0.21
-0.06
(0.53)
(2x10
-0.31
-3)
an excellent VS result may be obtained with poor dock-ing poses, and vice versa. This can be illustrated by the case of the target pur2, which obtained with Glide an excellent BEDROC score close to 1.0, the best possible score. In this VS, the ligand that was used in the crystal structure was ranked among the most active molecules, despite its top-to-tail pose with respect to the X-ray position, with an RMSD of 8.3 Å. On the opposite, there are numerous targets with excellent docking results, whose RMSD of the top-rank pose is close to zero, which obtained a very poor BEDROC score, close to zero, the worst score. This shows that, contrary to a widespread belief, improving docking does not necessarily help in improving VS, at least with the semi-rigid procedure (flexible ligand and rigid protein).
These observations are in good agreement with those of Cummings et al. [9], who reported the results of vir-tual screening on 5 different targets and docking on 31 protein–ligand complexes corresponding to these tar-gets. The ligands in the complexes were included in the VS chemical libraries. In this case too, no correlation was observed between the rank of the compounds in VS and the RMSD of ligands with respect to the X-ray poses. However, all these observations do not exclude that, for some cases, it may happen that the performance of VS is improved when good poses are found by docking [33].
Improving the chance of identifying the correct pose As observed above, there are programs with high effi-ciency in finding correct poses, like Surflex, which cor-rectly positioned the ligand for 84 targets, but only identified (or top-ranked) 56 among them, whereas other programs are maybe less efficient in finding correct poses, but with better scoring functions, like Glidescore, which was able to top-rank correct poses for 65 targets over the 79 that were well-positioned (Table 1). There-fore, the combination of the skills of these two programs, or others, may improve the docking results. Two different ways of combining the results were tested, the standard rescoring procedure and the United Subset Consensus (USC) described in [34].
Rescoring
The poses obtained by each program were rescored using all the scoring functions considered in Table 1. The soft rescoring procedure, which slightly optimizes the ligand to accommodate the pose that was provided from another program, was applied (see Methods for details). For the sake of homogeneity and comparability between the programs, the poses obtained by docking with a pro-gram were also rescored with the same propro-gram. Rescor-ing with Emodel did not produce any improvements to the ranking and was therefore discarded again. However,
rescoring with Goldscore gave clearly better results than with PLP, as observed in Additional file 1: Fig. S3 lower panels, therefore, Goldscore was adopted for rescoring. The results of the retained functions (Glidescore, Surflex,
Goldscore and FlexX) are given in Table 3A and B. After rescoring, only small improvements in the results were observed comparatively to the docking. Indeed, whereas after docking the number of targets with a correct top-rank pose (RMSD < 2 Å), obtained by the retained sampling/scoring methods, was in the interval of values [52, 65] for the four programs (Table 1, column 5), after rescoring, this number ranged in the interval [50, 70] as observed in Table 3A, lines 1–4. In addition, con-trarily to what was expected, conformational sampling with Surflex and rescoring with Glidescore yielded rather poor results, with correct poses top-ranked for only 63 targets. Note that the best result, with 70 correct top-rank poses, was obtained using the sampling with Glide and the rescoring with Goldscore.
For the top-4 poses (Table 3B), i.e., when at least one correct pose is ranked in the top 4, the improvements are still less significant. Indeed, whereas with the sim-ple docking, the number of targets with correct top-4 rank poses was in the interval [57, 75] (Table 1, column 4), after rescoring, this number was in the interval [62, 76], the highest value being obtained with the sampling and rescoring with Glide. Surprisingly, whereas the poses obtained with Surflex were the closest to the X-ray
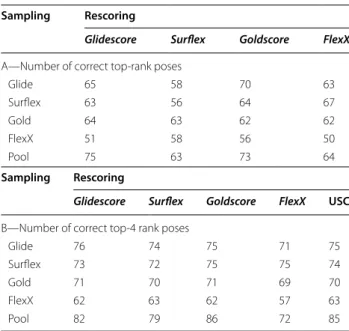
Table 3 Assessment of the rescoring results
Number of targets whose top-rank poses (A) or top-4 rank poses (B) are correct after rescoring. Either all poses obtained with a given program were rescored with all programs (lines 1–4) or all poses were grouped in one pool and rescored with all programs (last line). The results of USC are reported in the last column of (B)
Sampling Rescoring
Glidescore Surflex Goldscore FlexX
A—Number of correct top-rank poses
Glide 65 58 70 63
Surflex 63 56 64 67
Gold 64 63 62 62
FlexX 51 58 56 50
Pool 75 63 73 64
Sampling Rescoring
Glidescore Surflex Goldscore FlexX USC B—Number of correct top-4 rank poses
Glide 76 74 75 71 75
Surflex 73 72 75 75 74
Gold 71 70 71 69 70
FlexX 62 63 62 57 63
positions, rescoring them with other scoring functions did not significantly help in top-ranking them. Indeed, Surflex was able to correctly position the ligand for 84 targets (Table 1, column 3), and the best top-4 ranking of these poses was obtained with Goldscore and FlexX, for 75 targets, which is only slightly better than the initial docking results obtained by Surflex scoring, with 72 tar-gets (Table 1, column 4). For 3 of the targets (hivpr, pde5a and xiap), whose ligands were correctly positioned with Surflex, none of the rescoring programs was able to rank the correct poses between the top 4, so what about the X-ray poses themselves? Would they be well ranked?
To answer this question, the crystal structure poses were rescored following the same procedure as above, with a slight optimization to remove clashes, and ranked among the other poses. The results are given in Table 4, where we can observe the poor ranking given by the programs.
Less than 10 crystal ligands were top-ranked and only between 13 (with Surflex) and 42 ligands (with Gold-score) were ranked in the top-4 poses. However, the X-ray pose is ranked above all incorrect ligand poses (whose RMSD ≥ 2 Å) for 55 targets by Glide and Gold, for 33 targets by FlexX and for 30 targets by Surflex. This aver-age result could be due to the quality of the scoring func-tions, but also to the quality of the crystal structures for which the slight optimization may not be sufficient to satisfy the scoring functions energy criteria. Note that for 2 (fnta and fkb1a) of the 6 hard targets cited above, for which the best poses were incorrect, the ligand crys-tal structure was ranked between the top-4 poses by Gli-descore, showing that for these 2 targets, the failure of docking is not due to the scoring function but to the con-formational sampling.
Despite these observations, the ranking of the ligands that were positioned by the programs and which there-fore satisfy the scoring functions energy criteria still has to be improved. For this purpose, for each target, all the poses obtained with the four programs (up to 120 poses/ target) were gathered in one pool and re-ranked. The results are given in Table 3, last line. In this pool, there are 94 targets with a correct best pose given by at least
one of the four programs. Therefore, it is not surprising that the number of targets with a correct top-rank pose is significantly improved compared to docking, rang-ing from 63 to 75 targets, to be compared to the inter-val [52, 65] for docking. In addition, in this case, the best poses are not ranked far, since in the top-4 poses there is at least one correct pose for a number of targets in the interval [72, 86], which is significantly higher than that obtained with docking, [57, 75]. This means that by limit-ing the analysis of the results to the top-4 ranked poses, one may have between 57 and 75% chance of finding the right ligand position by docking and between 72 and 86% chance by rescoring the pool poses, the latter being obtained by Goldscore. In other words, to obtain an hon-orable yield, one needs to use several docking programs and rescore all the poses gathered in one pool, which represents a heavy, time-consuming procedure. A much easier and rapid one may be used, the United Subset Consensus (USC).
USC method
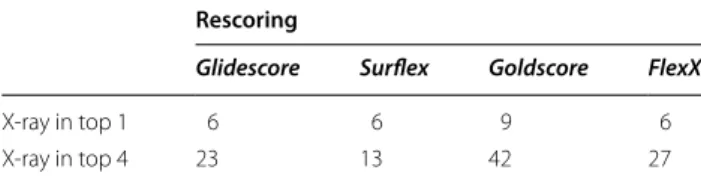
The USC method is based on the observation that there are no correlations between the RMSDs obtained with the different programs, neither considering their best poses nor their top-rank ones. This observation was pre-sented above, in the section “Evaluation of the docking programs” (Figs. 3, 4). USC applied to docking consists of gathering, for each target, a subset of 4 poses made of the top-rank ones taken from each of the 4 programs, then the 4 second-rank poses, etc. Therefore, contrarily to docking or rescoring, with USC the poses are consid-ered four by four. Because of the absence of correlation between the results of the programs, and therefore their variety, using USC by considering a subset made of the union of the four programs results may improve the yield, as it was observed in [34]. Here, for the sake of compa-rability with the efficiency of the programs, for each tar-get, only the first USC element, made of the 4 top-rank poses, is compared to the top-4 poses ranked by the programs. USC was applied to both the results of dock-ing and rescordock-ing. Whereas USC based on the rescor-ing did not improve the results as observed in Table 3B, USC based on the results of the initial docking brings a spectacular improvement. Indeed, in this case, 87 targets were found to have at least one pose with RMSD < 2 Å from the X-ray structure (Table 1, last line), which has to be compared to the docking range [57; 75]. This result is better than any of the ones obtained for the top-4 poses whether with docking or rescoring, [57; 86], although it is close to the rescoring results when considering the pool of poses rescored by either Goldscore or Glidescore. However, the advantage of USC is its rapidity and ease of use compared to the rescoring procedure, which is long Table 4 Assessment of the rescoring results for the X-ray
poses
Number of targets whose X-ray pose is ranked in top 1 or top 4, when added to the pool of poses for rescoring
Rescoring
Glidescore Surflex Goldscore FlexX
X-ray in top 1 6 6 9 6
and fastidious, and it increases the chance of finding the good pose, within only 4 poses, by 12–30% compared to docking.
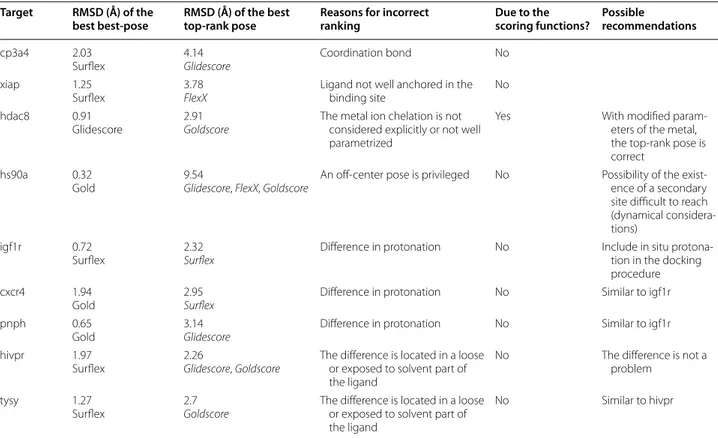
Are all the top-ranking failures due to scoring functions? To answer this question, let us consider again the pool of poses used in the rescoring subsection. As presented above, there are 94 targets in this pool with at least one correct best pose, obtained by one program or another. Of these targets, 9 could not be top-ranked by any of the four programs. They are colored in pink, in Additional file 2: Table S1. A close examination of these targets shows various reasons for the ranking failure. The obser-vations are summarized in Table 5, where are reported the RMSD of the best best-pose obtained by any of the four programs, and the RMSD of the best top-score pose, which consists of the top-score pose with the smallest RMSD, among the four top-score poses.
1. Two targets seem not to be well adapted for dock-ing: cp3a4, whose best pose was considered as cor-rect because it is very close to the limit RMSD of 2 Å. It is a cytochrome and its ligand establishes a coordination bond with the iron atom of its heme.
Such an interaction is not well handled by docking programs, for which the right pose presents a high van der Waals repulsion. xiap has a ligand that is not anchored in the binding pocket, but binds super-ficially between two adjacent proteins in the crys-tal lattice (Fig. 7a). Therefore, considering the small number of protein–ligand interactions, it is not sur-prising that the best pose was not top-ranked.
For three targets, hdac8, hs90a and igf1r, the correct top-rank pose was found after docking but not after rescoring. For hdac8, it was found by Gold when scoring with PLP and for hs90a and igf1r, by Glide with Glidescore. There is a variety of reasons why the rescoring did not top-rank a correct pose.
2. For hdac8, the ligand participates in the chelation of a zinc ion in its proximity. In the scoring function PLP, there is a specific term for the metal, which is not the case in Goldscore. This may explain why the top-rank pose was correct after docking but not after rescoring. In addition, in PLP the metal term param-eters [35] are different from those of ChemScore [31] and the other functions (Glidescore and FlexX) based on it. When rescoring the poses of the pool with PLP, Table 5 Analysis of the reasons for the 9 targets ranking failure
For each ligand, all poses of the pool were ranked by each program and we only consider the top-rank pose with the smallest RMSD, without any consideration of the program
Target RMSD (Å) of the
best best-pose RMSD (Å) of the best top-rank pose Reasons for incorrect ranking Due to the scoring functions? Possible recommendations
cp3a4 2.03
Surflex 4.14Glidescore Coordination bond No
xiap 1.25
Surflex 3.78FlexX Ligand not well anchored in the binding site No
hdac8 0.91
Glidescore 2.91Goldscore The metal ion chelation is not considered explicitly or not well parametrized
Yes With modified
param-eters of the metal, the top-rank pose is correct
hs90a 0.32
Gold 9.54Glidescore, FlexX, Goldscore An off-center pose is privileged No Possibility of the exist-ence of a secondary site difficult to reach (dynamical considera-tions)
igf1r 0.72
Surflex 2.32Surflex Difference in protonation No Include in situ protona-tion in the docking procedure
cxcr4 1.94
Gold 2.95Surflex Difference in protonation No Similar to igf1r
pnph 0.65
Gold 3.14Glidescore Difference in protonation No Similar to igf1r
hivpr 1.97
Surflex 2.26Glidescore, Goldscore The difference is located in a loose or exposed to solvent part of the ligand
No The difference is not a
problem
tysy 1.27
Surflex 2.7Goldscore The difference is located in a loose or exposed to solvent part of the ligand
the best pose was top-ranked by this scoring func-tion. Incidentally, hdac8 was the only target for which the result of rescoring was better with PLP than with Goldscore.
3. For hs90a, in docking, only Glide succeeded in top-ranking a correct pose (RMSD = 0.46 Å). But this program was confused during the rescoring process by the presence of poses coming from FlexX, relegat-ing its top-pose to lower ranks. Indeed, FlexX cre-ated poses at the edge of the binding site. When these
poses were added to the pool, an off-center pose was privileged by Glide, Gold and FlexX itself, with an RMSD of 9.54 Å (Fig. 7b). Since visually it was not obvious why the crystal position would be better than this off-center pose, we minimized the energy of all protein–ligand complexes, using the CHARMM36 force field [36] for the protein and the CHARMM General Force Field (CGen) [37] for the small mol-ecule. These minimizations confirmed the results of the scoring functions, i.e., most of the off-center pose complexes had the lowest energies and the best pose (RMSD = 0.32 Å) was in the 59th rank. In addition, the first correct pose (RMSD = 1.88 Å) was in the 15th rank. This is due to the fact that there are more interactions between the protein and the ligand in the off-center pose than in the crystal pose. There-fore, in such a case, modifying the scoring functions does not seem to be the solution for improving the detection of the right pose. The difference between these poses could be due to entropy considerations or to dehydration of the binding site during the ligand binding, but this does not seem likely considering the conformations of the ligand and the sites. However, it appears more likely that the ligand could encounter dynamical difficulties while reaching the off-center pocket, which can be monitored by directed molec-ular dynamics, out of the scope of the present arti-cle. Finally, there is also a small probability that both poses are possible and the crystallization conditions have privileged one of them.
4. Some artifacts are observed in the upstream prepara-tion of the ligands. For igf1r, there is a problem in the protonation of the ligand N5 and N6 nitrogen atoms (Fig. 7c). It is obvious from the crystal structure that the proton should be on N6 to allow the establish-ment of a hydrogen bond with the protein. However, the ligand provided on the DUD-E website [27] is protonated on N5. The ligand preparation programs, like MarvinSketch (Marvin 6.1.6, 2014, http://www. chemaxon.com) or LigPrep (Schrödinger Release 2016-4: LigPrep, Schrödinger, LLC, New York, NY, 2016), show that N5 and N6 have the same pKa, and depending on the prior assignment of the bonding order, the protonation is made on either one or the other nitrogen. A posteriori, we have monitored the protonation of this ligand using these two programs starting from either the SMILES format or the pdb coordinates. In all cases, by default, the protonation is made on N5, and the protonated N6 was not pro-posed among all possible tautomers of this ligand at pH 7 ± 2. To obtain a protonation on N6, the bond order should be given explicitly and manually in this xiap
a
hs90a
Top-rank pose Best pose
b
igf1r
N5
N6
c
d
hivprFig. 7 Representative structures to illustrate the top-ranking failure which is not due to scoring functions. a Structure of the crystallo-graphic dimer of xiap, where chain A is in blue and chain B in red. The ligand is in yellow sticks. It is obvious that there are too few contacts between the protein and the ligand to allow the latter anchor-age. b Structure of hs90a in blue with the ligand in yellow spheres.
Left the ligand is in its best pose (RMSD = 0.32 Å), in the crystal-lographic binding pocket. Right the ligand is in the best off-center pose (RMSD = 9.54 Å), top-ranked by Glide, Gold and FlexX after the rescoring of the pool of poses. c Crystal structure of the ligand of igf1r with its closest protein environment. It shows the necessity of protonating the N6 atom to allow it to establish a hydrogen bond with a carbonyl from the protein backbone. The carbon atoms are in
sense. Then, the protonated N6 is obtained as the most populated species and N5 is not present among the proposed tautomers, showing an issue in the pro-tonation procedure of the programs. Therefore, in the case of no prior knowledge of the ligand pose, as simulated here, only the N5 protonated ligand is given for docking and it is not surprising that the scoring functions favor a pose where the ligand is slightly shifted in order to avoid repulsive electro-static forces. To avoid such an artifact, it would be preferable that the protonation of a ligand is made during the docking procedure, in order to adapt it by considering the protein environment. A similar prob-lem was observed for cxcr4 and pnph.
5. In some cases, the relatively high value of the RMSD of the top-score pose does not present any drawback because the difference with the correct pose is only located in a loose or solvent-accessible part of the ligand. This is the case of hivpr (Fig. 7d) and tysy.
These observations show that for only one of the nine targets, hdac8, the problem of top-ranking incor-rect poses could be resolved by improving the scoring functions.
Conclusions
In this study, we present the results of the evaluation of 4 docking programs, Glide, Gold, Surflex and FlexX. All the conclusions are only applicable to semi-rigid dock-ing, where the protein structure is fixed in the favorable conformation, since it is taken from the crystal structure of the complex and the ligand starting structure is the energy minimum conformer. We observe that, generally, the programs present good performances in positioning correctly the ligand in the binding site. This is especially true for Surflex, with its 84 well-positioned ligands. Alto-gether, the programs positioned correctly the ligands of 94 targets over 100. However, they have some difficulties in the ranking of the generated poses, indicating some weaknesses in the scoring functions. Apart from the number of rotatable bonds of the ligands, which is related to their molecular weight, there is no correlation between either the scoring functions or the sampling procedure of these docking programs and the main physicochemical properties of the ligands or the proteins. Consequently, there is no particular program or protocol that may be recommended for specific proteins or ligands, although some programs seem to work globally better than the others, like Glide and Gold, with a correct top-rank ligand for more than 60% of the targets. This performance is much better than that observed in virtual screening with the same programs, where a good BEDROC value
(over 0.5) was obtained for less than 30% of the targets. In fact, for each program, the comparison of its perfor-mance for docking and virtual screening showed the absence of correlation between these two aspects of the work. A well-positioned and top-ranked ligand in dock-ing does not guarantee its good rankdock-ing durdock-ing VS, and vice versa. Therefore, improving the scoring functions for docking may be necessary but clearly insufficient for improving the virtual screening performance.
Methods
Preparation of the DUD-E database
Preparation of the DUD‑E targets and definition of the binding sites
The crystal structure of the proteins were taken from the DUD-E dataset (http://dude.docking.org) and prepared using the Protein Preparation Wizard from the Schrödinger suite (http://www.schrodinger.com) as previously described [26]. The obtained mol2 files, with the correct atom types, were used for the four docking programs. To define the binding site, all residues of the protein structure with at least one heavy atom within 5 Å from the ligand were selected. Then, this selection was refined upon individual visual inspection, by adding, when necessary, residues beyond 5 Å that are essential for the continuity of the cavity.
Preparation of the crystal ligands
The mol2 files of the co-crystallized ligand structures were taken from the DUD-E dataset, in which, for each ligand, the major protonation state was given at pH 7. However, for few ligands, the structures had to be curated to ensure the attribution of the correct bond orders and atom types. This was done on the basis of the information given by the articles that accompany the X-ray structures. In order to randomize the 3D structures of the ligands, all the mol2 files were converted to the 2D SMILES for-mat and the Ligprep module of the Schrödinger suite was used to generate a starting 3D optimized conformation for each ligand, using the force field OPLS2005.
Docking and rescoring methods
In order to obtain comparable results with all four pro-grams, we used the docking method that they have in common, the semi-rigid docking, in which the target atoms are fixed and the ligands are flexible. In order to avoid favoring any of the programs, the default param-eters were used for the docking setups. The same pro-cedure was followed for all targets: each program was requested to generate thirty distinct poses, separated by an RMSD greater than 0.5 Å.
Glide
Glide [4, 29] version 6.8 (Schrödinger) was used. Glide docking requires the generation of a cuboid grid centered on the binding site. For this purpose, the rotation of the target was done when necessary and the grid dimensions were adjusted visually to fit the cavity shape. Both the standard precision (SP) [4] and the extra precision (XP) [39] docking modes were used with the Glidescore and
E-model scoring functions [4].
The rescoring of the poses was performed using the “mininplace” docking option, which ensures that the poses are refined locally (minimized in place).
Surflex
The docking with Surflex 2.745 [5, 30] was performed using the “GeomX” mode, which increases the docking accuracy. The docking procedure necessitates the gen-eration of a “protomol”, which consists of a set of hydro-phobic and hydrophilic probes (CH4, NH and CO) that completely fit the cavity surface, making all possible interactions with the binding site residues. The genera-tion of the protomol was based on the binding site resi-due list previously defined.
The rescoring of the poses was performed using the “score_list” command. This procedure automatically includes a local optimization of the poses.
Gold
Gold [3, 32] version 5.2.2 from the Cambridge Crystallo-graphic Data Center (CCDC) was employed. The binding site residues were explicitly specified, as well as the metal ions coordination geometry. The latter was obtained by the prediction module of Gold, combined to the biblio-graphic information about the ion and its surrounding amino acids. The conformational sampling is based on a genetic algorithm and the scoring functions were PLP
[35, 40] and Goldscore [3, 32].
The rescoring of the poses was performed using the standard procedure with the simplex option, where the poses were optimized and rescored. Both PLP and Gold-score scoring functions were considered.
FlexX
FlexX [6] version 2.1.5 (BiosolveIT) was used. The bind-ing site residues were explicitly specified, as well as the metal ions coordination geometry, similarly to what was done for Gold. In FlexX, the small molecule search algorithm is fragment based. The selection of the base fragments was set to automatic mode by using the “selbas a” option, where “a” stands for “automatic”, and the placement of the fragments used the standard algo-rithm (option 3). Each resulting pose was optimized by up to 1000 steps of energy minimizations, with an addi-tional cutoff distance of 3 Å, to allow more interaction partners.
The rescoring of the poses was performed after a local optimization of the pose with 1000 iterations of the local optimizer.
RMSD calculation
Schrödinger suite, which allows us to overcome the sym-metry problem. Only the heavy atoms were considered.
Target characteristics Target families
Only fifty-eight of the 102 targets could be clustered in nine families. The others were kept as miscellaneous pro-teins. To define the protein families, their sequences and 3D structures were compared. All pairs of proteins with more than 20% sequence identity, with homologous 3D structures and with similar functions were gathered into families. More details are given in [26].
The binding site properties
Three properties of the binding site were considered: the total number of atoms at 4 Å from its surface, its hydro-phobicity, i.e., the fraction of carbon atoms among this total number, and its exposure to the solvent. In order to define the surface of the binding site, the protomol gener-ated by Surflex (see above), which closely covers the site, was used. All the heavy atoms of the protein, situated at less than 4 Å from the protomol, were considered as the surface of the cavity. The exposure of the binding site was calculated by using the SiteMap package [41] version 3.3 (Schrödinger). It measures the degree of openness of the site to the solvent. For more details, see [26].
Crystal ligand properties
The physicochemical properties of the ligands were calcu-lated using the canvasMolDescriptors [42] module from the Schrödinger suite. They were all taken directly from the results, except for EC (embranchment count), which was cal-culated by summing the number of atoms involved in three or more covalent bonds. The procedure is detailed in [26].
Statistics
The Spearman correlation coefficients, the Shapiro–Wilk normality test, the parametric Student t-test and the non-parametric Mann–Whitney–Wilcoxon test were calculated using the R program [43].
Energy minimizations
All 120 protein–ligand structures of hs90a were energy
minimized using CHARMM program [44], with the
CHARMM36 force field [36] for the protein and the CHARMM General Force Field (CGen) [37] for the small molecule. This minimization was done with 5000 steps of steepest descent, followed by other 5000 steps of conju-gate gradient algorithms. The electrostatics and van der Waals energy terms were truncated using the switching function with a cutoff distance between 6 and 10 Å, and the dielectric constant was equal to 2 times the distance between the interacting atoms.
Figures
Visual Molecular Dynamics (VMD) [45] was used for the protein images, R [43] for Figure 5 and Kaleidagraph version 4.5.0 (http://www.synergy.com/) for all the other plots.
Abbreviations
DUD-E: Database of Useful Decoys-Enhanced; RMSD: root-mean-square devia-tion; FCA: fraction of carbon atoms; MW: molecular weight; PSA: polar surface area; EC: embranchment count; HBA: hydrogen bond acceptors; HBD: hydro-gen bond donors; RB: rotatable bonds; RC: ring count; PLP: piecewise linear potential; VS: virtual screening; BEDROC: Boltzmann enhanced discrimination of receiver operating characteristic; USC: United Subset Consensus.
Authors’ contributions
The work was directed by LM; the docking and rescoring calculations were done by LC; the analysis of the results and the manuscript writing were done by LC and LM. Both authors read and approved the final manuscript.
Author details
1 Chemistry, Modelling and Imaging for Biology (CMIB), Institut Curie - PSL
Research University, Bât 112, Centre Universitaire, 91405 Orsay Cedex, France.
2 Paris-Sud University, Orsay, France. 3 Inserm, U1196, Orsay, France. 4 CNRS,
UMR 9187, Orsay, France. 5 Present Address: Selebio SAS, 17 rue de la
Barau-derie, 77140 Darvault, France.
Acknowledgements
The authors acknowledge Eric Quiniou for technical help. Vincent Khadige was consulted for English revisions.
Competing interests
The authors declare that they have no competing interests.
Availability of data and materials All data are available in Additional file 2.
Funding
This work was funded by the French program “Investissement d’Avenir – Institut Carnot” managed by the National Research Agency (ANR-11-CARN-008-01).
Publisher’s Note
Springer Nature remains neutral with regard to jurisdictional claims in pub-lished maps and institutional affiliations.
Additional files
Additional file 1: Four supplementary figures. They show the distribu-tion of the protein (Figure S1) and small molecule (Figure S2) properties, the comparison of two scoring functions of Gold and Glide for docking and rescoring (Figure S3) and finally, the comparison of the properties for easy and hard targets (Figure S4).
Received: 22 February 2017 Accepted: 28 May 2017
References
1. Chen YC (2015) Beware of docking! Trends Pharmacol Sci 36(2):78–95 2. Goodsell DS, Olson AJ (1990) Automated docking of substrates to
pro-teins by simulated annealing. Propro-teins Struct Funct Bioinf 8(3):195–202 3. Jones G, Willett P, Glen RC, Leach AR, Taylor R (1997) Development
and validation of a genetic algorithm for flexible docking. J Mol Biol 267(3):727–748
4. Friesner RA, Banks JL, Murphy RB, Halgren TA, Klicic JJ, Mainz DT et al (2004) Glide: a new approach for rapid, accurate docking and scor-ing. 1. Method and assessment of docking accuracy. J Med Chem 47(7):1739–1749
5. Jain AN (2003) Surflex: fully automatic flexible molecular docking using a molecular similarity-based search engine. J Med Chem 46:499–511 6. Rarey M, Kramer B, Lengauer T, Klebe G (1996) A Fast flexible
dock-ing method usdock-ing an incremental construction algorithm. J Mol Biol 261:470–489
7. Kontoyianni M, McClellan LM, Sokol GS (2004) Evaluation of docking performance: comparative data on docking algorithms. J Med Chem 47(3):558–565
8. Perola E, Walters WP, Charifson PS (2004) A detailed comparison of current docking and scoring methods on systems of pharmaceutical relevance. Proteins 56(2):235–249
9. Cummings MD, DesJarlais RL, Gibbs AC, Mohan V, Jaeger EP (2005) Com-parison of automated docking programs as virtual screening tools. J Med Chem 48:962–976
10. Chen H, Lyne PD, Giordanetto F, Lovell T, Li J (2006) On evaluating molecular-docking methods for pose prediction and enrichment factors. J Chem Inf Model 46(1):401–415
11. Warren GL, Andrews CW, Capelli A-M, Clarke B, LaLonde J, Lambert MH et al (2006) A critical assessment of docking programs and scoring func-tions. J Med Chem 49(20):5912–5931
12. Li X, Li Y, Cheng T, Liu Z, Wang R (2010) Evaluation of the performance of four molecular docking programs on a diverse set of protein–ligand complexes. J Comput Chem 31(11):2109–2125
13. Plewczynski D, Lazniewski M, Augustyniak R, Ginalski K (2011) Can we trust docking results? Evaluation of seven commonly used programs on PDBbind database. J Comput Chem 32(4):742–755
14. Spitzer R, Jain AN (2012) Surflex-Dock: docking benchmarks and real-world application. J Comput Aided Mol Des 26(6):687–699
15. Wei BQ, Weaver LH, Ferrari AM, Matthews BW, Shoichet BK (2004) Testing a flexible-receptor docking algorithm in a model binding site. J Mol Biol 337(5):1161–1182
16. Barril X, Morley SD (2005) Unveiling the full potential of flexible recep-tor docking using multiple crystallographic structures. J Med Chem 48(13):4432–4443
17. Morris GM, Huey R, Lindstrom W, Sanner MF, Belew RK, Goodsell DS et al (2009) AutoDock4 and AutoDockTools4: automated docking with selec-tive receptor flexibility. J Comput Chem 30(16):2785–2791
18. Sperandio O, Mouawad L, Pinto E, Villoutreix BO, Perahia D, Miteva MA (2010) How to choose relevant multiple receptor conformations for vir-tual screening: a test case of Cdk2 and normal mode analysis. Eur Biophys J 39(9):1365–1372
19. Cavasotto CN, Abagyan RA (2004) Protein flexibility in ligand docking and virtual screening to protein kinases. J Mol Biol 337(1):209–225
20. Cecchini M, Kolb P, Majeux N, Caflisch A (2004) Automated docking of highly flexible ligands by genetic algorithms: a critical assessment. J Comput Chem 25(3):412–422
21. Liebeschuetz JW, Cole JC, Korb O (2012) Pose prediction and virtual screening performance of GOLD scoring functions in a standardized test. J Comput Aided Mol Des 26(6):737–748
22. Huang N, Shoichet BK, Irwin JJ (2006) Benchmarking sets for molecular docking. J Med Chem 49(23):6789–6801
23. Murphy RB, Repasky MP, Greenwood JR, Tubert-Brohman I, Jerome S, Annabhimoju R et al (2016) WScore: a flexible and accurate treatment
of explicit water molecules in ligand-receptor docking. J Med Chem 59(9):4364–4384
24. Kellenberger E, Rodrigo J, Muller P, Rognan D (2004) Comparative evalu-ation of eight docking tools for docking and virtual screening accuracy. Proteins 57(2):225–242
25. Wang Z, Sun H, Yao X, Li D, Xu L, Li Y et al (2016) Comprehensive evalu-ation of ten docking programs on a diverse set of protein–ligand com-plexes: the prediction accuracy of sampling power and scoring power. Phys Chem Chem Phys 18(18):12964–12975
26. Chaput L, Martinez-Sanz J, Saettel N, Mouawad L (2016) Benchmark of four popular virtual screening programs: construction of the active/ decoy dataset remains a major determinant of measured performance. J Cheminform 8(1):56
27. Mysinger MM, Carchia M, Irwin JJ, Shoichet BK (2012) Directory of useful decoys, enhanced (DUD-E): better ligands and decoys for better bench-marking. J Med Chem 55(14):6582–6594
28. Carugo O (2003) How root-mean-square distance (r.m.s.d.) values depend on the resolution of protein structures that are compared. J Appl Crystal-logr 36(1):125–128
29. Halgren TA, Murphy RB, Friesner RA, Beard HS, Frye LL, Pollard WT et al (2004) Glide: a new approach for rapid, accurate docking and scoring. 2. Enrichment factors in database screening. J Med Chem 47:1750–1759 30. Jain AN (1996) Scoring noncovalent protein–ligand interactions: a
continuous differentiable function tuned to compute binding affinities. J Comput Aided Mol Des 10(5):427–440
31. Eldridge MD, Murray CW, Auton TR, Paolini GV, Mee RP (1997) Empirical scoring functions: I. The development of a fast empirical scoring function to estimate the binding affinity of ligands in receptor complexes. J Com-put Aided Mol Des 11(5):425–445
32. Jones G, Willett P, Glen RC (1995) Molecular recognition of receptor sites using a genetic algorithm with a description of desolvation. J Mol Biol 245:43–53
33. Verdonk ML, Berdini V, Hartshorn MJ, Mooij WTM, Murray CW, Taylor RD et al (2004) Virtual screening using protein–ligand docking: avoiding artificial enrichment. J Chem Inf Comput Sci 44(3):793–806 34. Chaput L, Martinez-Sanz J, Quiniou E, Rigolet P, Saettel N, Mouawad L
(2016) vSDC: a method to improve early recognition in virtual screening when limited experimental resources are available. J Cheminform 8(1):1 35. Verdonk ML, Cole JC, Hartshorn MJ, Murray CW, Taylor RD (2003)
Improved protein–ligand docking using GOLD. Proteins 52(4):609–623 36. Best RB, Zhu X, Shim J, Lopes PE, Mittal J, Feig M et al (2012) Optimization
of the additive CHARMM all-atom protein force field targeting improved sampling of the backbone phi, psi and side-chain chi(1) and chi(2) dihe-dral angles. J Chem Theory Comput 8(9):3257–3273
37. Vanommeslaeghe K, Hatcher E, Acharya C, Kundu S, Zhong S, Shim J et al (2010) CHARMM general force field: a force field for drug-like molecules compatible with the CHARMM all-atom additive biological force fields. J Comput Chem 31(4):671–690
38. Surowiecki J (2004) The wisdom of crowds: why the many are smarter than the few and how collective wisdom shapes business, economies, societies and nations. Doubleday, New York
39. Friesner RA, Murphy RB, Repasky MP, Frye LL, Greenwood JR, Halgren TA et al (2006) Extra precision glide: docking and scoring incorporating a model of hydrophobic enclosure for protein–ligand complexes. J Med Chem 49:6177–6196
40. Korb O, Stützle T, Exner TE (2009) Empirical scoring functions for advanced protein–ligand docking with PLANTS. J Chem Inf Model 49:84–96
41. Halgren T (2007) New method for fast and accurate binding-site identifi-cation and analysis. Chem Biol Drug Des 69(2):146–148
42. Duan J, Dixon SL, Lowrie JF, Sherman W (2010) Analysis and comparison of 2D fingerprints: insights into database screening performance using eight fingerprint methods. J Mol Graph Model 29(2):157–170 43. R Core Team (2014) R: a language and environment for statistical
com-puting. R Foundation for Statistical Computing, Vienna, Austria. http:// www.R-project.org/
44. Brooks BR, Bruccoleri RE, Olafson BD, States DJ, Swaminathan S, Karplus M (1983) CHARMM: a program for macromolecular energy, minimization, and dynamics calculations. J Comput Chem 4:187–217